Technical analysis by AtresCryptoAcademy about Symbol SOL: Buy recommendation (7/21/2025)

AtresCryptoAcademy
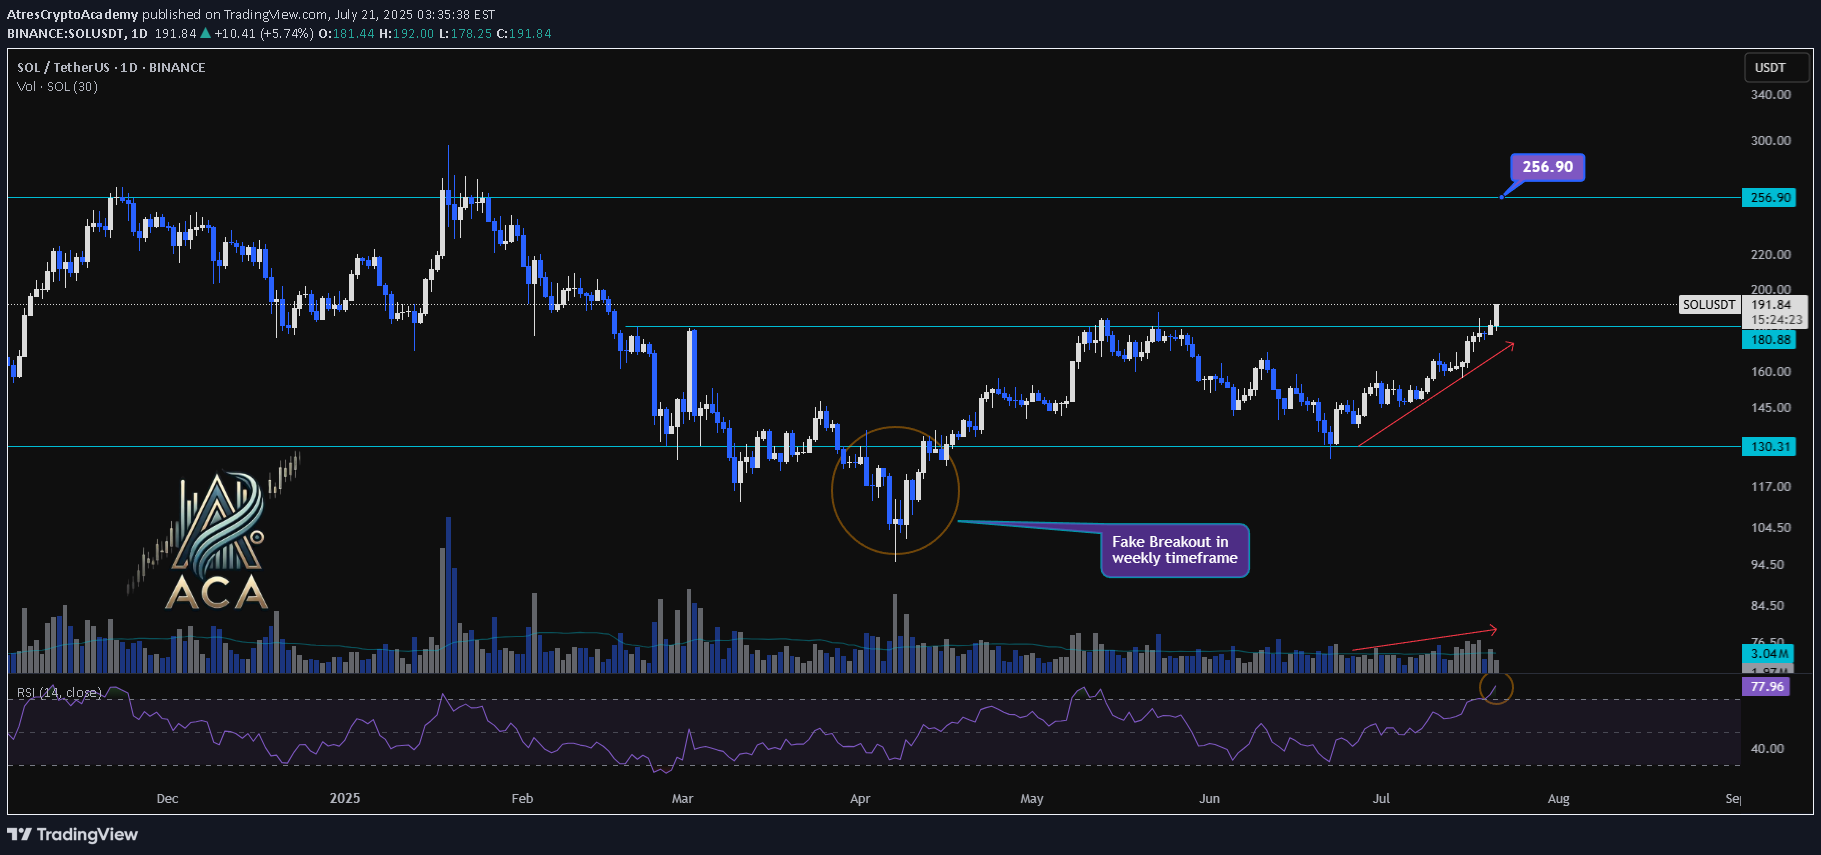
SOLUSDT 1D Chart Analysis | Accumulation Breakout Signals Fresh Momentum 🔍 Let’s drill into the SOL/USDT daily chart, focusing on the recent breakout above the accumulation range, key support and resistance levels, RSI momentum, and volume confirmation for a robust bullish scenario. ⏳ Daily Overview SOLUSDT has decisively broken out above a prolonged accumulation box, marking a significant shift in market structure. A daily close beyond this range now serves as a strong indicator for renewed bullish momentum. RSI is currently above 77, signaling that buyers are commanding momentum. Notably, volume has surged in tandem with price, confirming trader participation behind this breakout move. 📈 Technical Convergence and Trend Structure - Accumulation Zone Break: After consolidating within a clear box for weeks, SOLUSDT closed above the upper boundary (around $180.88–$191.05), signaling a possible trend reversal or continuation. - Daily Close Signal: A daily close outside the accumulation box offers high conviction for bullish continuation. This close acts as a potential entry signal for trend-followers. - RSI Momentum: The RSI sits above 77—deep in the overbought territory. A close here not only confirms buyer strength but often precedes sustained uptrends when accompanied by price breakouts. - Volume Surge: Volume has increased with the breakout, providing confirmation the move isn’t a false start, but likely fueled by real demand. - Weekly Fake Breakout: There was a notable false breakout in the weekly timeframe, quickly reclaimed by bulls. This flip suggests buyers fended off downside attempts and now drive higher prices. 🔺 Bullish Setup & Targets - First Target: $256.90 — marking the next major resistance on the chart and a logical upside objective for traders. - Key Trigger: A confirmed daily (or weekly) close above the accumulation range with strong volume is essential for validating the upward trajectory. 📊 Key Highlights - The breakdown of the accumulation box—now turned support—marks a pivotal structural change. - RSI and price are making new local highs, solidifying the case for continued bullish momentum. - Volume is climbing in sync with the move, offering real confirmation versus a potential fakeout. - Recent fake breakout on the weekly chart, immediately negated, emphasizes that buyers are regaining—and likely maintaining—control. 🚨 Conclusion SOLUSDT appears set for higher prices following the confirmed breakout above the accumulation range. Signs of trend health include an overbought RSI, volume confirmation, and the swift invalidation of a recent weekly fake breakout. As long as daily closes stay above the breakout level, the path remains clear for a rally toward $256.90. A strong daily close and continued volume will be your best signals for bullish continuation.
