Technical analysis by cryptodailyuk about Symbol BTC on 7/20/2025

cryptodailyuk
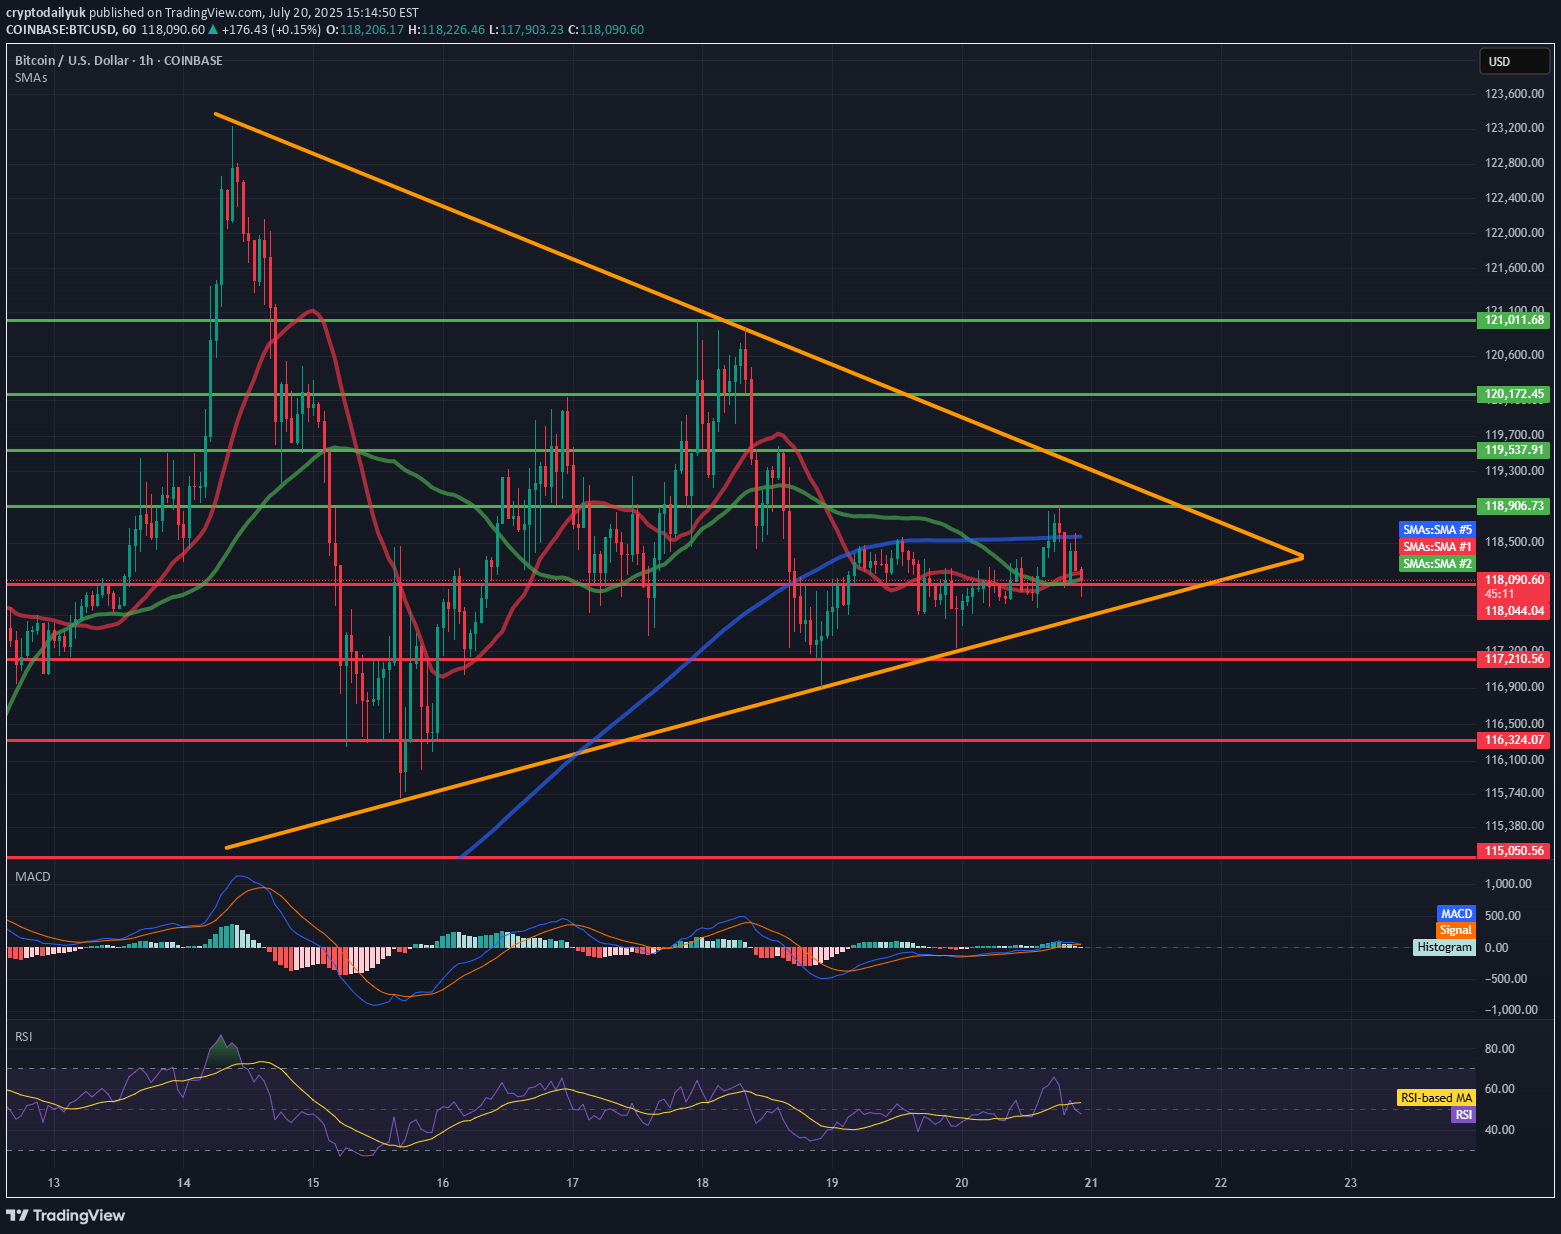
🔷 Pattern: Symmetrical Triangle (Consolidation) The price is inside the triangle formation (orange lines) and is approaching its completion. An impending breakout (up or down) is highly probable within the next few hours. 📉 Support Levels (red lines): 117.210 – local horizontal support. 116.324 – 115.050 – strong demand zone (potential target in the event of a downward breakout). 📈 Resistance Levels (green lines): 118.900 – 119.700 – local resistance zone. 121.011 – 121.813 – higher target in the event of an upward breakout from the triangle. 📊 Technical indicators: ✅ RSI (Relative Strength Index): Currently: 69.05 – close to overbought levels, but not yet at an extreme. Potential for a short-term pullback unless a strong breakout occurs. ✅ MACD: Signal lines are tightly intertwined, histogram flat → no dominant momentum. Waiting for a breakout signal (bullish or bearish crossover). ✅ SMA: Price currently below the 50 and 200 SMA for 1 hour → slight downward momentum. The 50-SMA (red) is turning down, which may signal a continuation of the sideways or downward trend. 📌 Short-term conclusions (1–6 hours): Scenario 1: Bullish breakout: Confirmation: H1 candle close above 118,900. Targets: 119,700 and potentially 121,000–121,800. Scenario 2: Bearish breakout: Confirmation: H1 candle close below 117,200. Targets: 116,300, then 115,000–115,300. 📍 Watch for: Breakout of the triangle boundaries with volume. RSI behavior relative to the 70 level. MACD crossover and histogram.
