Technical analysis by ganndailypips about Symbol ADA on 20 hour ago

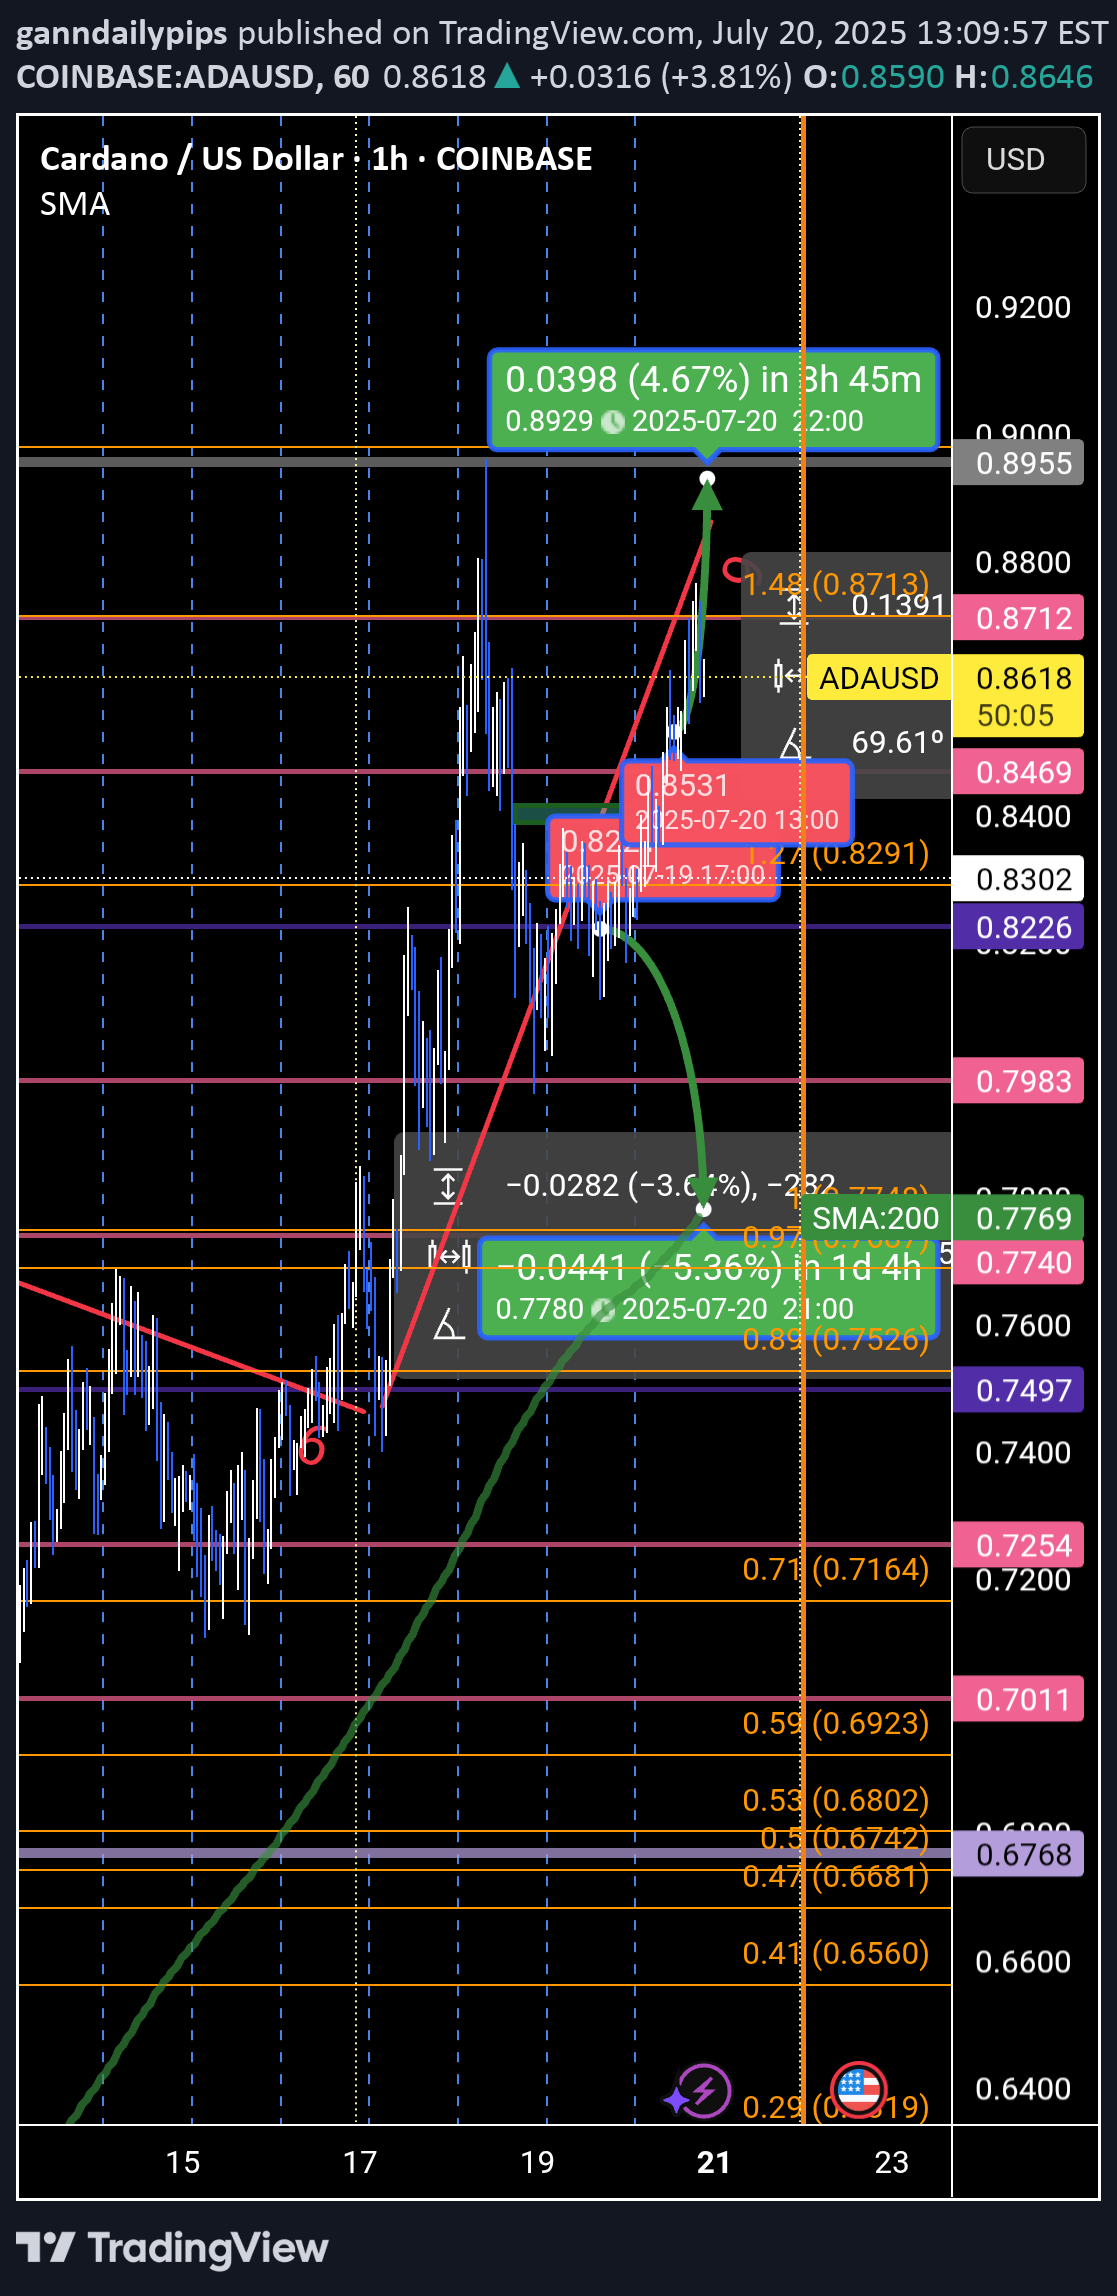
🔄 When Time Speaks, Price Listens #TimeAnalysis | #Cardano | #ADAUSDT | #SmartTrading In my previous ADA/USDT analysis, the mistake wasn’t in the price structure—it was in the timing. The price didn’t reverse where expected, not because the setup was wrong, but because I ignored one critical factor: The time cycle must align with the price cycle. 📌 Here's what really happened: From July 2 to July 7, price moved sideways in a clear accumulation range. Then came an explosive expansion wave (Wave 3) from 0.573 to 0.75, lasting 113 hourly candles. This was followed by a correction wave (Wave 6) of 130 candles. Currently, price is in a distribution wave (Wave 9), ongoing for over 90 candles. 📉 My error? Misalignment between time and price. 📆 After applying my fixed monthly time cycle model, based on the rule that 9 marks the end of every cycle, it became obvious that the price waves were following exact temporal intervals: ➡️ Monthly cycle anchor points: (8 Jan, 7 Feb, 6 Mar, ..., 9 Sep, 8 Oct...) Each month is divided into 3 major time zones, and each zone into two sub-zones. This creates a clean framework where waves naturally unfold: 🔹 3 = Expansion 🔹 6 = Correction 🔹 9 = Distribution 💡 Key Takeaways: Don’t trade predictions. Trade the wave. Every price move is governed by time. Ignoring time leads to premature entries—even with solid technical analysis. 🧠 Want to learn how to read these time-price cycles? Let’s discuss in the comments.
