Technical analysis by EA_GOLD_MAN_COPY_TRADE about Symbol PAXG: Sell recommendation (7/20/2025)

EA_GOLD_MAN_COPY_TRADE
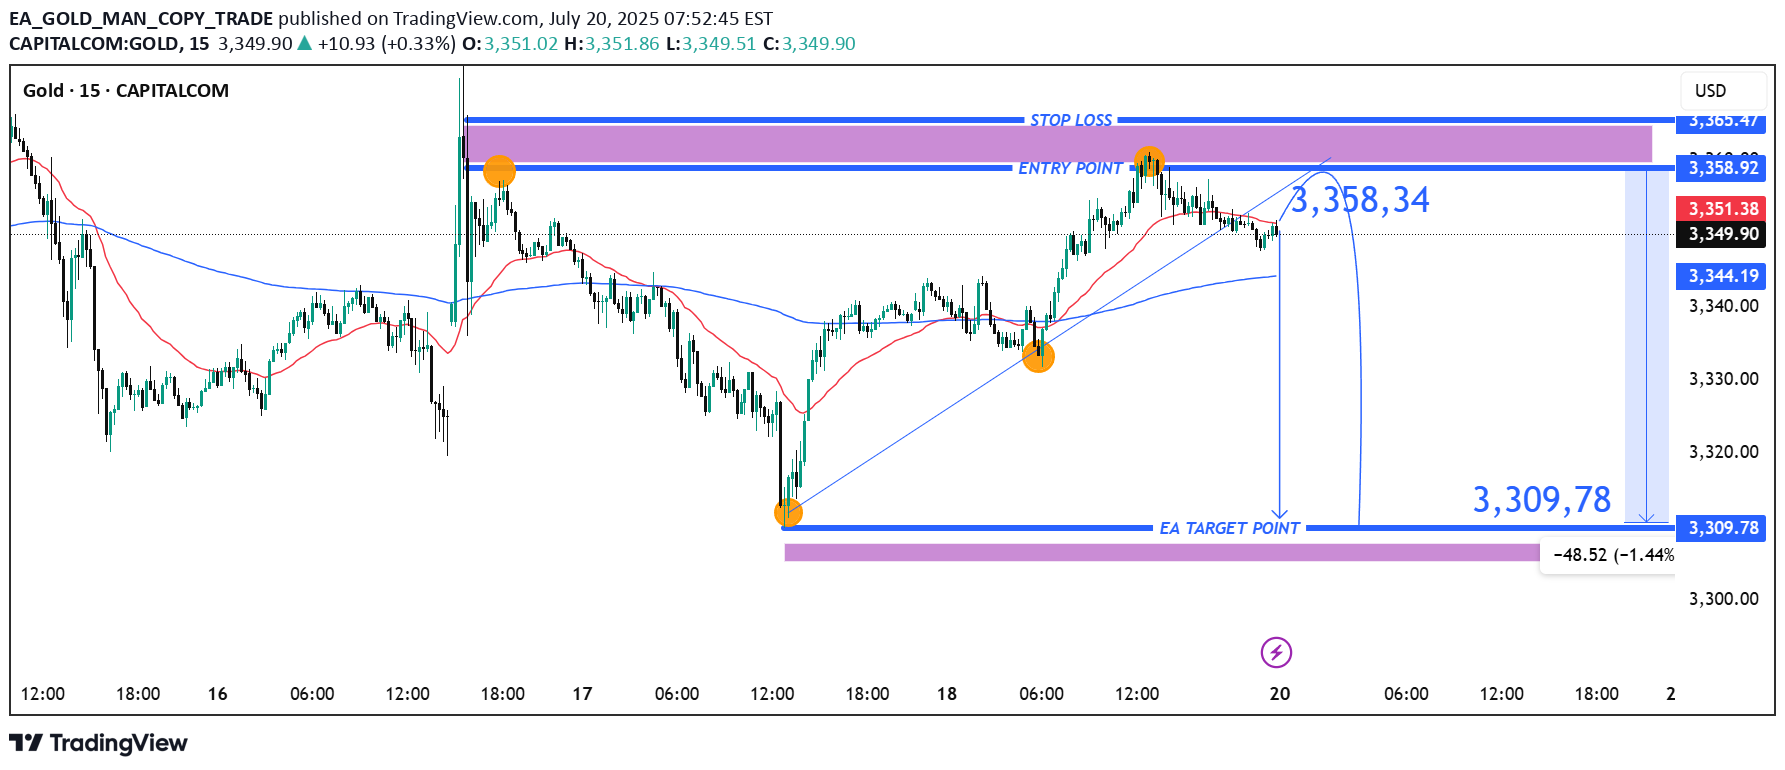
Entry Point: 3,358.34 USD Stop Loss Zone: Around 3,365.47 USD Take Profit (Target): 3,309.78 USD Trade Direction: Sell (Short) 📉 Technical Breakdown: Resistance Zone (Purple Area at Top): Price entered this resistance area and was rejected multiple times (highlighted by orange markers), indicating strong selling pressure. This area also includes the entry point and stop loss region, confirming it's a significant decision zone for bears. Trendline & Moving Averages: A short-term ascending trendline has been broken, suggesting a shift in short-term momentum. The 15 EMA (red) is now flattening, and price is beginning to trade below it, hinting at bearish momentum. The 50 EMA (blue) could act as short-term support but has been pierced slightly. Support & Target Zone (Bottom Purple Area): Target is at 3,309.78, a key horizontal support level and prior demand zone. This represents a 1.44% potential move from the entry, offering a solid risk/reward ratio. ✅ Conclusion: This is a short-term bearish setup based on: Rejection from resistance Bearish divergence signals (via price action) Trendline break and weakening momentum If price sustains below 3,351.38, continuation toward the 3,309.78 target is likely.
