Technical analysis by Mentor_Michael03 about Symbol BTC: Buy recommendation (7/20/2025)

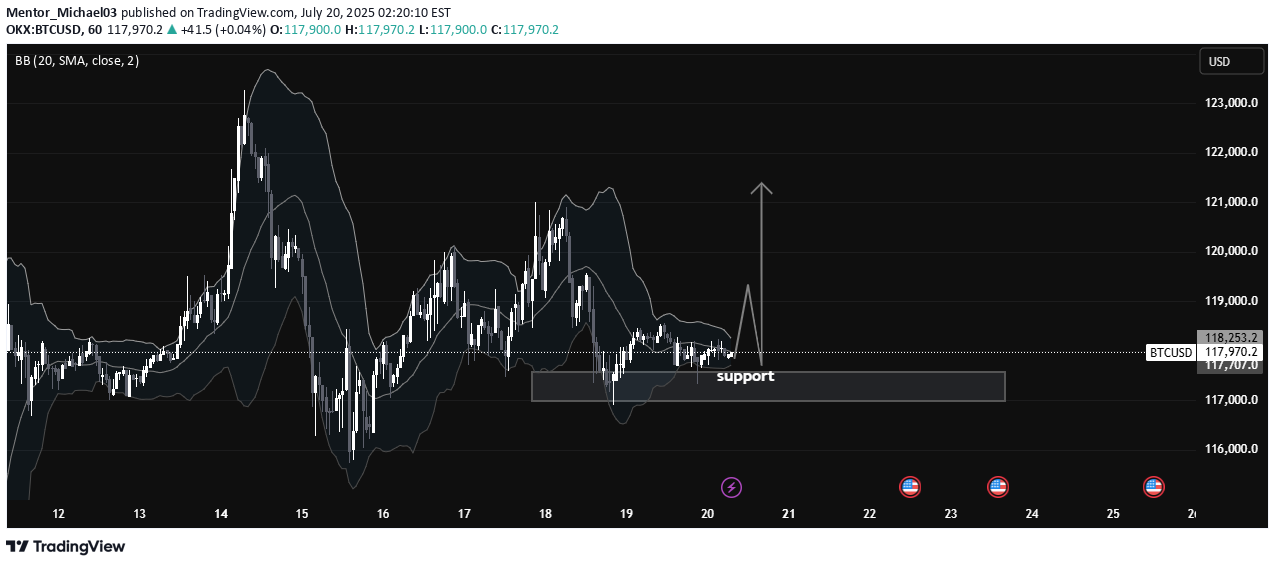
In this 1-hour BTCUSD chart, we observe that price is currently respecting a key support zone between $117,500 and $118,000, which has held strongly over the past few sessions. This region has acted as a strong demand zone, with visible buying pressure every time the price dips into it. The chart clearly shows multiple rejections from this zone, indicating that smart money participants are accumulating here. We also see the Bollinger Bands (20 SMA) tightening around the price. This narrowing of the bands signifies low volatility and a potential expansion move. Such squeezes are often followed by impulsive breakouts or breakdowns, and traders should be alert for a decisive candle close above or below the range to confirm direction. 🧠 Market Structure & Technical Insights: Support Holding: Price is consolidating above a major support level at $117,500–$118,000, which has been tested multiple times but not broken. Accumulation Phase: The sideways structure after a previous impulsive move suggests that price is possibly in a re-accumulation phase before another leg up. Liquidity Above Range: There's a visible liquidity pool above recent highs (~$118,600–$119,000), which could be targeted if bulls take control. Volatility Squeeze: Bollinger Bands are compressing, showing signs of accumulation. Such patterns typically lead to a breakout move, especially if paired with volume. Candle Behavior: Long wicks from below the support show aggressive buying interest, rejecting lower prices. This is a bullish signal. 🎯 Potential Scenarios: 1. Bullish Breakout: If BTCUSD breaks and closes above the mini resistance near $118,600–$119,000, we may see a quick move toward $120,500 and $122,000. A breakout backed by volume and momentum would confirm strength and trend continuation. 2. Bearish Breakdown: A break below $117,500 with a strong bearish candle and increased volume would invalidate the bullish bias and may open the downside toward $116,000 and possibly $114,500. This would indicate failure to hold support, transitioning into a distribution phase. 3. Range-Bound: Until we get a clear break in either direction, price may continue to range between $117,500 and $118,600. Best approach is to remain patient and wait for breakout confirmation. 📚 Educational Note: This is a textbook setup for many smart money traders—a compression near a strong support level with low volatility. Such patterns reflect market indecision, but also the potential energy build-up for a significant move. Traders should focus on risk management and confirmation instead of predicting direction blindly. ✅ Key Levels to Watch: Support: $117,500 Resistance: $118,600 – $119,000 Breakout Target: $120,500 – $122,000 Breakdown Target: $116,000 – $114,500BTC/USD Update: Half Target hit successfully! 🎯 Price bounced perfectly from the marked support zone and followed the projected bullish path. Half target reached as expected — clean and precise move according to plan. ✅📈
