Technical analysis by Nabi_Gunduz about Symbol PAXG on 7/19/2025

Nabi_Gunduz
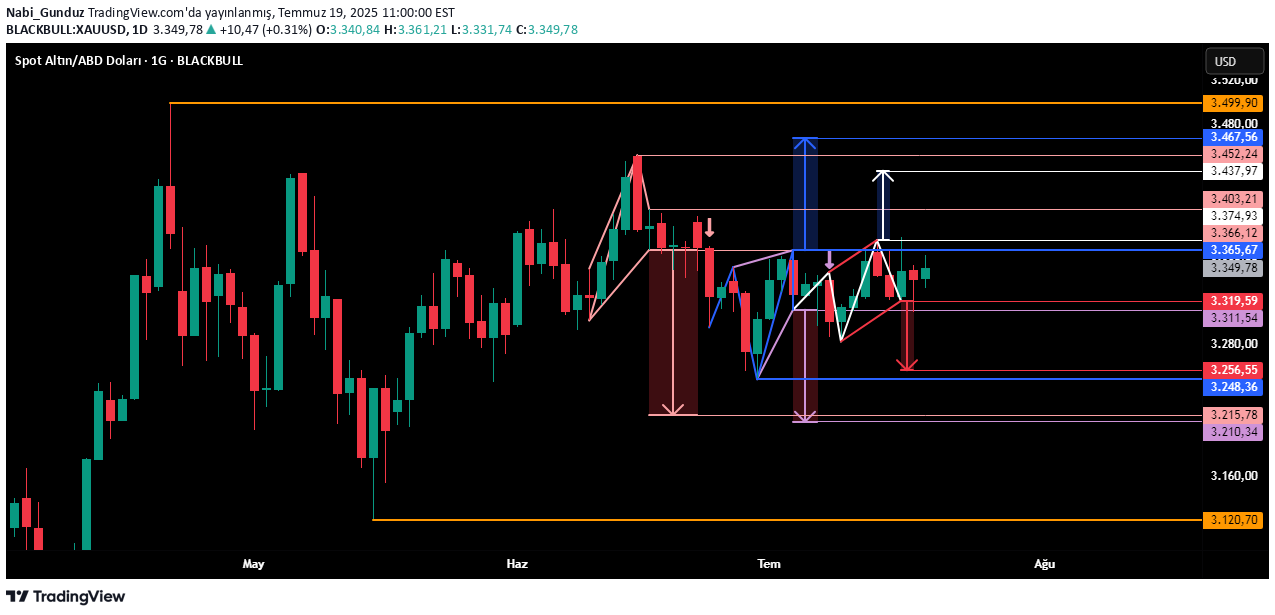
Hello, I have prepared 7 different graphics drawings for you and I will try to explain all of them under this sharing ... In the graph on the main sharing of the daily time period, 5 graphic formations occurred during the 1 -month price movements, and two of them produced signals, but the signals have not yet achieved their main targets. What is remarkable is that three of these 5 formations are a decrease formation and the two signals have produced the Sell signal ... But quite a long time since the signals ... 18 processing day over the first Sell signal, 8 process days over the secondll signal. Before the 2 and 4 processing day, 1 buy and 1 sell formation has not yet produced signals. The signal level of the formation seen with red is 3319.59 and the main target of the formation after the daily candle closure may be 3256.55. The signal level of the formation seen with white is 3374.93 and the main goal of the formation after the daily candle closure that may be on this level will be 3437.97. In this daily graph, the region in which the gray -watered region in the $ 200 band range is the region where the price of the price begins to live in consolidated formation. Apparently, this region will not be possible to offer a healthy idea about the direction of the price without breaking one side. The graph has 3 harmonic and 1 graphical formation. Fractures should be carefully monitored. If we want to narrow the gray consolidation zone in the previous Gragfik, this time we can take into account the upper and alt boundaries of the FVG regions, which are now seen with blue and the IFVG region, which is currently the resistance zone and red. In this graph, you see the parallel channel, modified Schiff Dirgen and Fibonacci channel drawings in the daily time period ... Parallel channel and Dirgen show the levels to be followed for price movements after June 16, and the Fibonacci channel shows the levels to be followed for the price movements after June 30th. I didn't pricit the levels because the pricing lines will vary at the slope of each day after every day. Therefore, it would make more sense to make your own drawing and follow your wave structures on the graph according to the price movements I specify ... In this graph, Tom also shows a drawing according to Mark Trend technique and blue lines should be followed daily and red lines should be followed with weekly candle breaks. This graph, which is in a 4 -hour time period, has a large signal, but there is a FVG area as resistance in front of the price. The 4 -hour candle closure that may be over 3356.86 will convert this region into IFVG and will serve as the region support zone. This will strengthen the likelihood of working the Buy Signal ... And finally, you can see frequently intermittent support resistance zones in this graph in this graph. Good holidays ...
