Technical analysis by ActuaryJ about Symbol PAXG: Buy recommendation (7/18/2025)

ActuaryJ
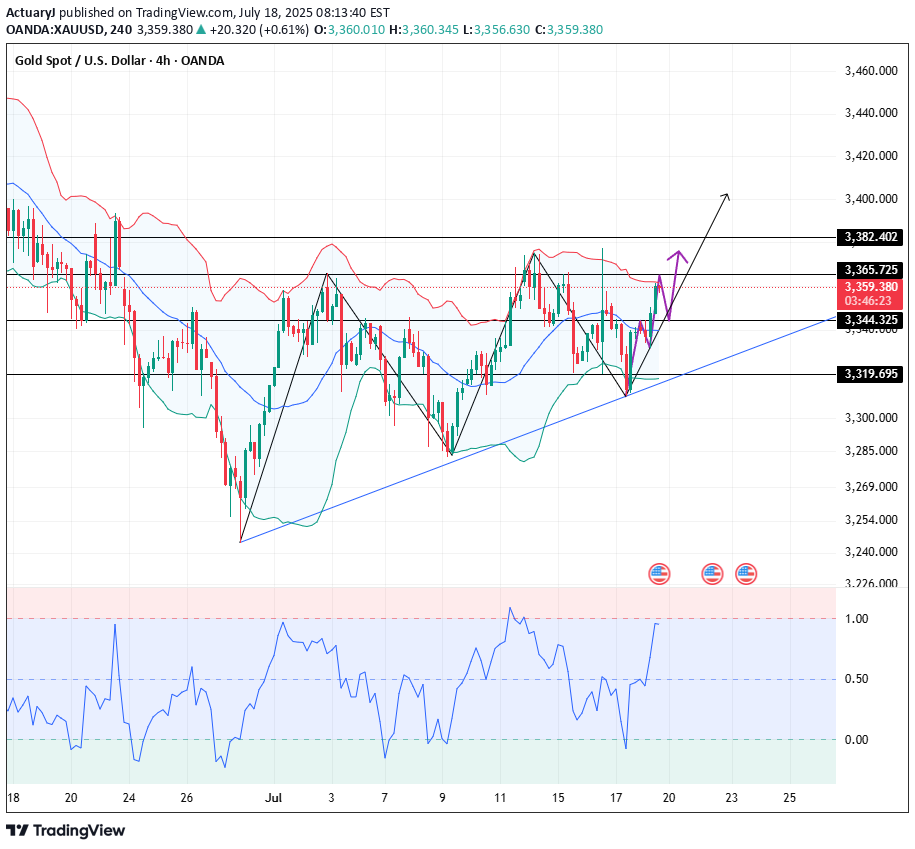
Gold technical analysis Daily chart resistance: 3382, support: 3310 Four-hour chart resistance: 3375, support: 3332 One-hour chart resistance: 3365, support: 3345. From a technical perspective, the price of gold has recently formed a wide range of fluctuations in the range of 3310-3365 US dollars, reflecting the unclear market direction. At present, the short-term moving average of gold is supported at 3332, and other periodic indicators are also in a bullish arrangement. The overall decline at the hourly level is limited, and the bulls still have the momentum to rebound. 3310 on the daily chart constitutes a key support. If it falls below, it may fall to the July low of 3287-3282. On the upside, if the resistance level of 3366 US dollars is effectively broken, it may trigger short stop losses and push the gold price back to the 3400 US dollar mark. Pay attention to the resistance of 3366-3377 above and the support of 3345/3332 below BUY: 3345near SELL: 3365near
