Technical analysis by Henrybillion about Symbol PAXG on 7/18/2025

Henrybillion
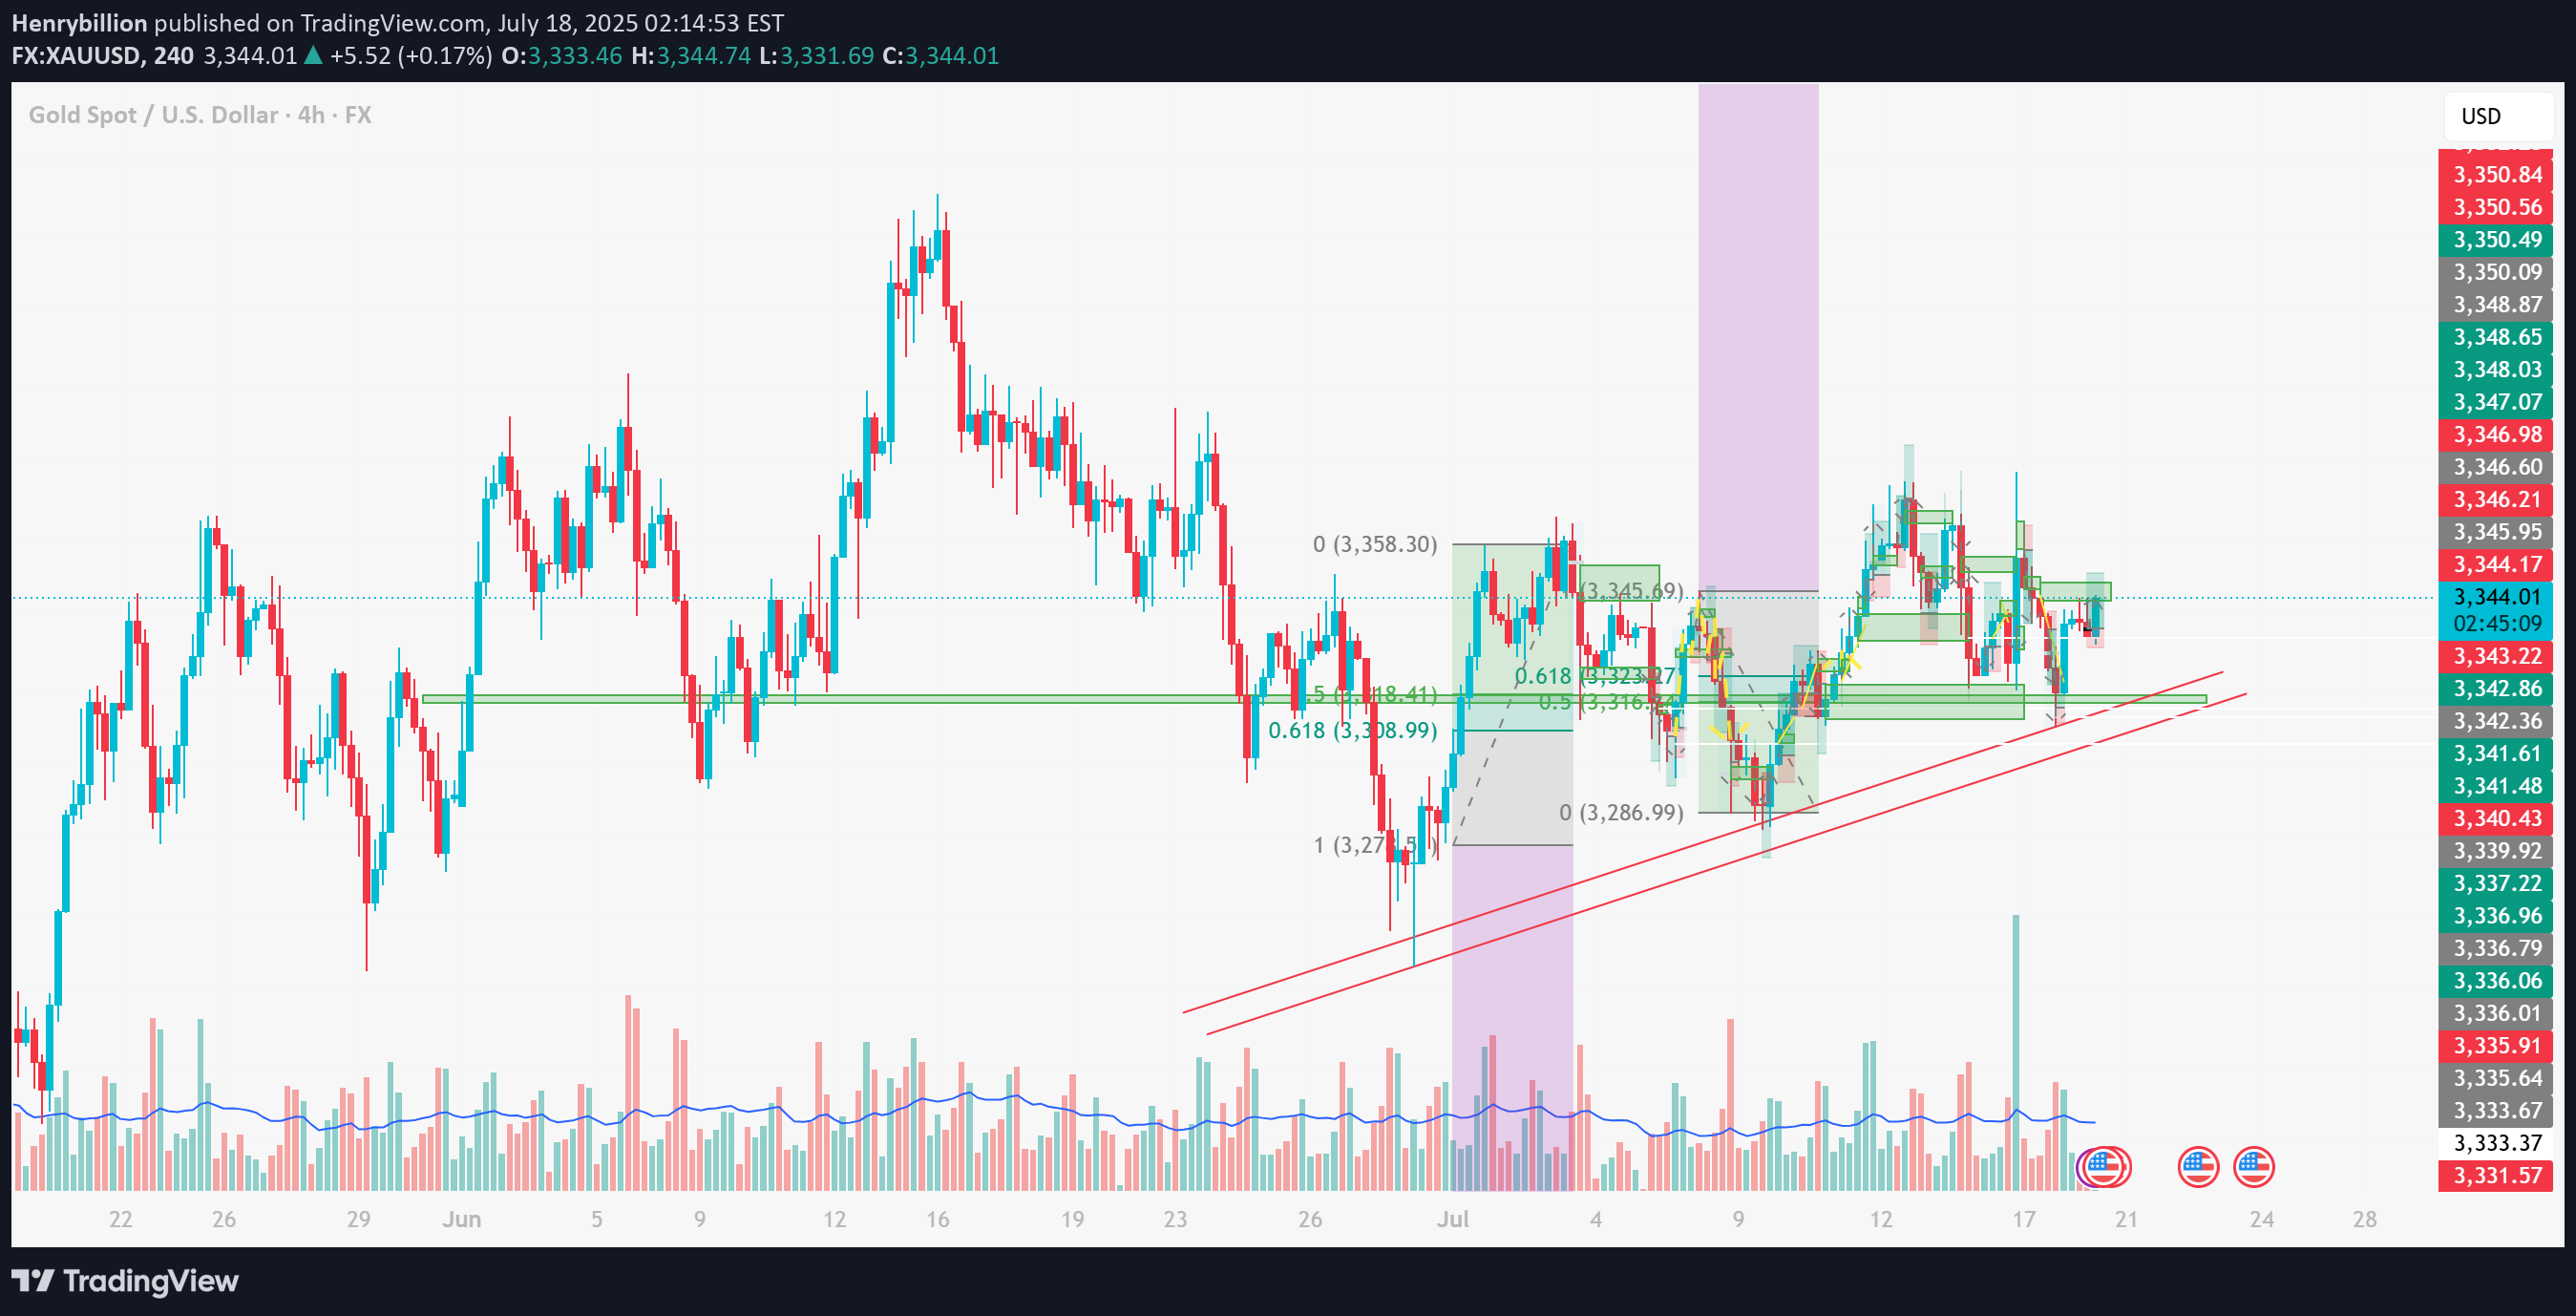
XAUUSD ANALYSIS – JULY 18: STRATEGY BASED ON FIBONACCI, TRENDLINE & STRUCTURE 1. XAUUSD Technical Overview (4H Chart) Gold (XAUUSD) is currently trading around 3,343 USD, showing signs of a slight rebound from key support. On the 4H timeframe, the price structure is forming higher lows, maintaining above a short-term rising trendline – a technically bullish signal. 2. Key Support & Resistance Zones Immediate Supports: 3,338 USD: aligning with the 0.618 Fibonacci retracement – a zone tested multiple times. 3,333 – 3,335 USD: strong support, overlapping with EMA and rising trendline. 3,327 USD: previous swing low – last defense for the bullish structure. Immediate Resistances: 3,345 – 3,346 USD: frequently rejected zone in recent sessions. 3,350 USD: psychological and technical resistance. 3,358 USD: recent swing high – breakout confirmation level. 3. Price Action & Fibonacci Confluence Price is currently hovering between Fibo 0.5 (3,343 USD) and Fibo 0.618 (3,338 USD) – a potential bounce zone if bullish momentum holds. The pullback from 3,358 to 3,286 has respected standard Fibonacci retracement levels, confirming technical price behavior. 4. Trendline Analysis The ascending trendline from the 3,275 USD low remains intact, providing solid dynamic support. If the price continues to bounce from this trendline, it may form a bullish continuation pattern (flag/pennant). 5. Suggested Trading Strategies Long Entry: 3,338 – 3,340 USD SL: 3,327 USD TP: 3,345 – 3,350 – 3,358 USD Note: Buying the dip near Fib & trendline Short Entry: Below 3,327 USD (breakdown) SL: Above 3,340 USD TP: 3,310 – 3,298 USD Notes: Only if price breaks trendline & support 6. Supporting Technical Indicators EMA20/EMA50 show slight upward momentum – early bullish bias. RSI (14) hovers near 50 – neutral zone, awaiting breakout confirmation. Conclusion: Gold is consolidating around a critical support zone. The short-term bias leans bullish if the 3,338 – 3,333 USD region holds and price breaks above 3,346 – 3,350 USD. This is a key moment to position early using Fibonacci and trendline confluence. 👉 Follow for more strategies in upcoming sessions. Save this if you find it useful! Do you have a different view? Share your thoughts in the comments below!Do you have any ideas or insights? Let’s share and discuss in the comments below!
