Technical analysis by ActuaryJ about Symbol PAXG: Sell recommendation (7/17/2025)

ActuaryJ
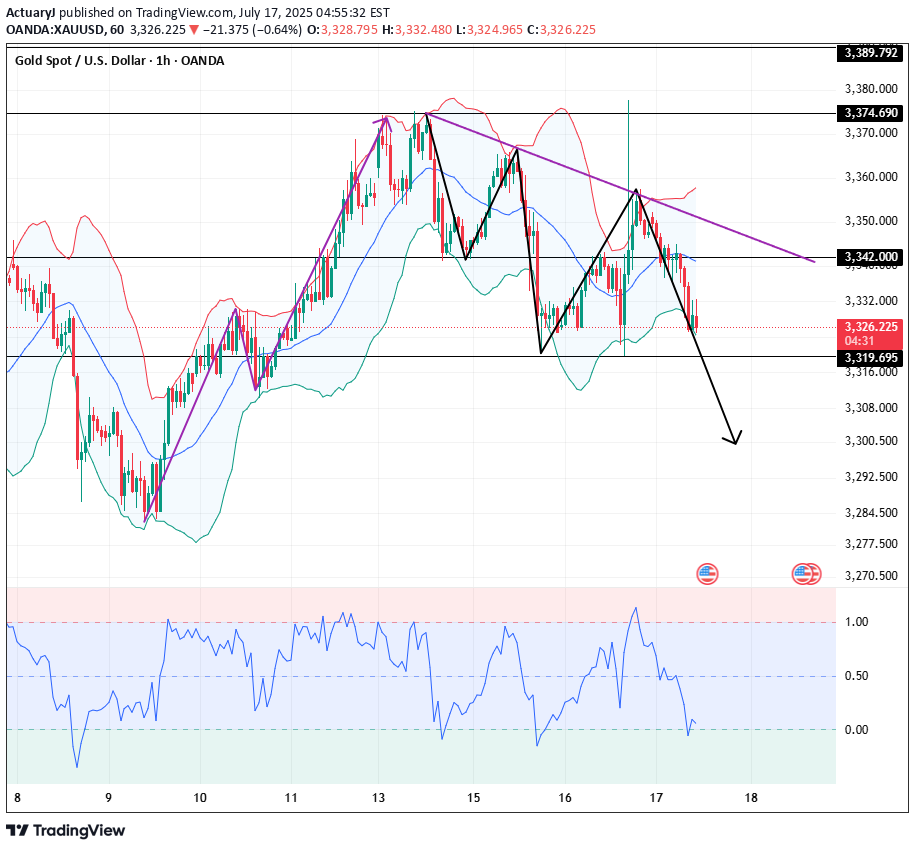
Gold technical analysis Daily chart resistance: 3382, support below 3300 Four-hour chart resistance: 3375, support below 3320 One-hour chart resistance: 3352, support below 3320. Trump's remarks in the NY market on Wednesday ignited the market. First, it was reported that Powell would be fired, and then it was reported that Trump denied the news. Gold quickly rose to 3375 and then quickly fell back. Under the impact of the news, the price fluctuated very quickly, jumping up and down quickly. From the current market trend, the day before yesterday, it fell to 3319 and stopped falling and rebounded. Yesterday, it tested 3319 again and quickly pulled up. Yesterday, the price hit the high point of this week near 3375 again and fell back quickly. There is support below and resistance above. If it approaches the 3320 support for the third time today, it is likely to fall below, and then trigger a long stop loss, and it may fall rapidly at that time. If it falls below 3319, it will look at the 3280~3300 range. SELL:3319 SL:3324 SELL:3352 SL:3357As I said, a break below 3319 triggered long stops, with the lowest point reaching 3312.
