Technical analysis by behdark about Symbol ETH on 7/15/2025

behdark
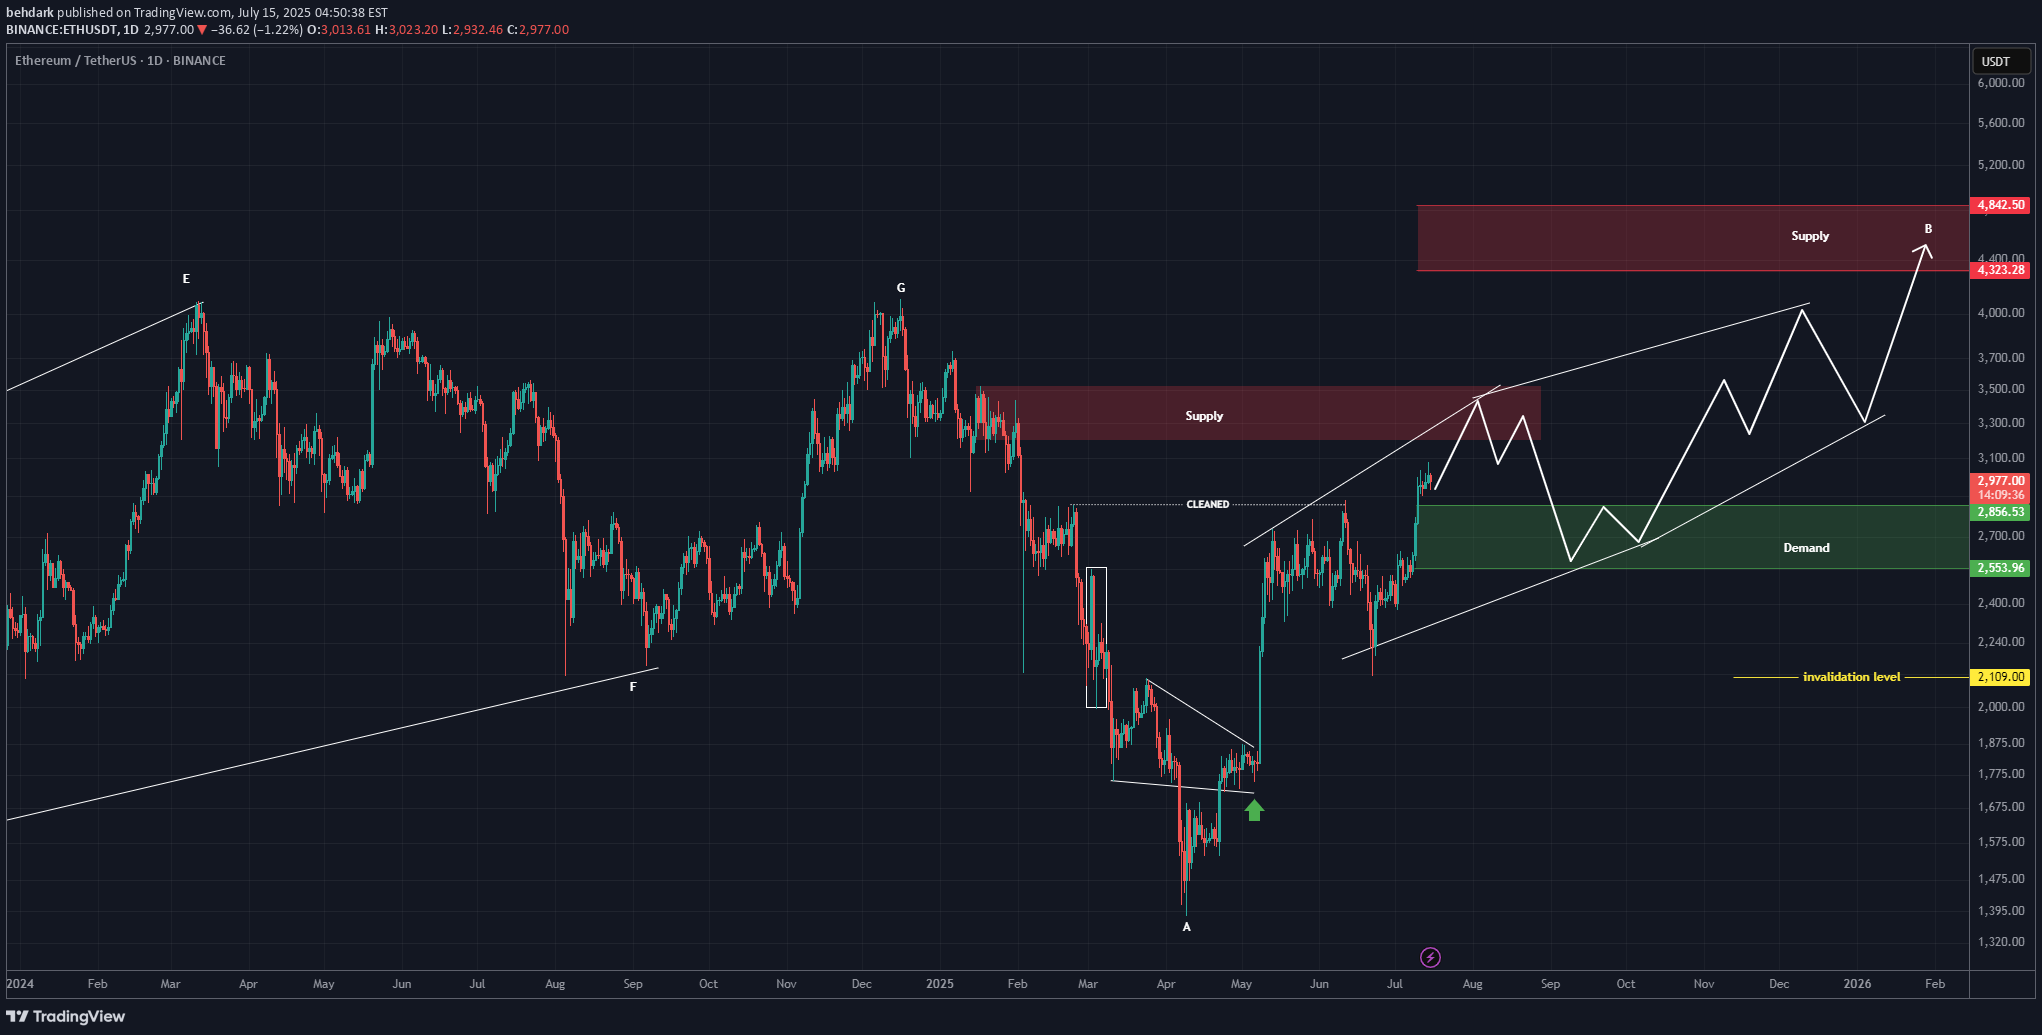
The previous phase of Ethereum appears to have been a completed diametric, and now it seems we are in a flat pattern. It can be said that we are currently in wave B of the flat, which itself appears to be a diametric. This diametric could even extend to the 4300–4800 range. The green zone is the rebuy area. A daily candle close below the invalidation level would invalidate this analysis. For risk management, please don't forget stop loss and capital management Comment if you have any questions Thank YouSince the time of analysis, the price has pumped over 16% 🔼 and has reached the red zone A yellow zone has been added to the chart, which represents a flip area. The candles reclaimed this level with strength but haven't made a pullback to it yet. Given the interaction with the supply zone and the lack of a pullback to the flip area, a drop toward the yellow and green zones is expected. The bullish momentum has been strong so far; therefore, the price drop and Ethereum's preparation for a pullback may take some time.
