Technical analysis by Mission_Money about Symbol PAXG: Sell recommendation (7/16/2025)

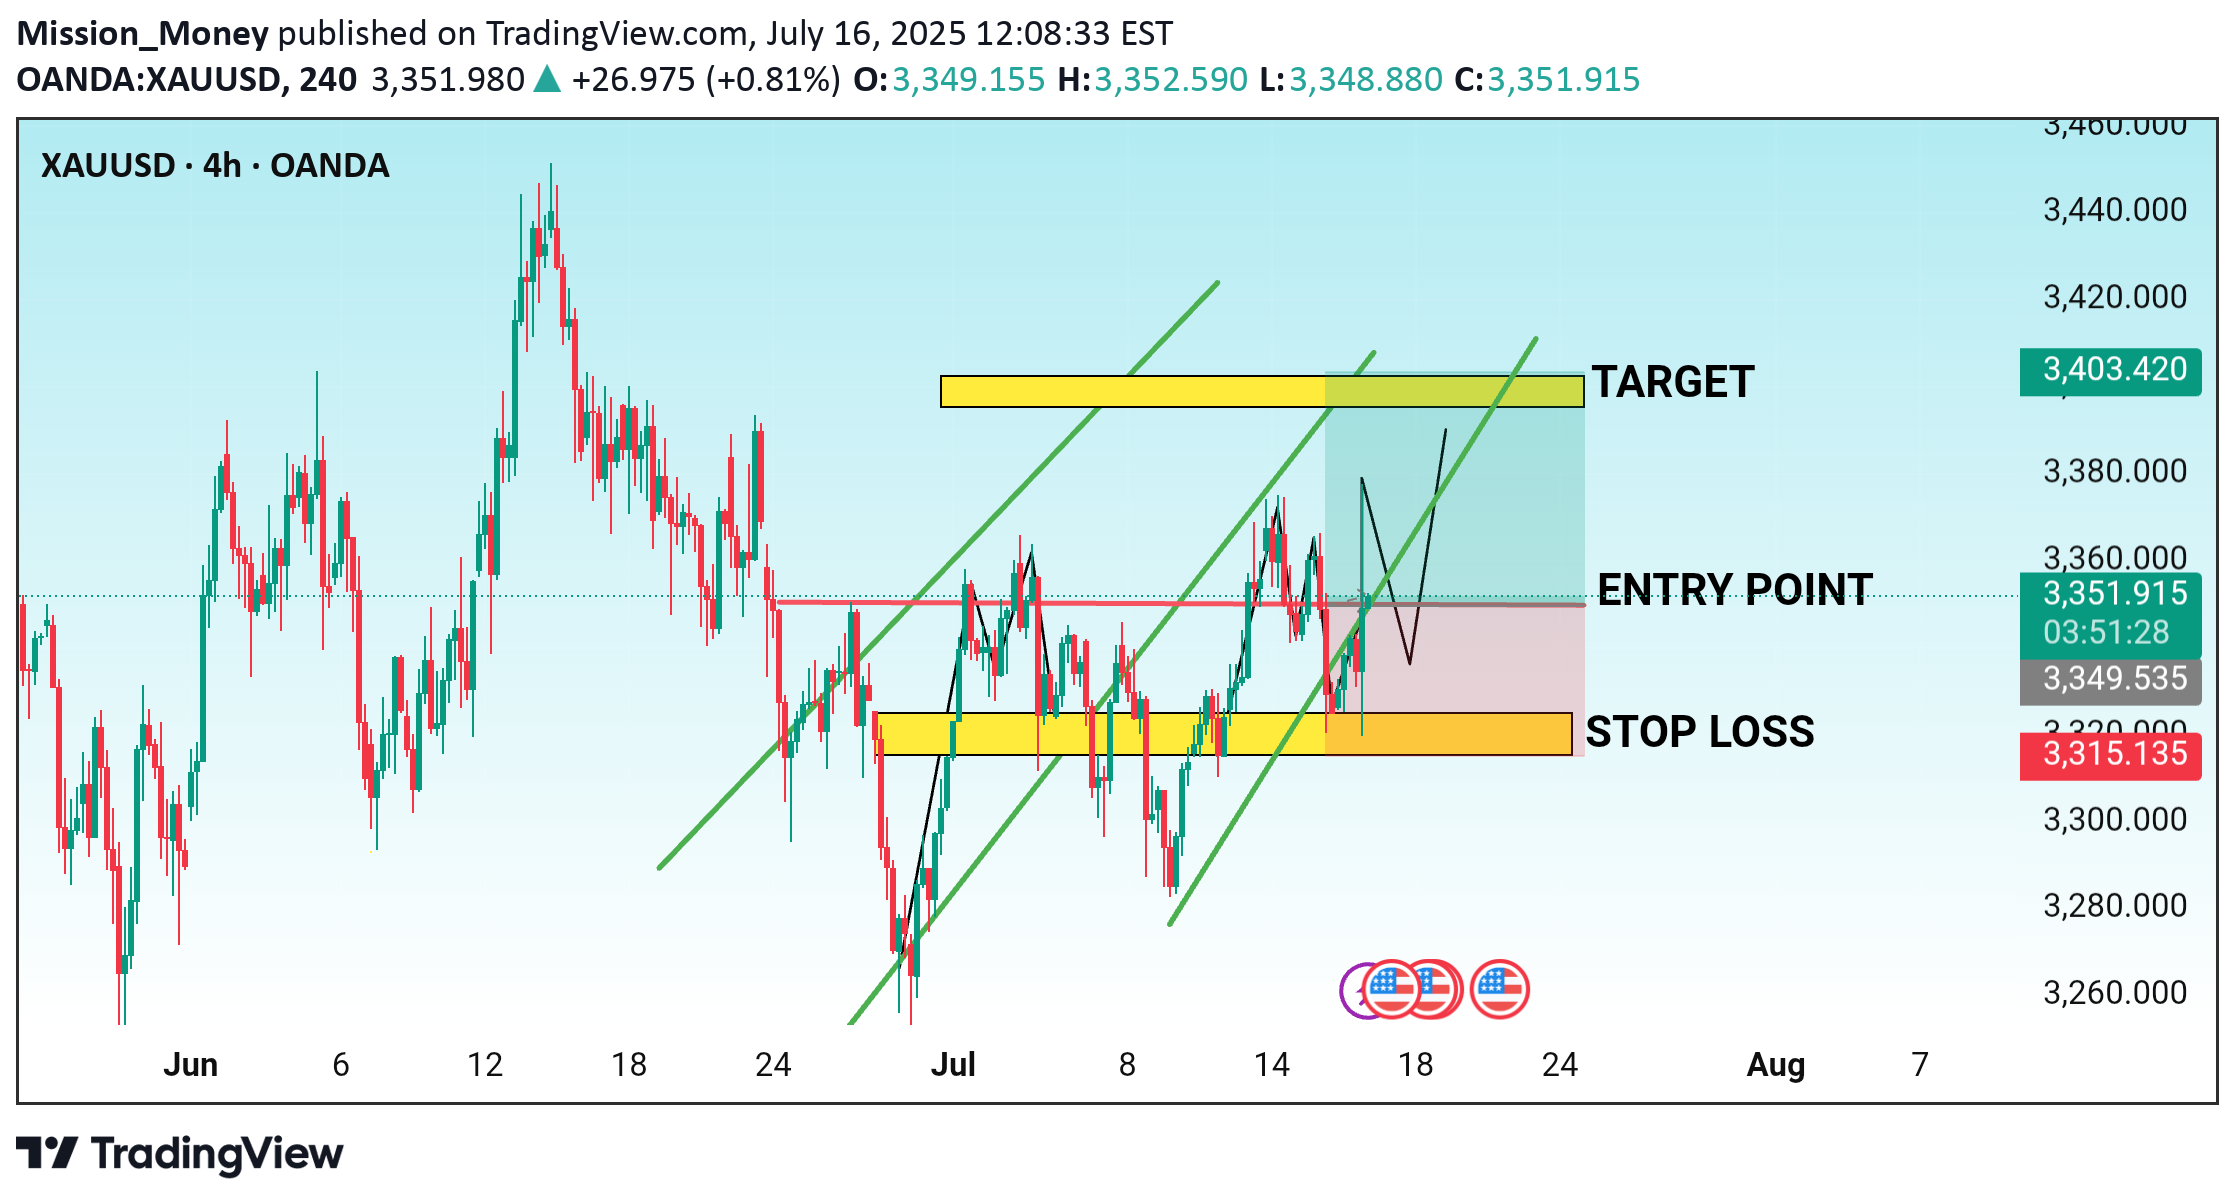
This is a 4-hour chart for XAUUSD (Gold vs US Dollar) from TradingView, showing a long (buy) trade setup with a defined entry, stop loss, and target. Trade Setup Overview: Timeframe: 4-hour (H4) Instrument: XAUUSD (Gold/USD) Broker: OANDA Chart Date: July 16, 2025 --- Key Levels: Entry Point: ~3,349.955 This level is marked around a resistance-turned-support zone, indicating a breakout retest. Stop Loss: ~3,315.135 Placed just below a highlighted demand/support zone. If the price dips below this, the setup is invalidated. Target (Take Profit): ~3,403.420 Positioned near the upper boundary of the current rising channel and a previous resistance area. --- Technical Structure: Ascending Channel: The price is moving within a rising channel (green lines). The trade idea follows this bullish trend. Support Zone (Yellow Box at Bottom): The price previously bounced here multiple times, confirming it as a demand zone. Resistance Zone / Target Area (Yellow Box at Top): Price has previously reversed here; hence, it’s marked as the potential take-profit area. Projected Price Action (Black Arrows): Suggests a possible dip into the support before resuming upward toward the target. --- Trade Plan Summary: ParameterValue Entry3,349.955 Stop Loss3,315.135 Target3,403.420 Risk-Reward≈ 1:1.58 This plan assumes a bullish continuation. The strategy hinges on price holding above the lower yellow support zone. A break below invalidates the setup.
