Technical analysis by SupertradeOfficial about Symbol BAKE: Buy recommendation (7/16/2025)

SupertradeOfficial
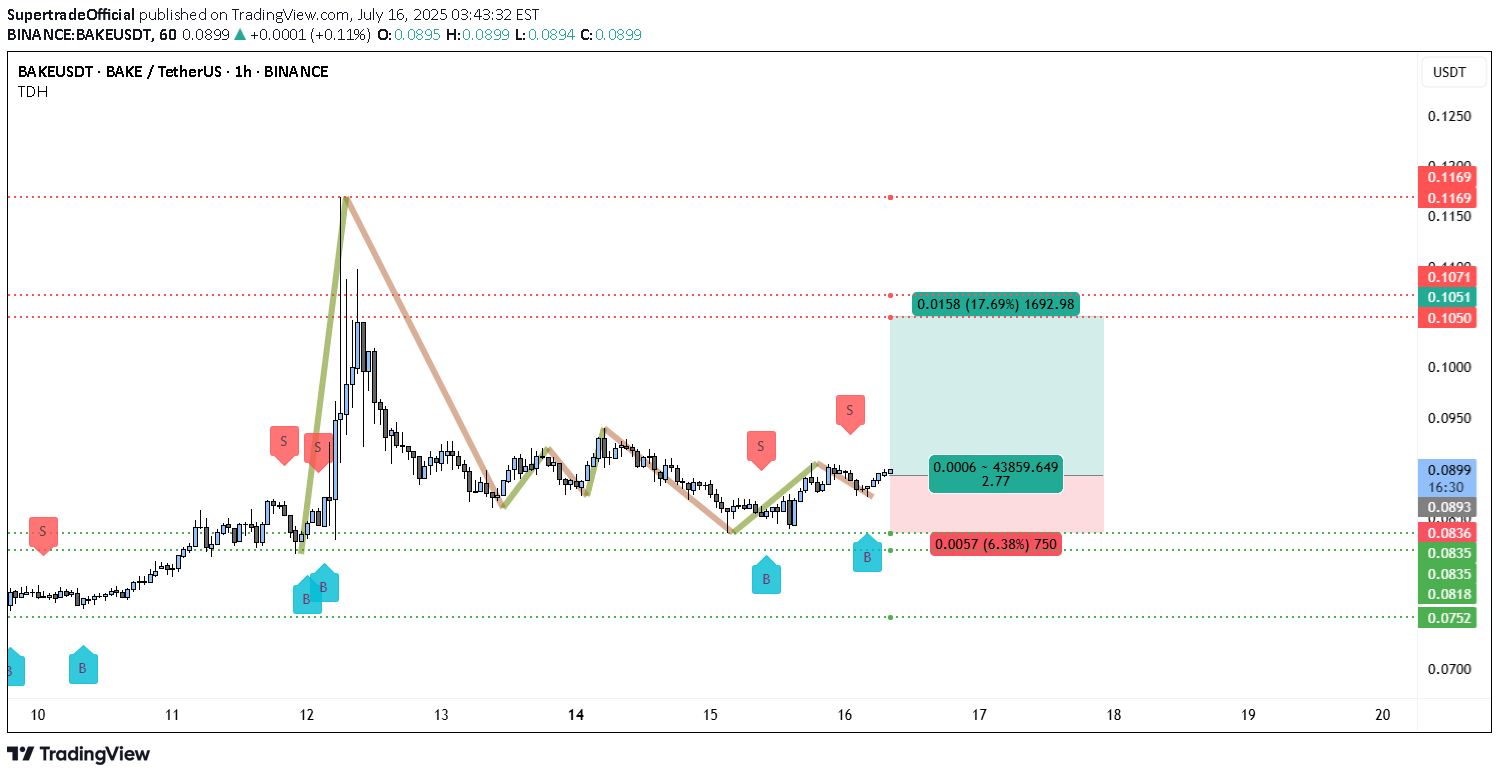
The chart shows BAKEUSDT trading around 0.0898 USDT on Binance. Overall, the structure indicates that after a strong upward impulse from approximately 0.0835 USDT to 0.117 USDT, the price entered a correction and is now consolidating. This consolidation sits just above an important support level, signaling a possible preparation for the next leg up. There is a clearly defined support area between 0.0835 and 0.0836 USDT, which has been tested multiple times. The most recent lows were bought up strongly, forming what looks like a potential double bottom or higher low, both common reversal patterns. Beneath this zone, the next deeper support rests near 0.0752 USDT, which would be considered only if the main support fails. Overhead, the chart identifies resistance levels at 0.1050–0.1071 USDT, where price previously stalled and retraced. This zone aligns with the first target area for any bullish continuation. Further up, 0.1169 USDT marks the prior swing high and the most significant resistance to break for confirmation of a larger trend reversal. Visually, the chart illustrates how the strong impulse rally was followed by a structured pullback, resembling an ABC correction pattern. The correction appears mature, as price action is tightening within a smaller range. This often suggests that momentum is getting ready to shift back upward if buying pressure sustains. Several buy signals ("B") are marked on the chart near support zones, while sell signals ("S") have appeared near previous short-term peaks. The clustering of buy signals around the current levels reinforces the idea that traders have been accumulating positions in this area. Below is the trading setup outlined on your chart: •Entry Zone: Around 0.0898 USDT •Stop Loss: Slightly under 0.0836 USDT to protect against a deeper retracement •Take Profit Target: Between 0.1050 and 0.1071 USDT (initial target) •Risk/Reward Ratio: Approximately 2.77, which is favorable for long positions •Potential Gain: +17.69% from entry to target •Potential Loss: -6.38% if the stop is hit The highlighted risk/reward box shows the trade aims to capture a substantial move while limiting downside exposure. The overall price behavior indicates that sellers failed to create new lows, and instead, the market printed a higher low above the key support zone. This is often one of the first signs that demand is absorbing supply and can set the stage for an upside breakout. While volume data isn’t visible in the chart you shared, typically in this kind of setup, volume contracts during the correction phase and begins expanding again when price approaches a breakout point. Watching for rising volume on any move above 0.0900 USDT could confirm bullish intent. If price breaks and closes above 0.0900 USDT on the hourly timeframe, this would be the first signal that momentum is flipping decisively in favor of the bulls. Ideally, you want to see a retest of this level hold as support, which would further validate the move. From there, a push into the 0.1050–0.1071 USDT resistance area becomes more probable. If this level is cleared on strong momentum, the extended target near 0.1169 USDT could be achievable. In terms of sentiment, the fact that multiple buy signals have appeared near the support zone while sellers are absent near the lows reinforces a bullish bias. The risk is primarily centered around whether the 0.0835 USDT level holds. If price closes decisively below it, that would invalidate the current bullish thesis and potentially expose the market to a deeper drop toward the 0.0752 USDT support area. Overall, the chart presents a constructive technical picture favoring further upside, provided that support holds and buyers can reclaim the short-term resistance above 0.0900 USDT. The consolidation phase appears to be maturing, and the combination of higher lows and consistent rejection of support zones increases the likelihood of a breakout. Summary of the Bullish Scenario: •The trend structure shows a strong impulse and controlled pullback. •The price has respected a key support area repeatedly. •Buy signals are clustered near the lows, suggesting accumulation. •A breakout above 0.0900 USDT could trigger a rally toward 0.1050 USDT and potentially higher. •The risk/reward profile is attractive, offering nearly 3 times the reward relative to the risk.
