Technical analysis by Mihai_Iacob about Symbol PAXG on 7/16/2025

Mihai_Iacob
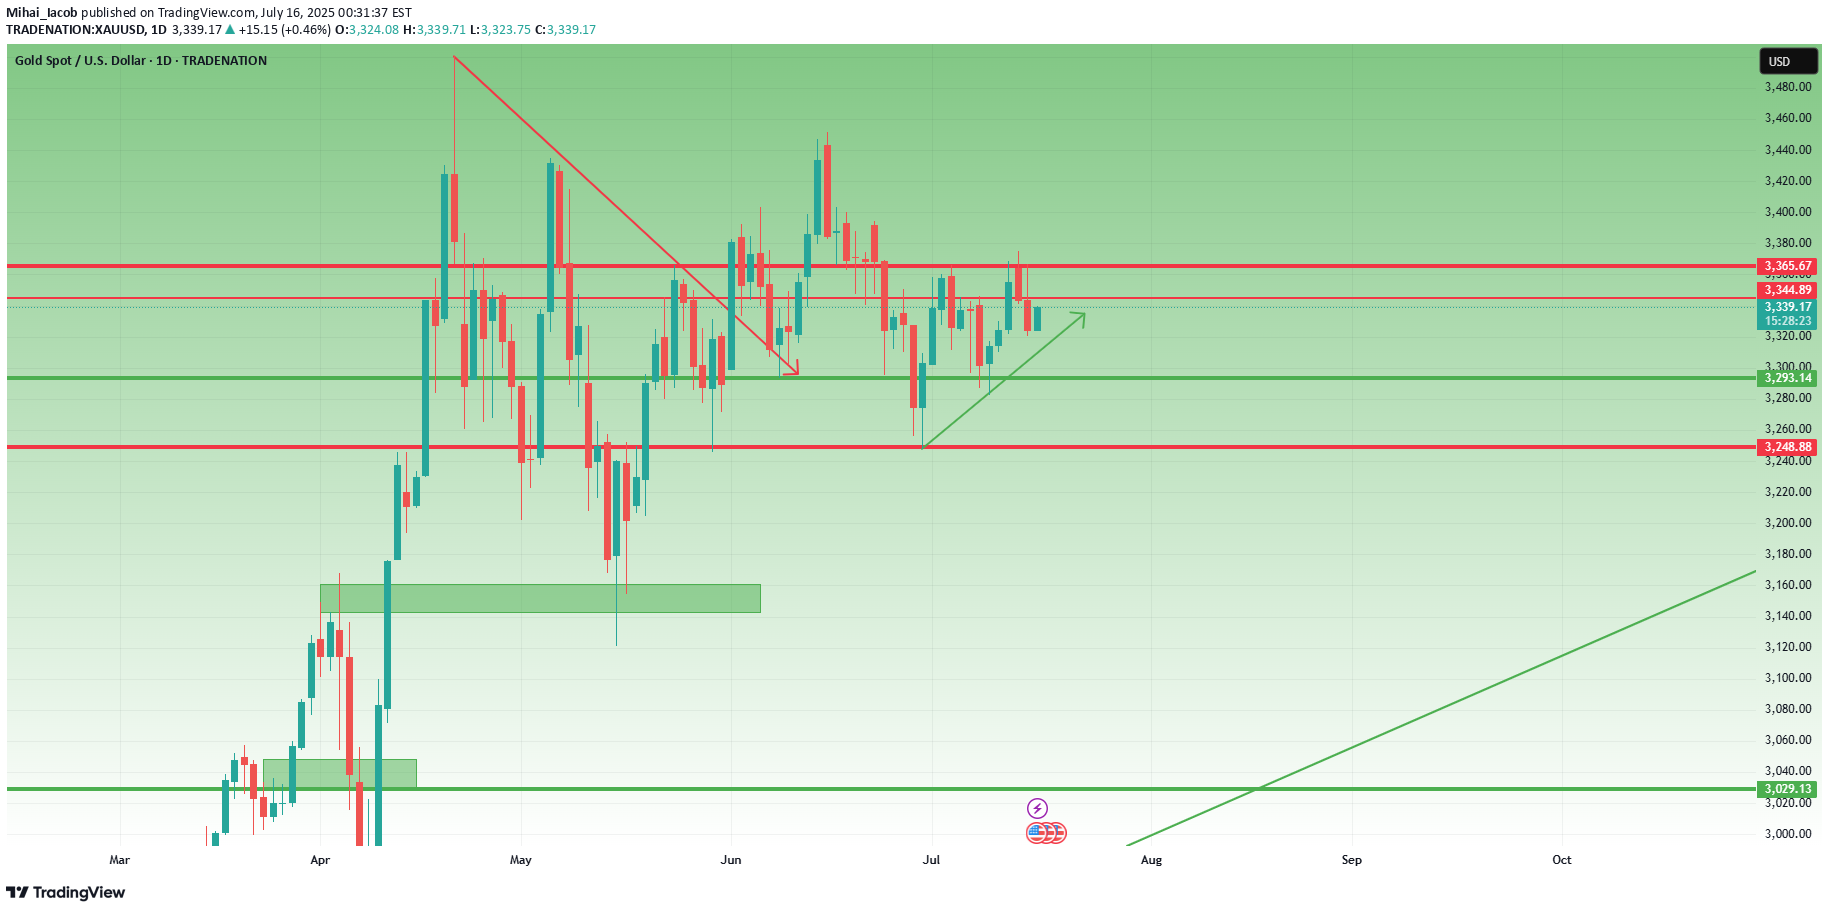
📉 What happened yesterday? As expected, XAUUSD made another leg down, breaking even below my buy zone (3330–3335) and hitting a low at 3320. From there, we’re now seeing a modest rebound, with gold trading around 3333 at the time of writing. 📌 Current position: I'm currently holding a long position. It hovers around break-even – fluctuating between small gains and small losses. Nothing solid yet. ❓ Key question: Was this just a deep pullback within a bullish structure… or the beginning of a deeper trend reversal? 🔍 Why bulls still have a case: •Price prints higher lows – bullish structure technically remains intact •A clean break above 3350 would show short-term strength •A confirmed break above 3375 would activate a bullish ascending triangle → targeting the 3450 zone ⚠️ But here's the concern: •Yesterday’s dip to 3330 happened during the New York session (strong volume) •The bounce from 3320 has been weak, with no follow-through •Daily candle closed near the lows, showing a long upper wick → a classic bearish signal •The confluence support now lies at 3310–3320. A red daily candle closing in this area could mean the medium-term trend is flipping 🎯 My trading plan: Although I'm still holding my buy, if bulls don’t recover 3350 quickly, I will consider closing early. The break of 3310 would shift my bias bearish. ________________________________________ 📌 Conclusion: We’re in a critical zone. The bullish structure isn’t broken yet, but yesterday’s action was not encouraging. If buyers fail to reclaim control soon, the market may be preparing for a deeper correction. Stay sharp. 🚀 Disclosure: I am part of TradeNation's Influencer program and receive a monthly fee for using their TradingView charts in my analyses and educational articles.XauUsd is trading at the top of the range. break?
