Technical analysis by WavePoint_FX about Symbol PAXG: Buy recommendation (7/16/2025)

WavePoint_FX
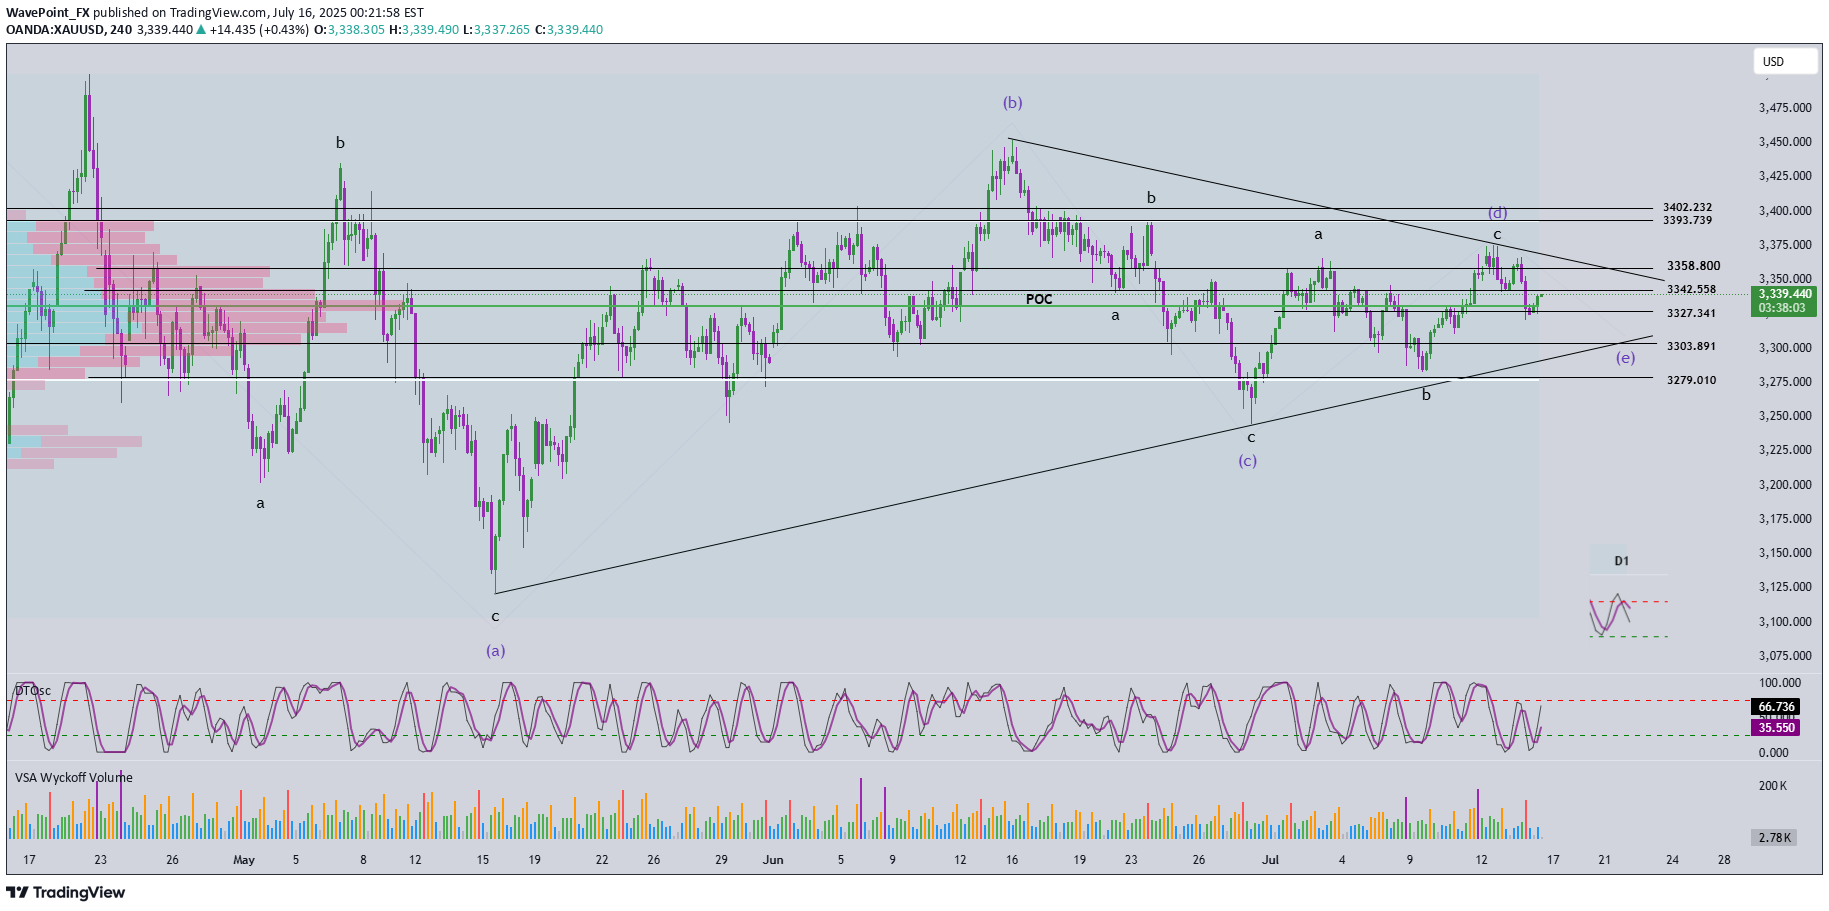
🔄 Momentum Analysis D1 timeframe: Momentum is currently reversing to the downside, suggesting that the price may continue to decline or move sideways in the short term. H4 timeframe: Momentum is rising, indicating that the current recovery may continue. The next resistance zones to watch are 3342 and 3358. 🌀 Elliott Wave Structure At present, price action is being compressed within a contracting triangle corrective pattern, with its range narrowing further—signaling market consolidation. We should closely monitor for signs of a breakout that could end this correction. Based on the current wave structure, it is expected that wave d (green) has completed, and the current downward move is likely part of wave e (green). The trading strategy focuses on waiting for the price to approach the lower boundary of the triangle—drawn from the low of wave a to the low of wave c—looking for confluent support areas near this trendline to identify a potential BUY opportunity. 🎯 Target & Trade Plan BUY ZONE: 3303 – 3300 Stop Loss (SL): 3290 Take Profits (TP): - TP1: 3327 - TP2: 3358 - TP3: 3402📉 XAUUSD Market Update Looking at the H4 timeframe, price has rejected from the 3342 resistance zone and has been declining since then. H4 momentum has also reversed to the downside, indicating that the bearish trend remains dominant. In terms of wave structure, a WXY corrective pattern is forming within a descending price channel. At this stage, we are waiting for wave Y to complete before reassessing the next trading opportunity. Price action continues to follow our original trading plan.
