Technical analysis by dRends35 about Symbol BTC: Buy recommendation (7/15/2025)

dRends35
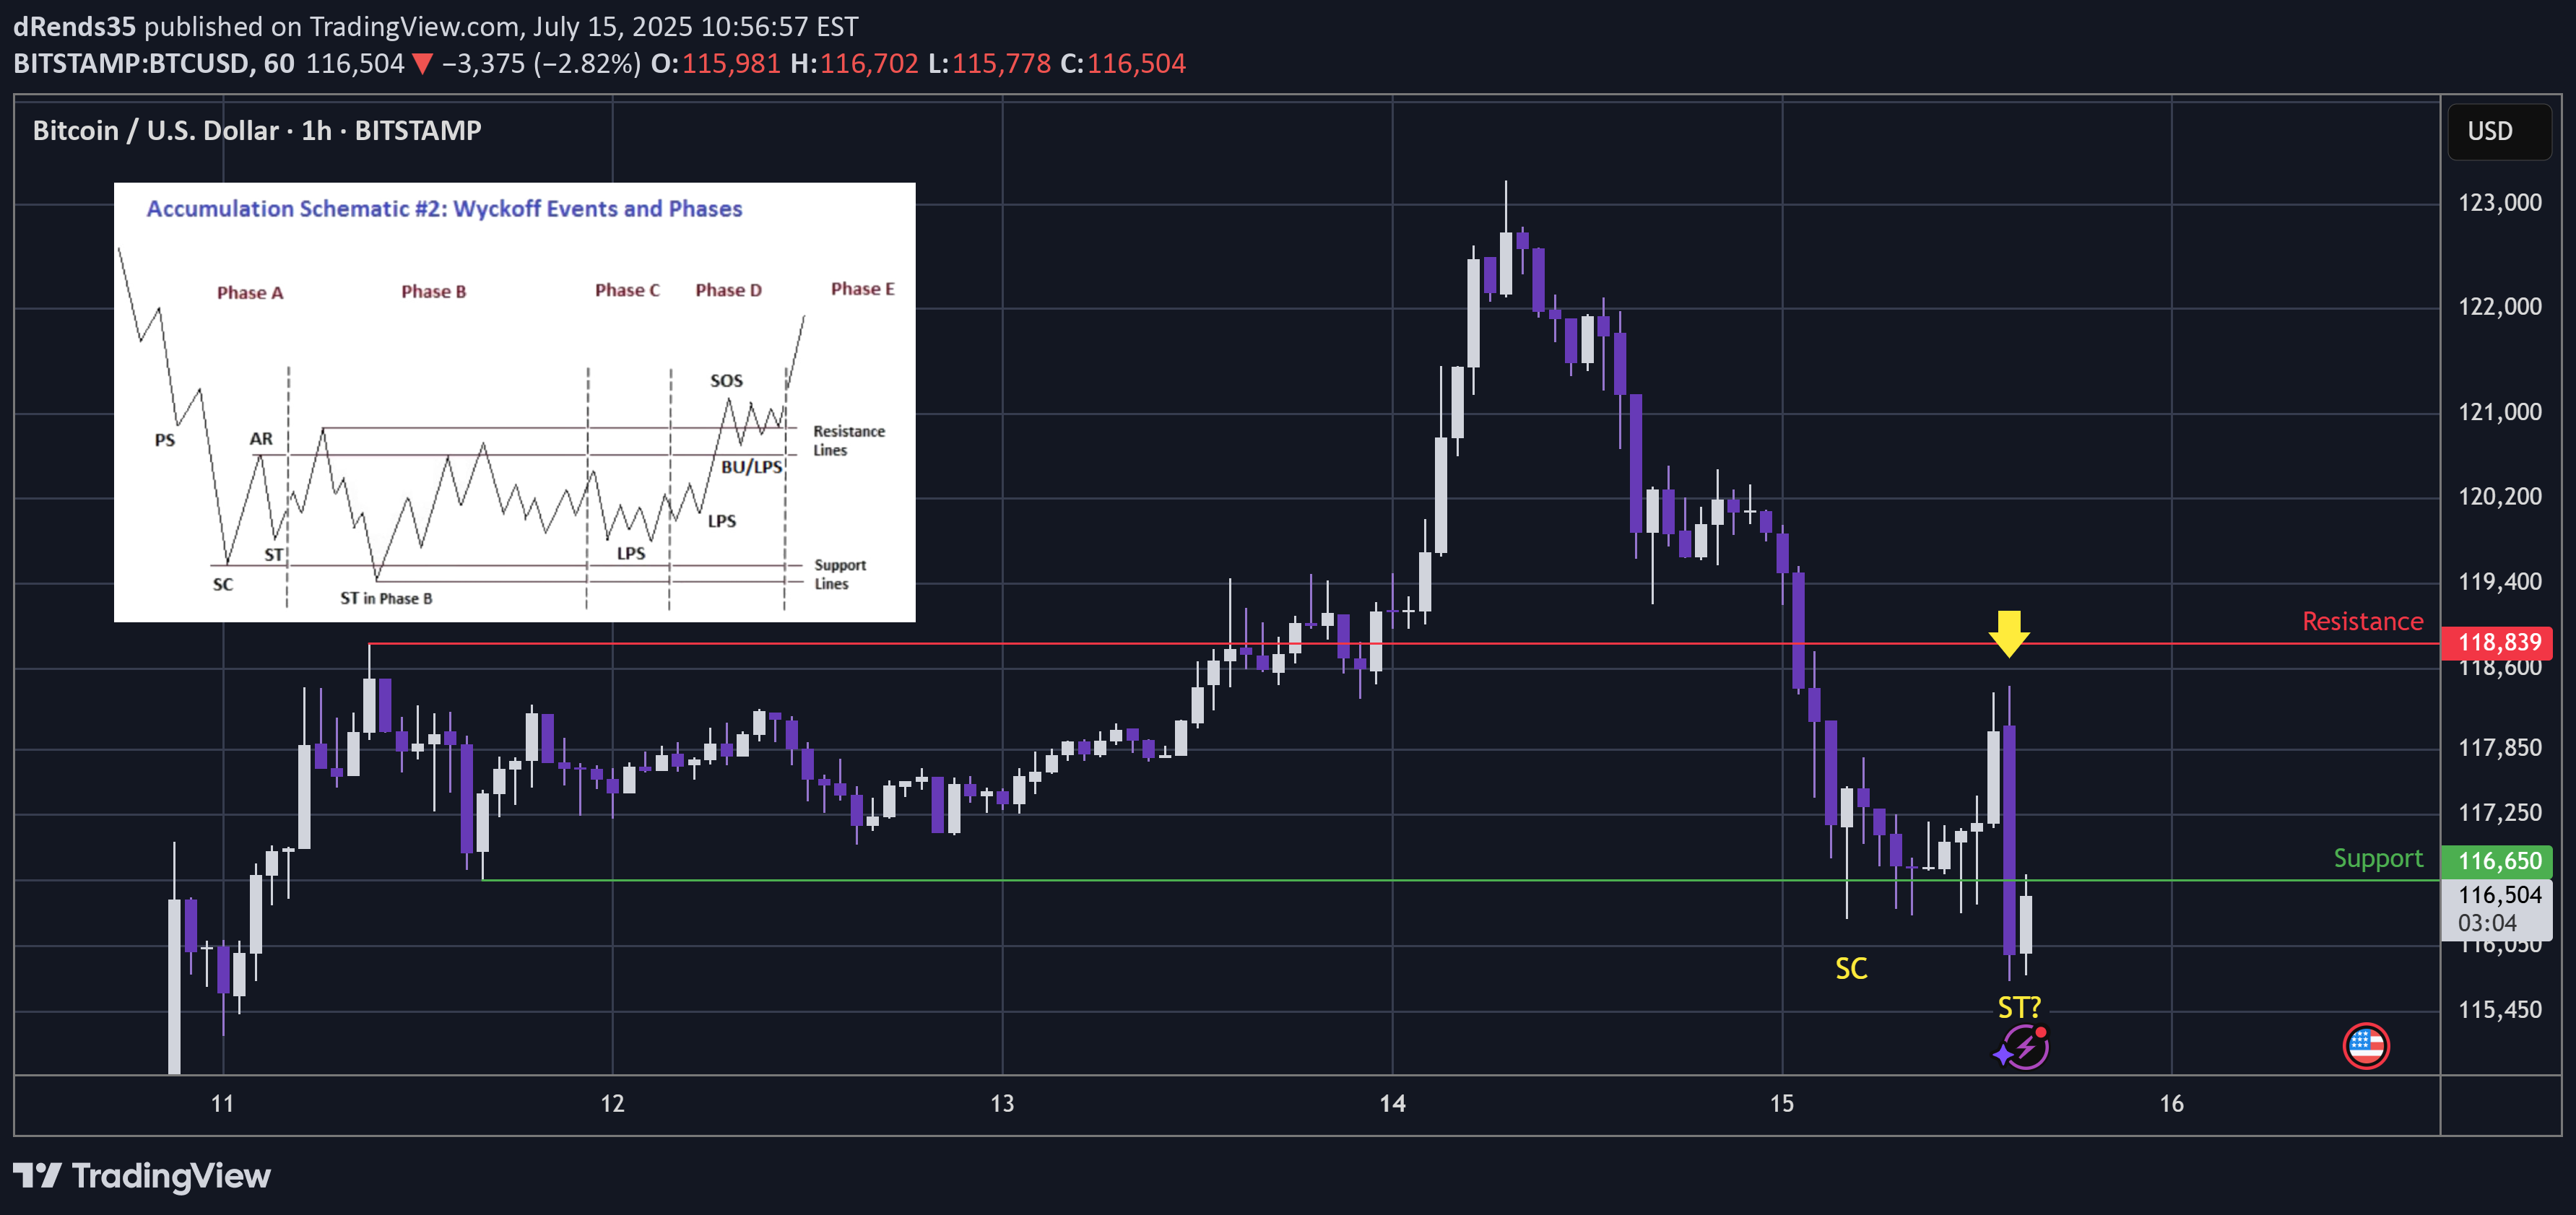
Whenever there is a big impulsive rally, dumb money will come rushing in to buy. And thus we can somewhat expect the market maker to print a shakeout for them to exit at best price and dumb money to carry the bags at worst price. ... In this area we have multiple charts providing the liquidity zones for the shakeouts: The upside shakeout (long wick) printed on TOTAL through ATH: ... Before I make the next point, lets see the design of the chart bots 10 years ago in 2015. Notice that the high and low of the trading range is set by the impulsive high then initial slump: That sets the trading range. Once set; the chart bots then print a liquidity sweeping slightly higher high... Which slumps back to liquidity sweep the lows of the trading range. From there the next wave up begins. ... Now notice in these charts from the last 2 days, that the trading range was similar to that of 2015. But once the range was set; rather than printing a simple slightly higher high, the more evolved chart bots printed a wild impulsive move up to draw in buyers. This then became a very impulsive smackdown. ... Although going on a wild journey, the price is effectively similar to the pattern of 2015; liquidity sweep at the highs and now it is below the low. Notice on these 2 charts from the last two days that the support that Bitcoin has hit today was the obvious trading range low - similar to 2015. And so the question is now; whether it will also be a liquidity sweep at the lows and a bounce will follow? Notice on the chart, there was a big smackdown and then we have had another fast smackdown (arrow) to take price beneath the lows. This looks very much like a fear test - where the chart bots try to sell you another immediate capitulation, but yet the price holds in the zone of higher liquidity below support. Wyckoff would call these 2 lows SC Selling CLimax and ST Secondary Test. The selling climax completes the real bearish wave down. Secondary Test is the probe into higher liquidity which is a fear test to scare longs away. ... So if we consider that history may not repeat, but it does rhyme then there will likely be a bounce in this area - as the market maker gets best price for their short positions while dumb money panic sell their long positions at a loss. Not advice
