Technical analysis by RSI_Trading_point about Symbol PAXG on 7/15/2025

RSI_Trading_point
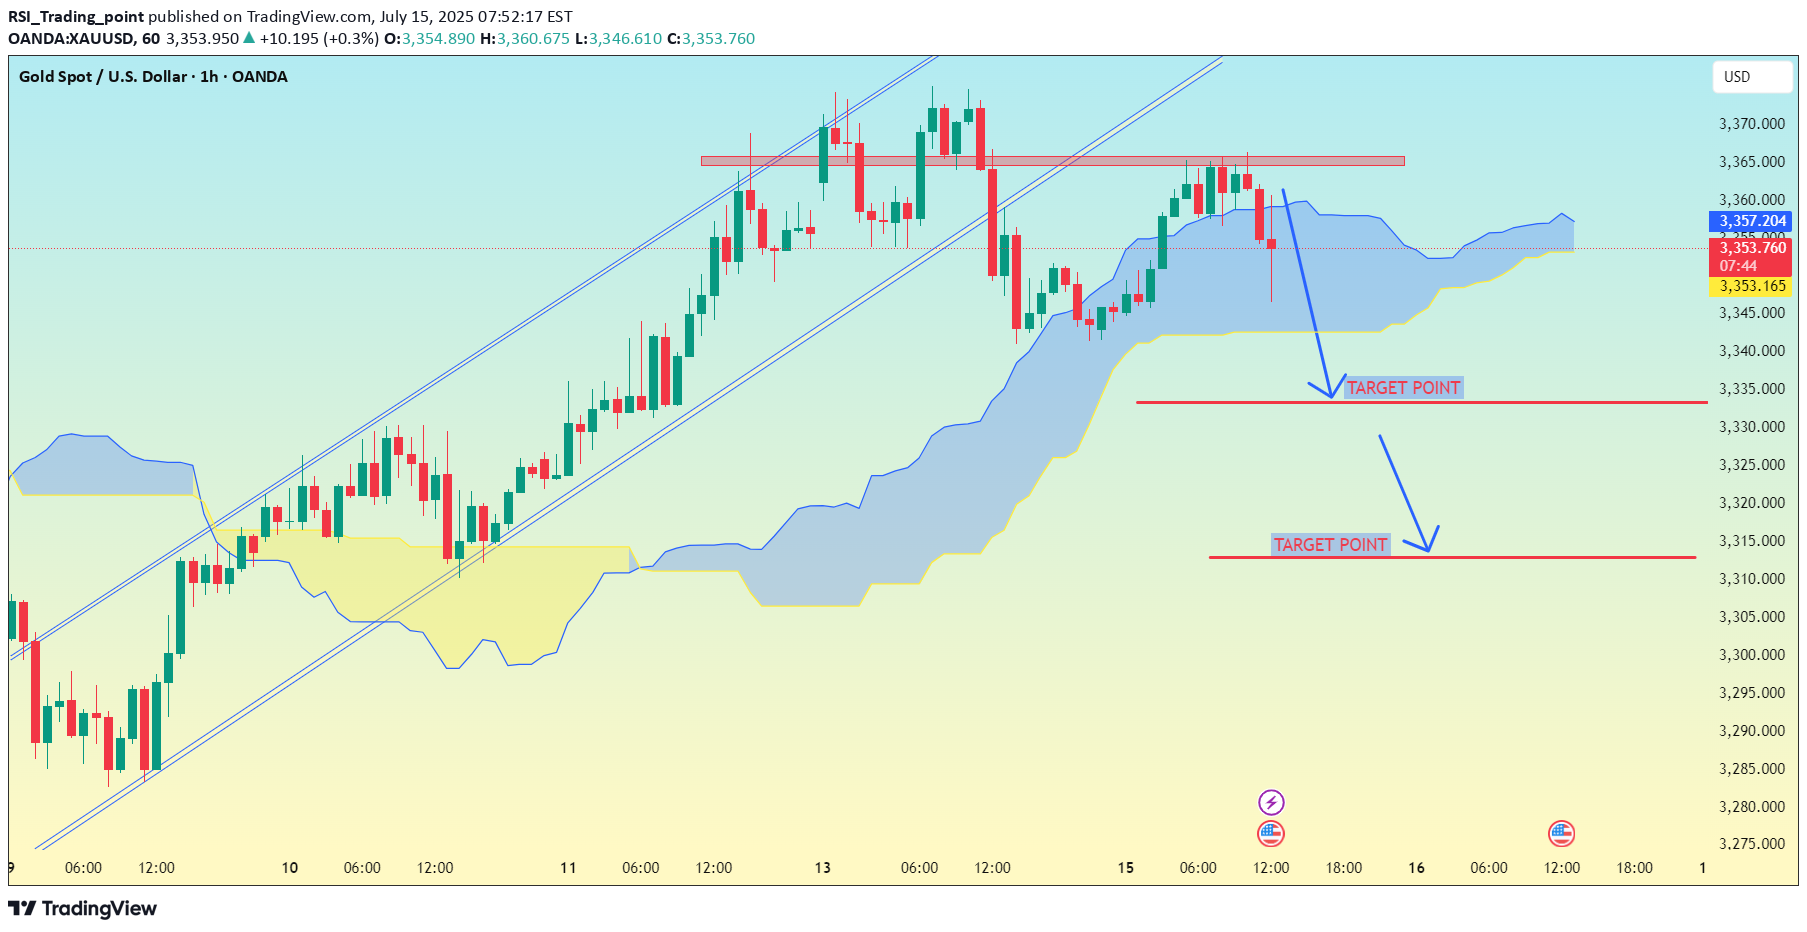
XAU/USD (Gold vs USD) on the 1-hour timeframe, the setup clearly shows a bearish breakdown from an ascending channel, supported by Ichimoku Cloud analysis. --- 📉 Target Points (as marked on your chart): 1. First Target Point: Around $2,335 2. Second Target Point: Around $2,312 --- 🔍 Analysis Breakdown: Price has broken below the Ichimoku cloud – a bearish signal. The ascending channel is broken to the downside. Support zones and target levels are clearly marked: The first target aligns with a previous support level. The second target is a deeper support area, likely the base of the previous strong rally. --- 📌 Summary: 🥇 First Target: $2,335 🥈 Second Target: $2,312 📉 Bias: Bearish (continuation likely if momentum holds and no strong reversal signs appear) Let me know if you want suggested stop-loss, entry confirmation ideas, or risk management tips.active
