Technical analysis by SupertradeOfficial about Symbol XLM: Sell recommendation (7/15/2025)

SupertradeOfficial
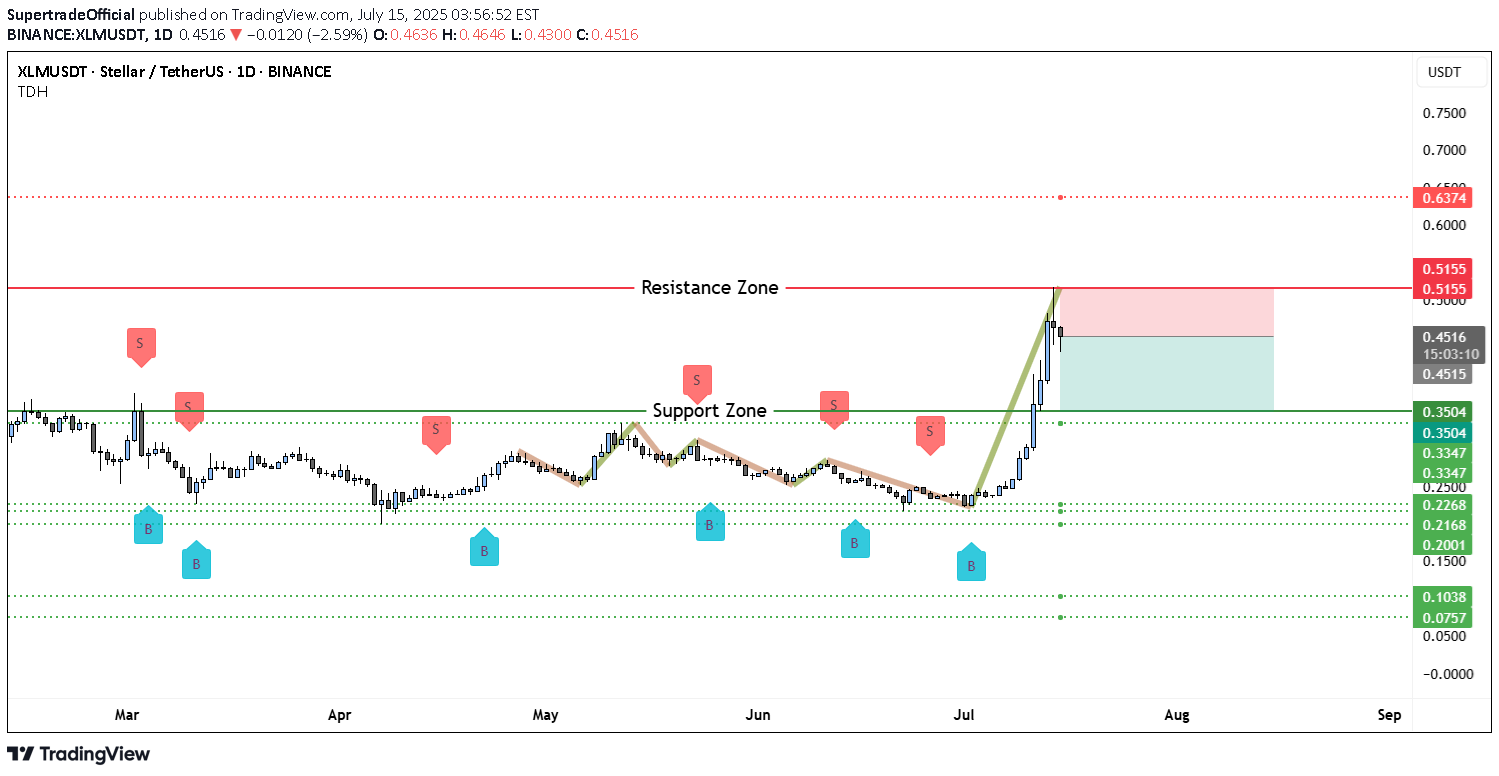
On the daily chart of XLM/USDT, price has made a steep, parabolic rise, pushing directly into a well-established resistance zone around $0.5155. This level has historically capped price moves, evident from several prior swing highs clustering near this area. The rally itself unfolded rapidly, without significant consolidation, leaving a series of untested supports in its wake. This combination—a near-vertical climb into resistance—often signals buyer exhaustion. Indeed, the rejection candle formed right at the $0.5155 ceiling, which strengthens the bearish argument. Below the current price action, there is a broad support zone between $0.3347 and $0.3504. This area previously acted as resistance earlier in the year and is likely to attract some buying interest if price pulls back decisively. Beneath it lie deeper supports around $0.2500, $0.2268, and $0.2000—levels that remain untested during this move up. While the chart does not display volume bars, the sheer steepness of the final leg suggests momentum was likely unsustainable. Often, such aggressive spikes without healthy consolidation result in a retracement of 30–50% or more. One critical factor to watch is whether price manages to reclaim and hold above $0.5155. Failure to do so implies that sellers remain in control, raising the probability of a broader pullback toward the mid-$0.30s or lower. ________________________________________ 📉 Why This Setup Leans Bearish This chart structure supports a bearish thesis because: •Price is reacting strongly to historical resistance. •The rally was parabolic, making it prone to sharp corrections. •There is no clear consolidation base above the breakout point. •Several untested support levels remain below current price, which the market may revisit. If this move is indeed an exhaustion spike, the next phase is typically a retest of the last major consolidation area around $0.3504–$0.3347. ________________________________________ 📊 Potential Bearish Trading Setup Here is a structured trading idea to consider: Short Entry Zone: •Retest of the $0.5155–$0.5200 resistance area. •Look for confirmation by way of bearish candlestick patterns (shooting star, bearish engulfing, or consecutive rejection wicks). Stop Loss: •Conservative stop above $0.6374 to allow for volatility. •Alternatively, a tighter stop just above $0.5200 if using smaller size. Targets: •First target: $0.3504 (major support). •Second target: $0.2500. •Third target: $0.2000–$0.2268 (deeper retracement zone).
