Technical analysis by cryptodailyuk about Symbol BTC on 7/14/2025

cryptodailyuk
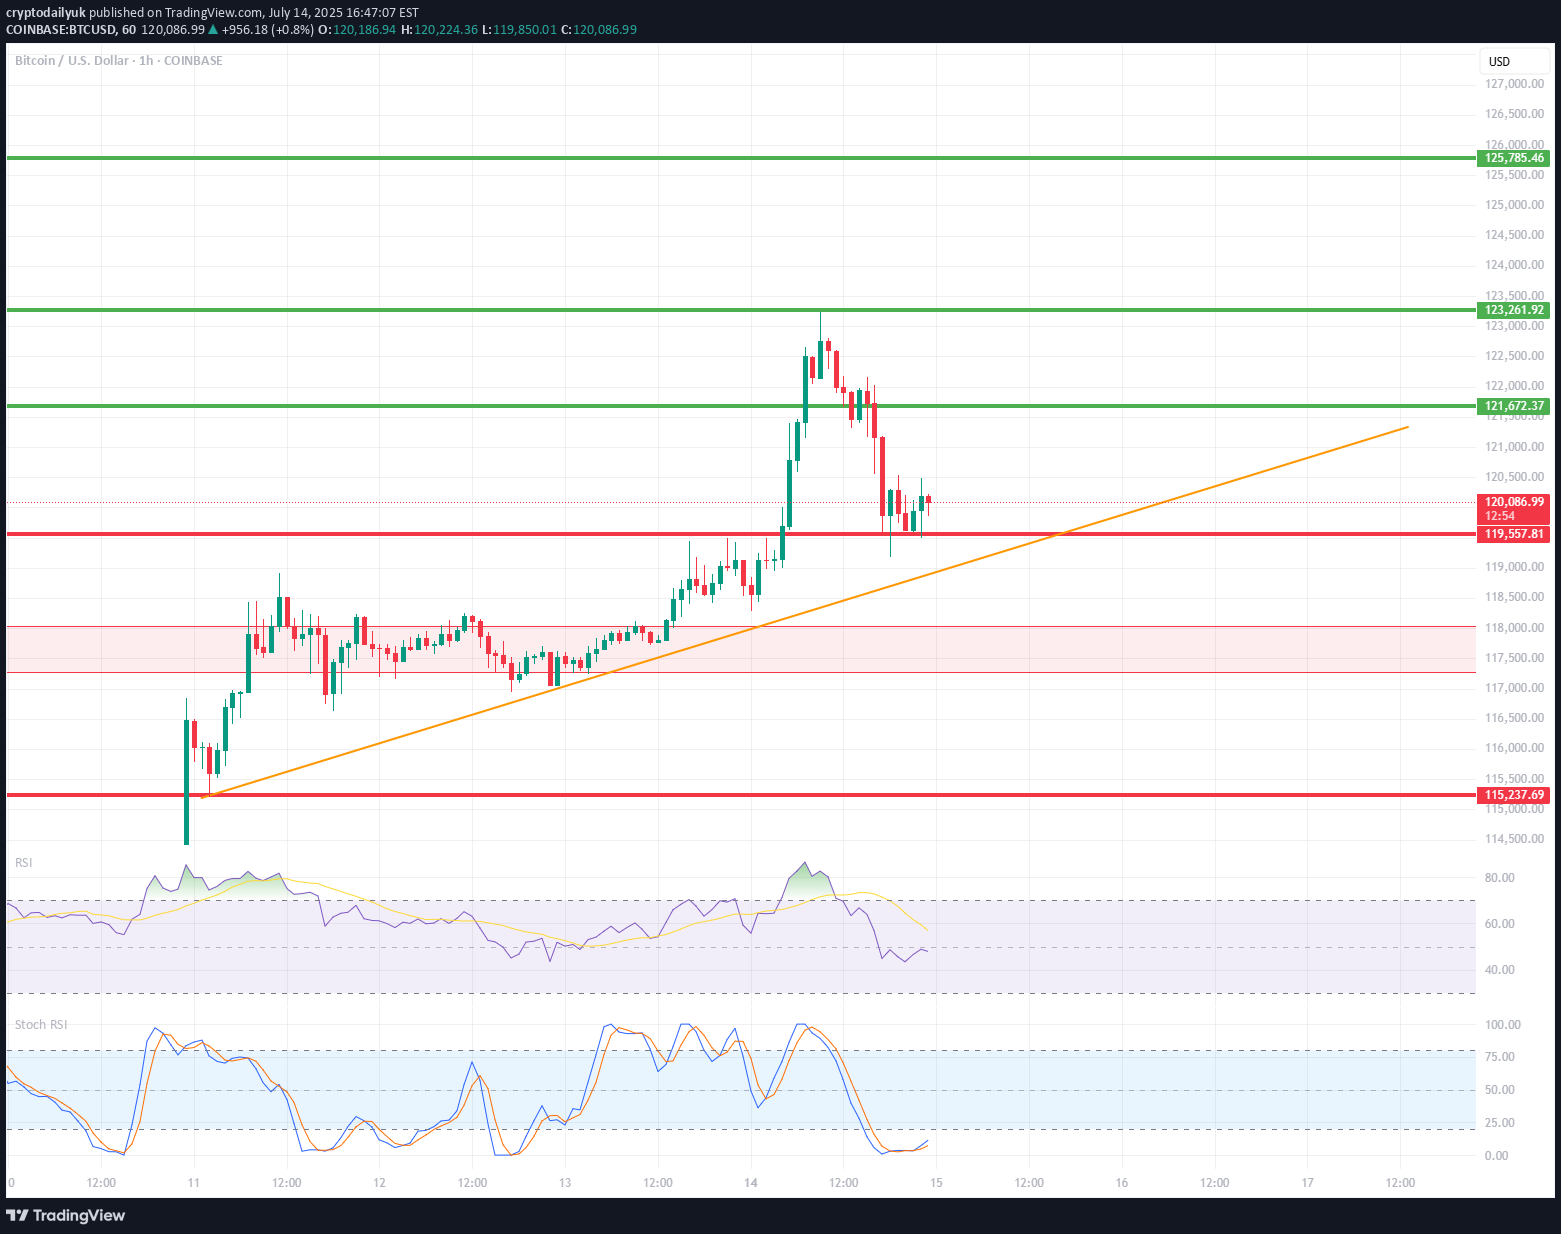
🔍 Trend: The short-term uptrend remains in effect, supported by the orange trendline. The price has tested dynamic support but has not yet broken it. 🟥 Supports (Important Levels): 🔻 1. 119.550 Key support. The price is currently testing it. Holding = potential upside rebound. Breaking = greater downside risk. 🔻 2. 117.260–118.040 USD Clear demand zone (reinforced by prior consolidation). If the price breaks below current support, this is the next logical stopping point. 🔻 3. 115.237–115.500 USD Strong weekly support – very important in the event of a stronger correction. Historically, it has responded many times. 🟩 Resistance: 🔼 1. USD 121.673 The nearest local resistance – this could pose a problem for further growth. 🔼 2. USD 123.961 The last local high. Breaking it confirms the continuation of the uptrend. 🔼 3. USD 125.785 The next resistance – a potential target after a breakout to the upside. 📈 Technical Indicators: RSI (classic): Still below 50, but starting to reverse slightly upward – neutral with a slight potential for a rebound. Stochastic RSI: Gives a long signal – the lines have crossed in the oversold zone and are pointing upward. 📊 Scenarios: 🟢 Bullish: Maintaining the current support zone (119.5–120k). Breakout above 121.673 → target: 123.961. Breakout of 123.961 = trend confirmation and target: 125.8k+ 🔴 Bearish: Break of the trend line and support at 119.550 → possible quick decline to 117.2k–118k. If this doesn't hold, target: 115.2k ✅ Summary: Decisive moment – tested trend line + support = rebound or breakout point. The Stochastic RSI indicates a potential upside breakout, but the RSI needs confirmation. Careful monitoring of volume and reaction to 120k in the coming hours.
