Technical analysis by GoldFxMinds about Symbol PAXG on 7/13/2025

GoldFxMinds
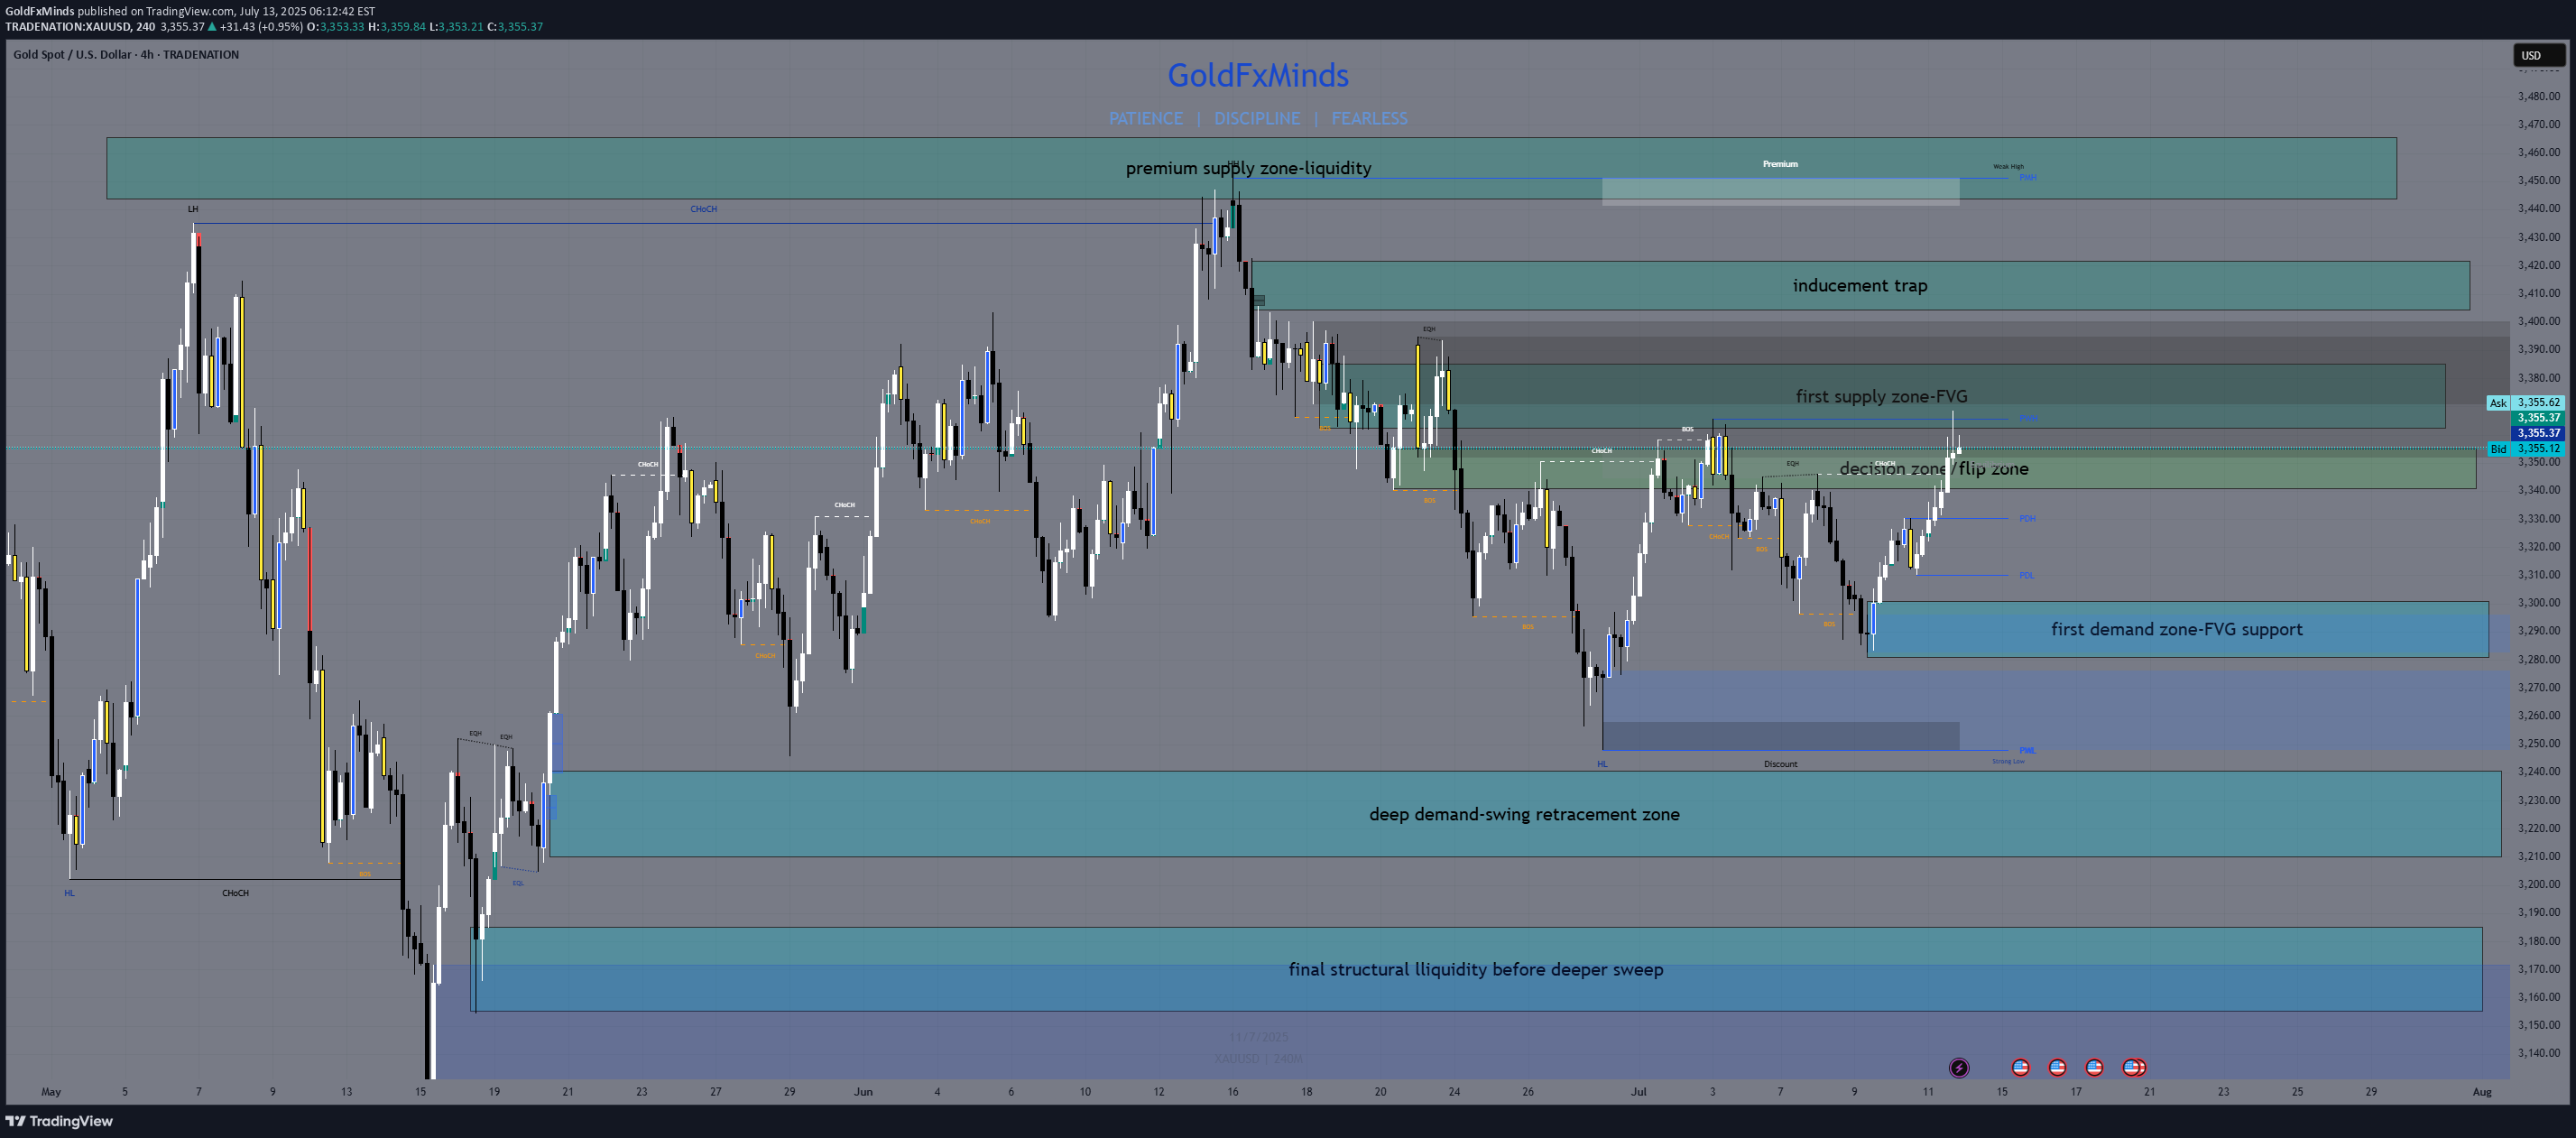
After a sharp early-week move, gold is now pressing into H4 supply with clean CHoCHs and clear inducement in play. With CPI data and multiple FOMC speakers on deck, volatility is rising — and so are the opportunities. Let’s break down the current structure. 🔸 H4 Market Bias Bias: Bearish unless we close firmly above 3420 Structure: Internal bearish flow remains → HL formed at 3210 → CHoCH → current move likely inducement Context: Price has filled key FVGs and is testing unmitigated OBs in premium, with RSI approaching exhaustion 🔼 Zones Above Current Price: 3445–3465: This is the weak high and final layer of buy-side liquidity. It includes an unfilled FVG and marks the upper limit of the premium range. If price reaches this zone, it’s likely to act as a trap before a deeper rejection. 3405–3420: A clean imbalance zone left after the initial CHoCH push. It has already shown rejection once and is now positioned as the key area where a lower high could form. If price reacts here, it confirms continuation to the downside. 3360–3385: This is the core supply OB, created from the CHoCH. It also aligns with the premium boundary and EMA21 resistance. Current price is already reacting here. Rejection confirms the bearish bias. 🔽 Zones Below Current Price: 3340–3355: A minor wick-fill zone from past reactions. It may provide a small pause, but it’s structurally weak and more likely to break on momentum. Not a major support. 3300–3280: This is the key intraday demand zone. It’s built from a previous BOS and sits at the 50% retracement of the last bullish leg. If this zone breaks, we open up deeper downside potential. 3240–3210: The strongest demand OB on the chart. This is the HL origin and the 61.8% fib zone. If gold reaches here, expect a major decision: bounce or break. 3185–3160: The final liquidity base under the higher low. If price sweeps this zone, it signals a major shift — potentially invalidating the June rally structure. 📊 Indicators & Flow Notes: EMAs (5/21): Crossed bullishly, but testing overextension at 3360 RSI: Leaning overbought → potential for rejection at current zone Volume: Bearish pressure expected if price fails to close above 3385 Fibonacci (last bullish leg): 50% sits at 3285; 61.8% near 3250 🧠 Trade Scenarios: 🔸 Bearish Setup (preferred): → Reject inside 3405–3420 → form LH under 3420 → clean drop toward 3300 → Ideal confirmation = rejection wick or bearish engulfing on M30–H1 🔸 Bullish Breakout (less likely): → Break and hold above 3420 = potential squeeze into 3445–3465 → Must be supported by CPI upside miss or dovish FOMC tone → But 3445–3465 remains weak liquidity — not a safe continuation zone I appreciate every 🚀, comment, and follow I see on my plans. If this breakdown helped sharpen your outlook, let me know below. I post real levels with precision — no hype, just clean structure. Keep following for daily sniper plans built from logic, not noise. 💼⚔️ --GoldFxMinds-- Chart and structure based on Trade Nation broker feed on TradingView. For educational purposes only — not financial advice.
