Technical analysis by vf_investment about Symbol BNB: Buy recommendation (7/11/2025)

vf_investment
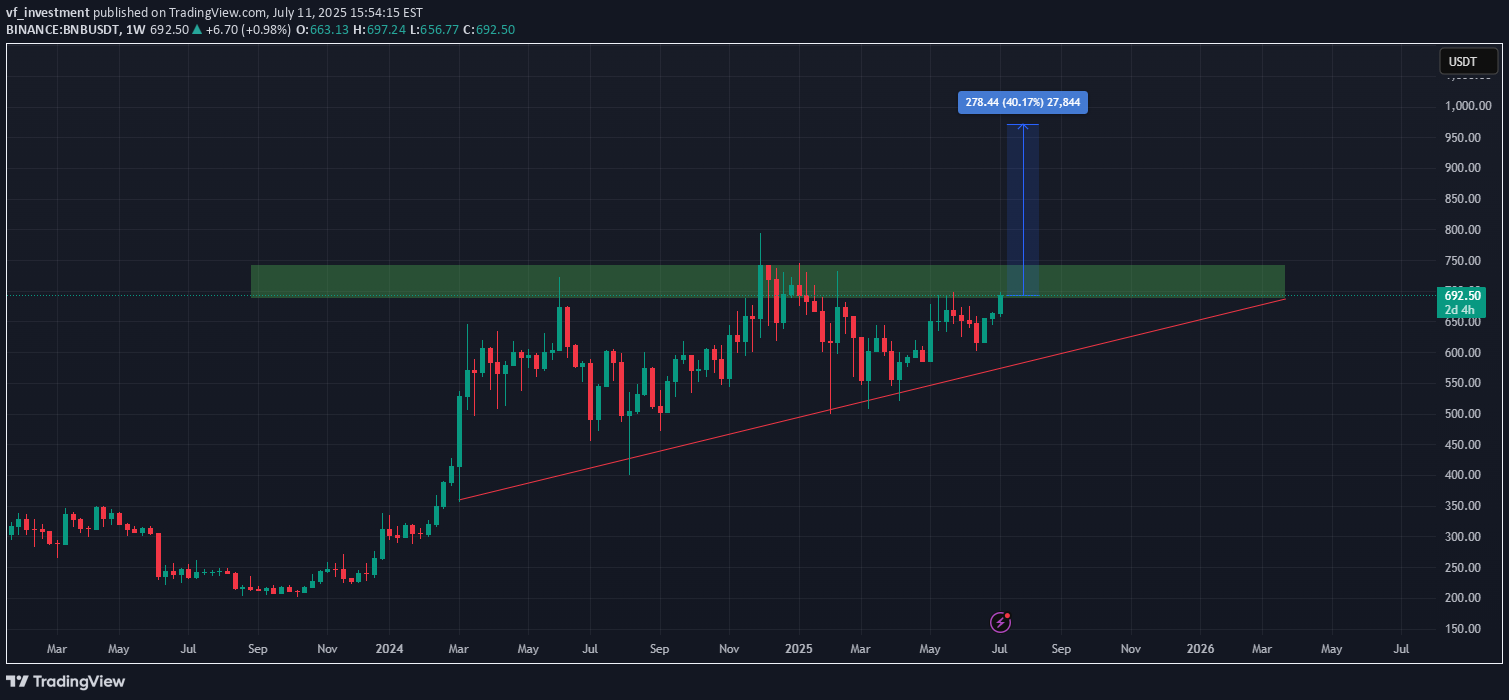
hi traders The BNB/USDT chart is displaying a classic ascending triangle pattern, which typically signals a potential bullish breakout. This pattern has formed over the past year, characterized by a series of higher lows (shown by the rising red trendline) while repeatedly testing a strong horizontal resistance zone around $690–$730 (highlighted in green). BNB is currently trading near the upper resistance boundary at $692.85, showing signs of bullish momentum. A successful breakout above the $730 resistance level could confirm the ascending triangle breakout and trigger a strong upside move. Target & Potential Move: Breakout target: ~ $950 - $1,000 Measured move: 40% from the breakout point, aligning with the height of the triangle Summary: Pattern: Ascending Triangle (bullish) Breakout Confirmation Level: $730+ Potential Target: $1,000 If the breakout is confirmed with strong volume and momentum, BNB could rally sharply in the coming weeks. Traders should watch for confirmation before entering.
