Technical analysis by PeakTrades94 about Symbol XLM: Buy recommendation (7/9/2025)

PeakTrades94
XLM - 3 Bullish Targets, Multiple patterns.
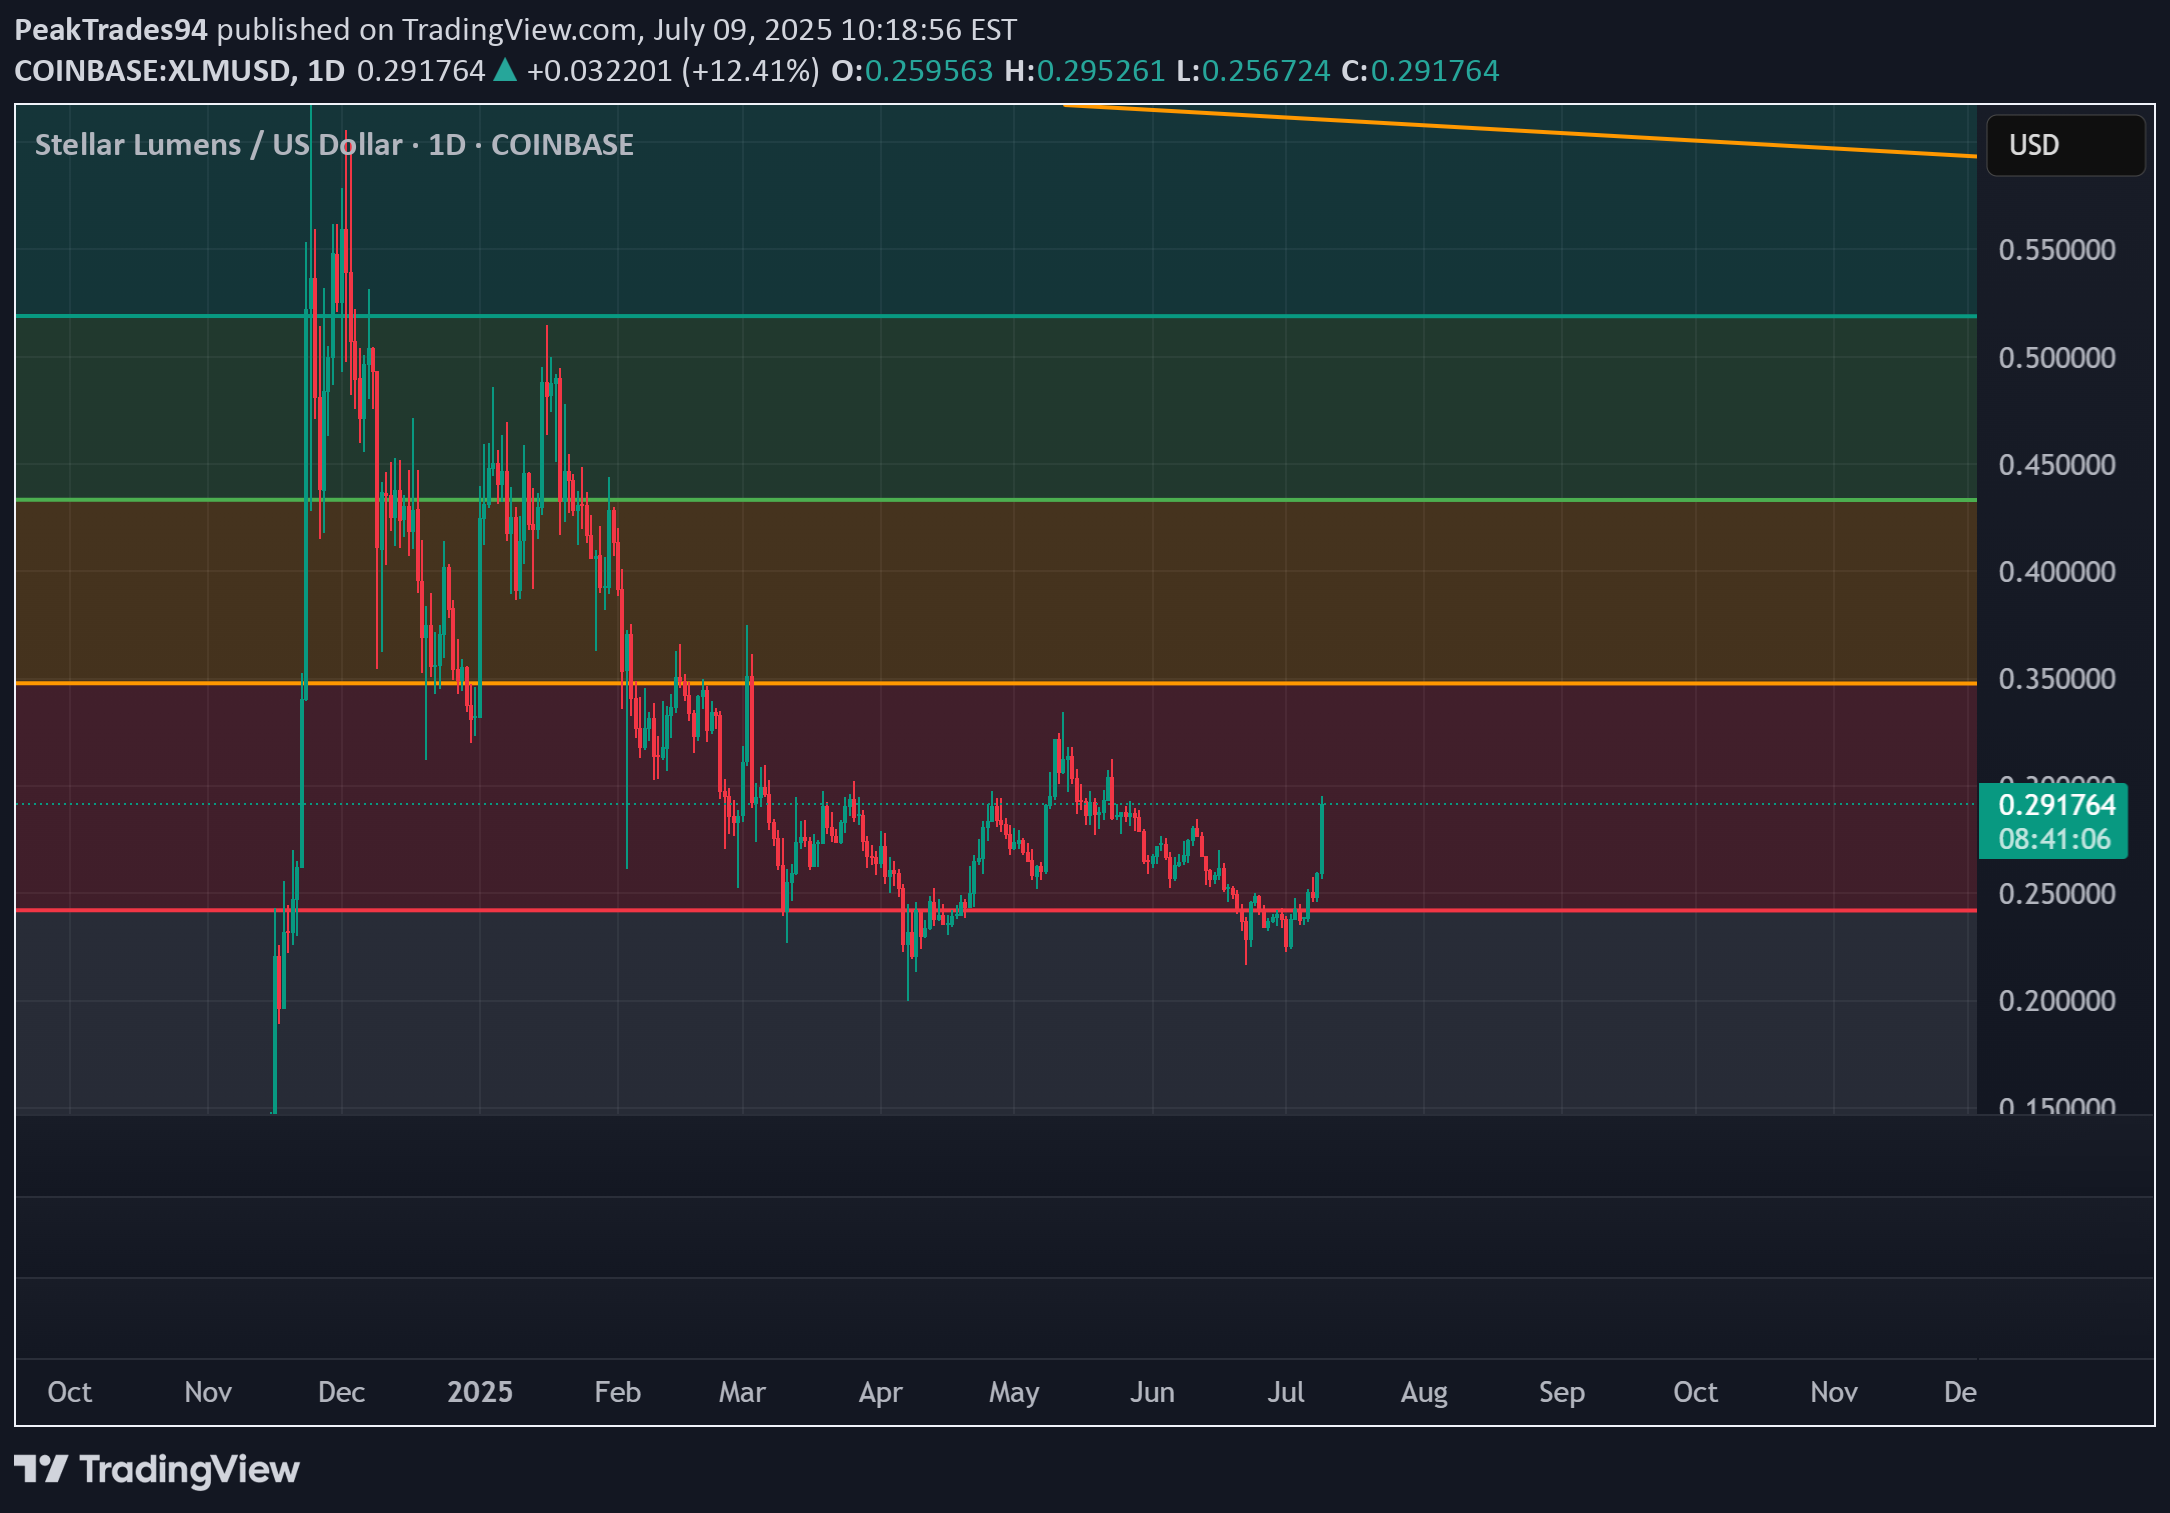
XLM appears to be gearing up for a strong upside move. Several technical signals have aligned recently, and we are now witnessing the early signs of a bullish breakout.I'd like to share this opportunity with you by walking you through my analysis — moving from smaller to higher timeframes:🔹 4H – Double Bottom FormationOn the 4-hour chart, XLM has formed a clear double bottom structure. A successful retest of the neckline has just taken place, strengthening the case for a bullish continuation.🔹 4H – Descending Channel BreakoutWe’ve also seen a breakout from a descending channel, followed by a textbook retest. The initial target from this pattern lies between $0.325 and $0.35 (TP1).Interestingly, this range also aligns with the neckline of a potential double bottom pattern visible on the weekly chart — more on that shortly.🔹 Daily – Falling WedgeZooming out to the daily, XLM is still respecting a long-term falling wedge pattern. Since no new lower low was printed after the wedge was formed, this pattern remains valid.If this wedge breaks out with strength, the potential target lies around $0.56 to $0.60 (TP3) — which also corresponds to a significant resistance zone.🔹 Weekly – Double Bottom StructureOn the weekly timeframe, we can spot a developing double bottom. This structure supports the idea of reaching the previously mentioned $0.35 zone.If XLM breaks above and holds the neckline as support, the next bullish target could be around $0.44 (TP2).🔹 Multi-Year Resistance & Fibonacci RetracementNow this is where things get really interesting. When zooming out further, we can see that XLM is still testing a multi-year resistance zone — similar to multi-year resistance (pennant) XRP recently broke out of.This resistance also lines up with the 0.786 Fib retracement from the previous bull market.A clean breakout from the falling wedge, supported by solid volume, could lead to a strong test of this area — and potentially flip it into support on a macro level.Although it’s difficult to set precise targets beyond that, one potential scenario could be:A breakout above multi-year resistanceA move toward the previous bull run ATHA retest of the 0.786 Fib or the old multi-year resistance as new supportWhile speculative, XLM's rapid 2-week move back in November shows how quickly momentum can build.✅ ConclusionAll in all, the technical structure across multiple timeframes looks extremely bullish, and I expect rising volume to confirm this soon.Let’s reach the summit together!📝 NoteAt the time of writing and drawing, XLM was trading around $0.0265 USDT. Since completing this analysis, price action has already started to accelerate.I'm currently building a portfolio of crypto analyses here on TradingView. Your feedback, tips, or validation are greatly appreciated — especially as I continue developing this skill further!XLM is currently trying to break the neckline of the double bottom structure on the weekly timeframe.I expect it will reach TP1 very soon but keep in mind that it may retest the double bottom structure in the coming weekend or next week before more upward movement will occur.this might be an extra opportunity to fill your XLM bags (not financial advice!)I will keep this trade updated.