Technical analysis by cryptodailyuk about Symbol LINK on 7/9/2025

cryptodailyuk
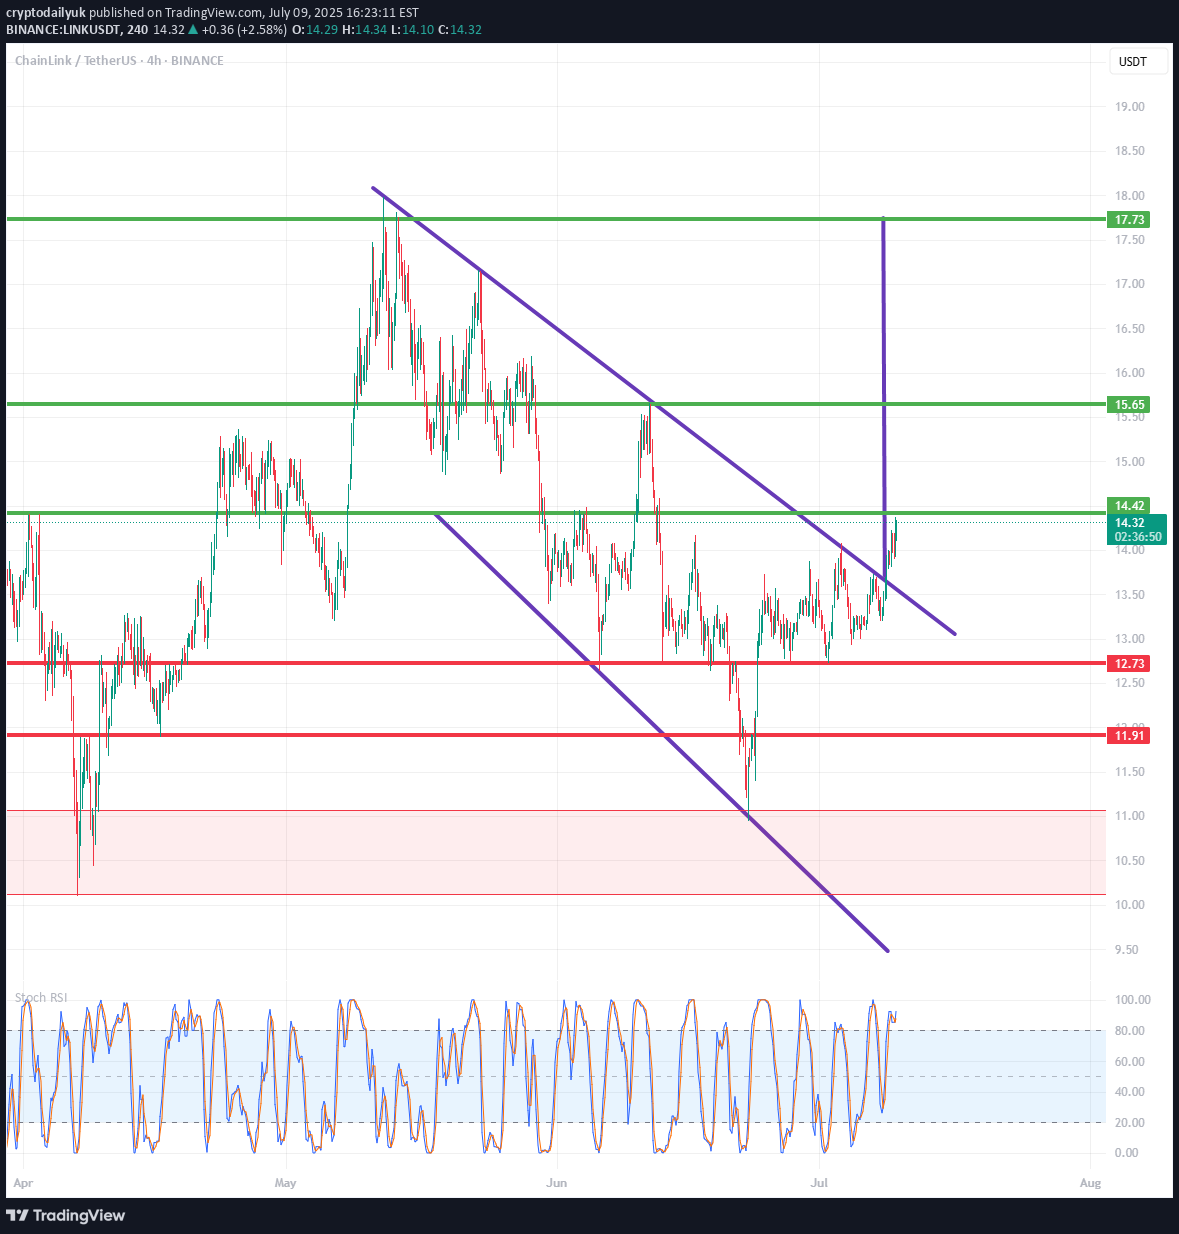
⚡️ Technical situation – quick overview✅ Breakout from the descending channel (purple lines)✅ Resistance zone 14.42 – currently being tested✅ Target within the breakout range – around 17.73 USDT⚠️ Stochastic RSI in the overbought zone – local correction possible🟪 Descending channel – broken!The descending channel that has been in place since mid-May has been broken upwards.Such breakouts often signal a change in the local trend.Theoretical range of movement = channel height (~3.30 USDT) added to the breakout point (around 14.42) = ~17.73 USDT – perfectly aligned with your resistance level.🟢 Key Resistance Levels (green):Level Meaning14.42 USDT Current tested resistance – psychologically significant15.65 USDT Local high + June price gap17.73 USDT Potential target after a breakout – range from the formation🔴 Support Levels (red):Level Meaning12.73 USDT Support from the pre-breakout consolidation11.91 USDT Key defensive level of the uptrend11.07 / 10.12 USDT Historical support with strong demand reactions📉 Stochastic RSI (oscillator):Currently deep in the overbought zone (above 80).This may indicate local exhaustion of momentum and a short correction before further upward movement.However: in strong trends, the RSI may remain high for an extended period – it does not automatically provide a sell signal.📈 Bullish scenario:Retest of the 14.42 level as support → confirmation of the breakoutThen a move towards:15.65 – local stop17.73 – final target from the channel breakout🟩 Stop-loss: e.g., below 12.73 USDT (loss of key support)📉 Bearish scenario:False breakout and decline below 14.42Loss of the 12.73 level → possible quick decline to 11.91–11.07🔴 In this case, a new swing low could open the way to 10.12 USDT.📌 Summary:Element RatingTechnical Pattern ✅ Breakout from a descending channel (bullish signal)Current Level ❗ Test of Key Resistance – Decision PointRSI (Momentum) ⚠️ Overbought – Correction PossibleUpside Potential (Target) 📈 17.73 USDTThreat ❌ False breakout and return to below 12.73 USDT🧠 My suggestion (not investment advice):Observe the price reaction at 14.42 – if it holds above and consolidation forms → a signal to continue.If the 4H/1D candle closes below, consider caution, as this could be a bull trap.
