Technical analysis by GKTrademanthan about Symbol ETH on 7/9/2025

GKTrademanthan
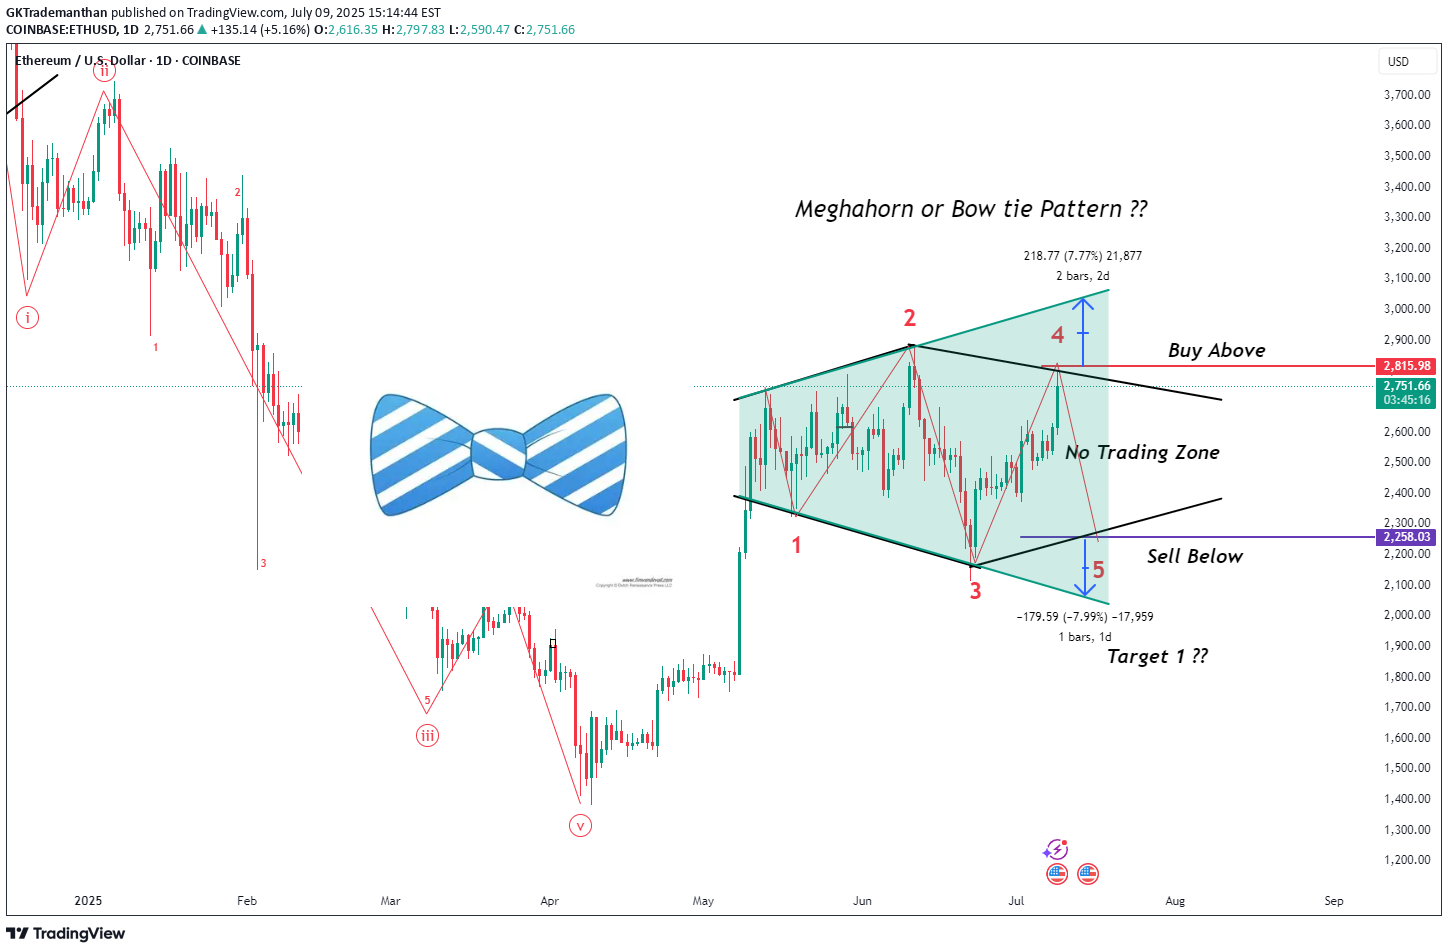
Key Observations:Pattern Formation:A broadening wedge or megaphone pattern (also likened to a bow tie) is forming.Price is oscillating between expanding trend lines.Labeled waves: 1, 2, 3, 4, 5 within the pattern.Critical Zones:Buy Above: $2,815.98 (upper boundary of the wedge).Sell Below: $2,258.03 (lower boundary of the wedge).No Trading Zone: Between $2,258 – $2,815 (uncertainty/consolidation area).Price Target:If price breaks below, Target 1 is indicated around $1,800 or below (implied from structure).Current Price:Trading at $2,748.56, up +5.05%, within the “No Trading Zone”.Summary:The chart suggests waiting for a breakout or breakdown from the wedge pattern to determine the next move. A breakout above $2,815 could signal a buy opportunity, while a breakdown below $2,258 could trigger a sell with a potential target near $1,800.Ask ChatGPT
