Technical analysis by Quant_Trading_Pro about Symbol NEAR on 7/8/2025
Quant_Trading_Pro
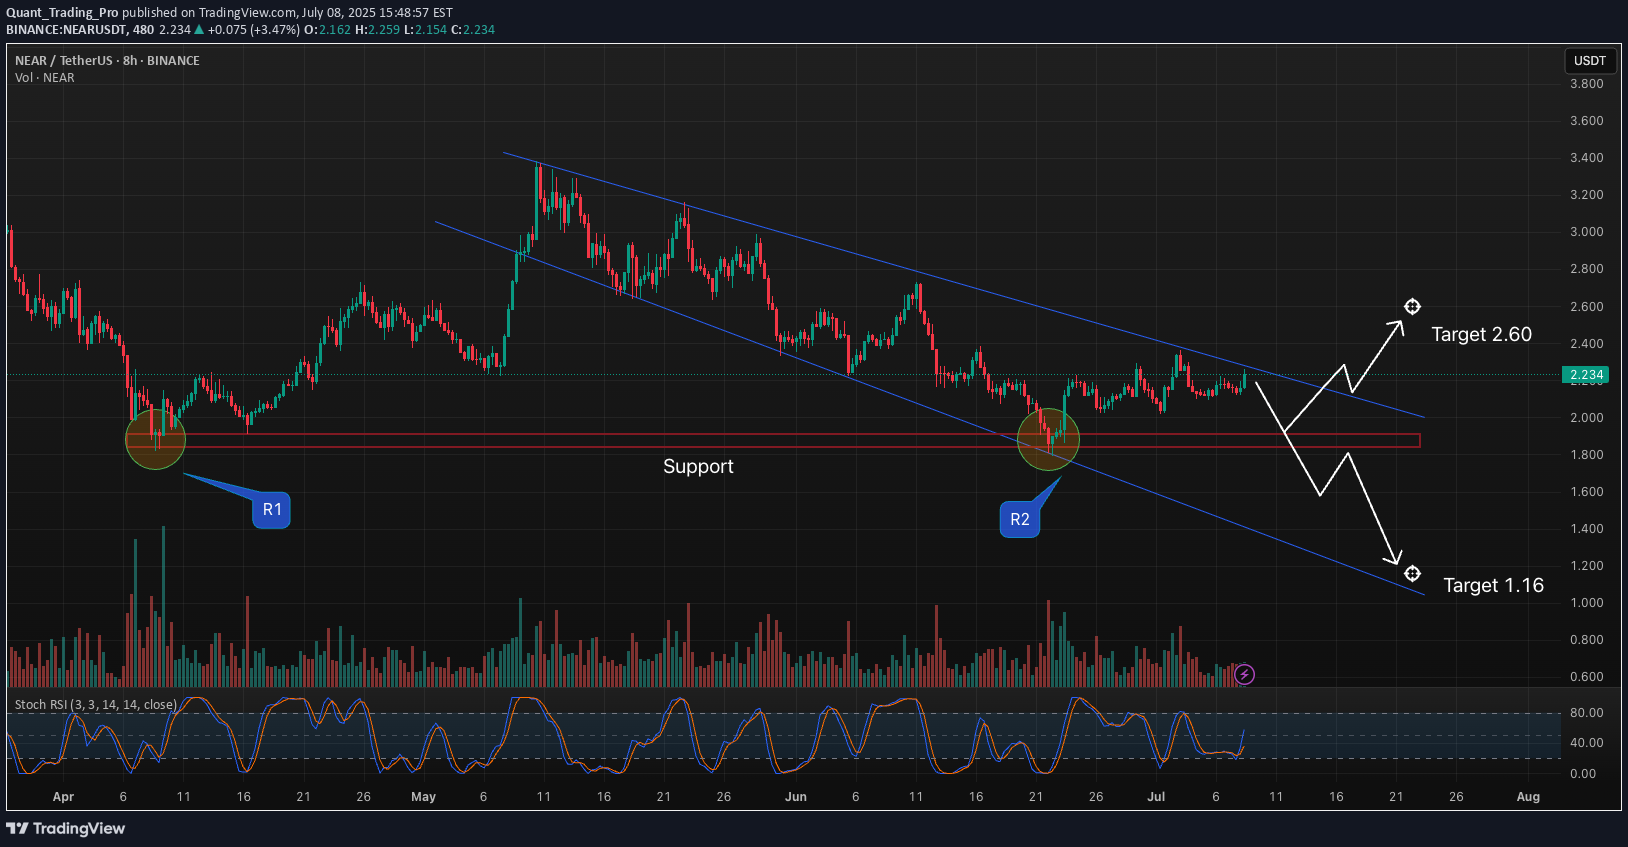
🔍 Chart Overview:NEAR has been trading inside a well-defined falling channel since mid-May. Price has consistently respected both the upper and lower trendlines, confirming this as a dominant structure.🔵 Key Zones:Support Zone (~$1.85–$1.95): Multiple bounce reactions (R1 in April & R2 in June) confirm this zone as a strong demand area.Current Price Action: Price recently bounced off support and is now pressing against the upper channel boundary (~$2.25). A breakout here could be the first bullish signal in months.📌 Indicators:Stoch RSI: Curling upward, currently at 57.18 – suggesting bullish momentum is building.Volume: Slight uptick in volume on the latest push – worth watching for confirmation.🧠 Strategy Notes:Bullish Scenario: Break and close above the descending resistance could lead to a run toward $2.60–$2.90 range.Bearish Scenario: Rejection here would keep the downtrend intact, with price likely retesting the support zone again.🛠️ Pattern in Play:Descending ChannelDouble Bottom Potential @ Support Zone
