Technical analysis by cryptodailyuk about Symbol BTC on 7/6/2025

cryptodailyuk
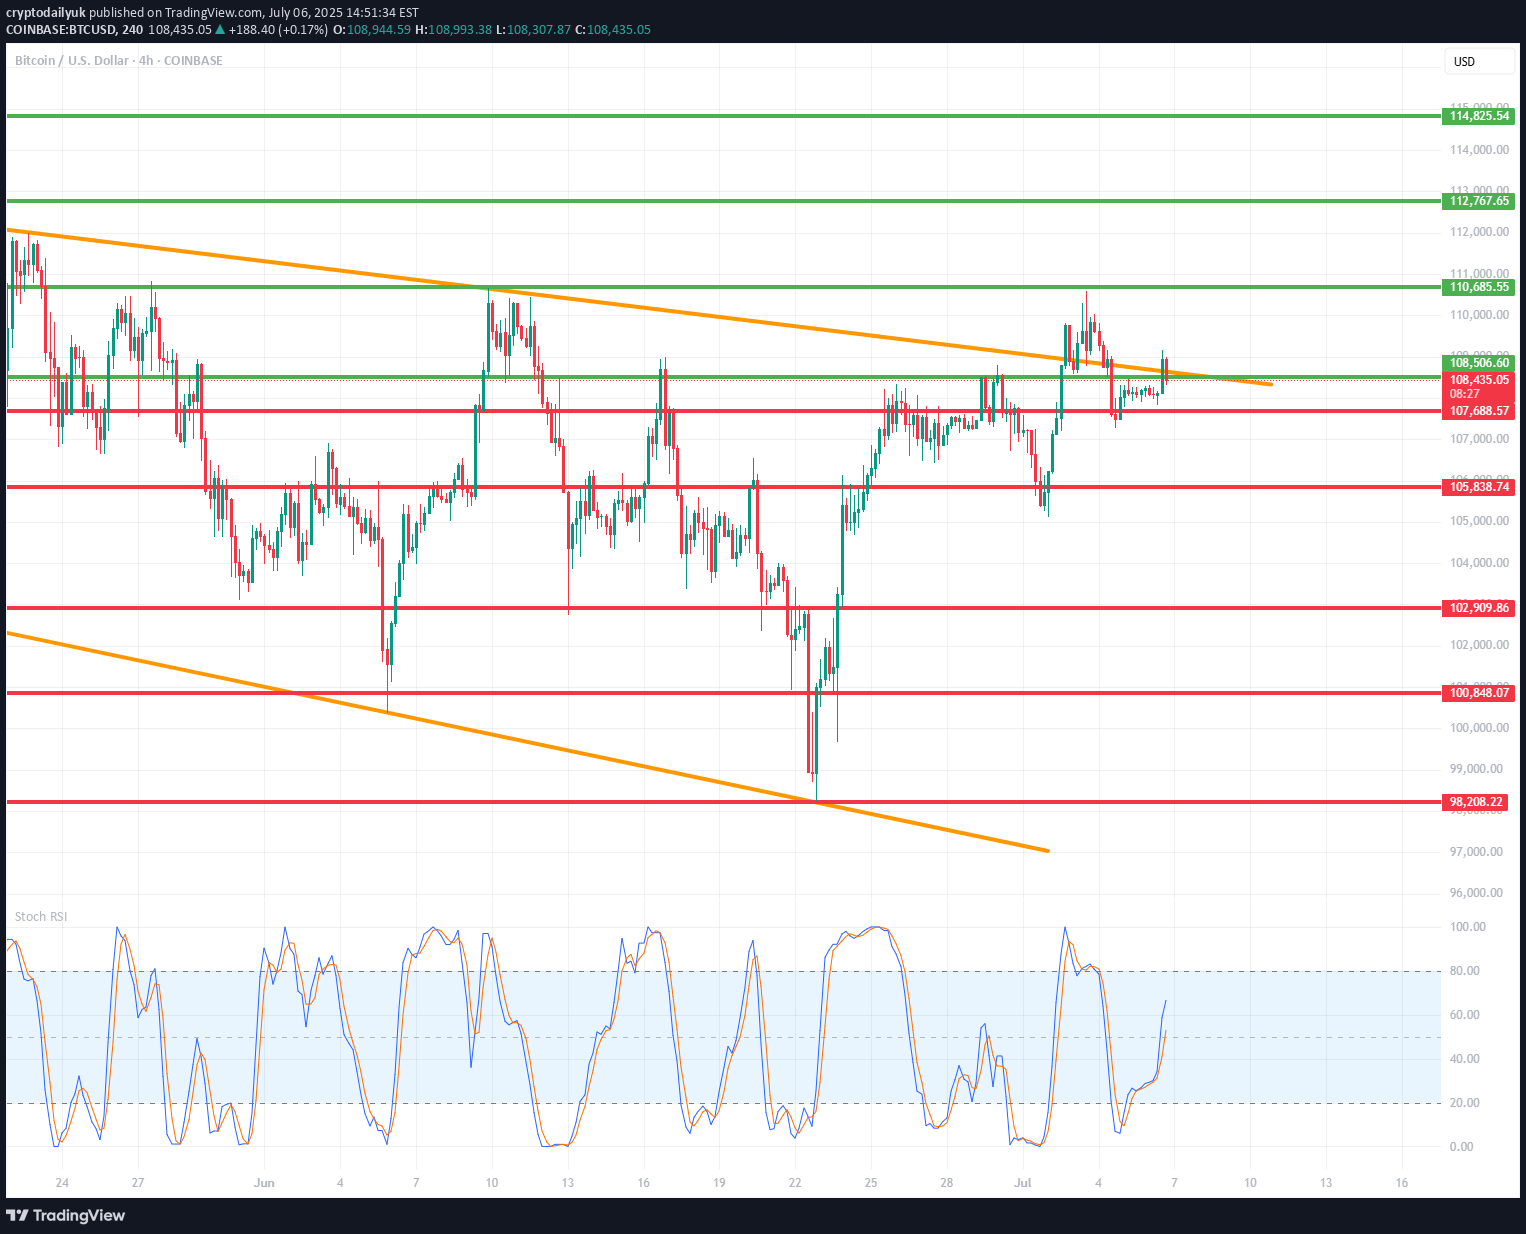
🔍 1. Key Support and Resistance Levels (Horizontal Lines):🟢 Resistances (Green Lines):114,295.54 — strong resistance resulting from previous highs.112,767.65111,009.00110,685.35 — current key level that price may try to retest after a potential breakout.🔴 Supports (Red Lines):108,496.55 — current level being tested, also coinciding with local resistance from the past.107,687.57105,888.74102,909.85100,848.0798,208.22 — strong long-term support; in the past, this level was reacted with a strong bounce.🔶 2. Downtrend channel marked with orange lines:The upper downtrend line acted as resistance.The lower uptrend line acted as support.The price recently broke above the upper line, but is now testing it again - this could be a retrospective retest.➡️ If the close of the H4 candle is above this line - a possible confirmation of the breakout.📊 3. Stochastic RSI indicator (at the bottom of the chart):Currently in the uptrend phase after a bounce from the oversold level (<20).The %K line (blue) is crossed upwards by the %D line (orange) - a bullish signal.Still below the overbought zone, which suggests that the potential uptrend still has room to develop.🧠 4. Market structure and price action:Price broke above the 108.496 level, but is currently struggling to stay above this zone.A retest of the broken triangle could be a healthy move, provided that support is maintained in the 108k–107.6k area.A break below and a close below 107.6k could mean a false breakout and a possible decline towards 105.8k or even 102.9k.🧭 5. Possible scenarios:✅ Bullish scenario:Maintaining the 108.496 level and closing the candle above the upper orange line → continued growth.The nearest targets are:110.685 (first resistance),111.009 and 112.767 next.❌ Bearish scenario:The price will not stay above 108k and will fall below 107.687.Possible return to the previous consolidation range with the target:105.888,and then 102.909 or 100.848.🧮 Summary:Currently, the decisive moment is underway: a test of support after breaking out of the convergent triangle.The Stoch RSI indicator gives a bullish signal, but the price must confirm the movement by behaving above 108k.Retest and bounce - this is a bullish scenario.A breakdown and return under the trend line - means that the breakout was false.
