Technical analysis by biodunoladokun about Symbol PI on 7/4/2025

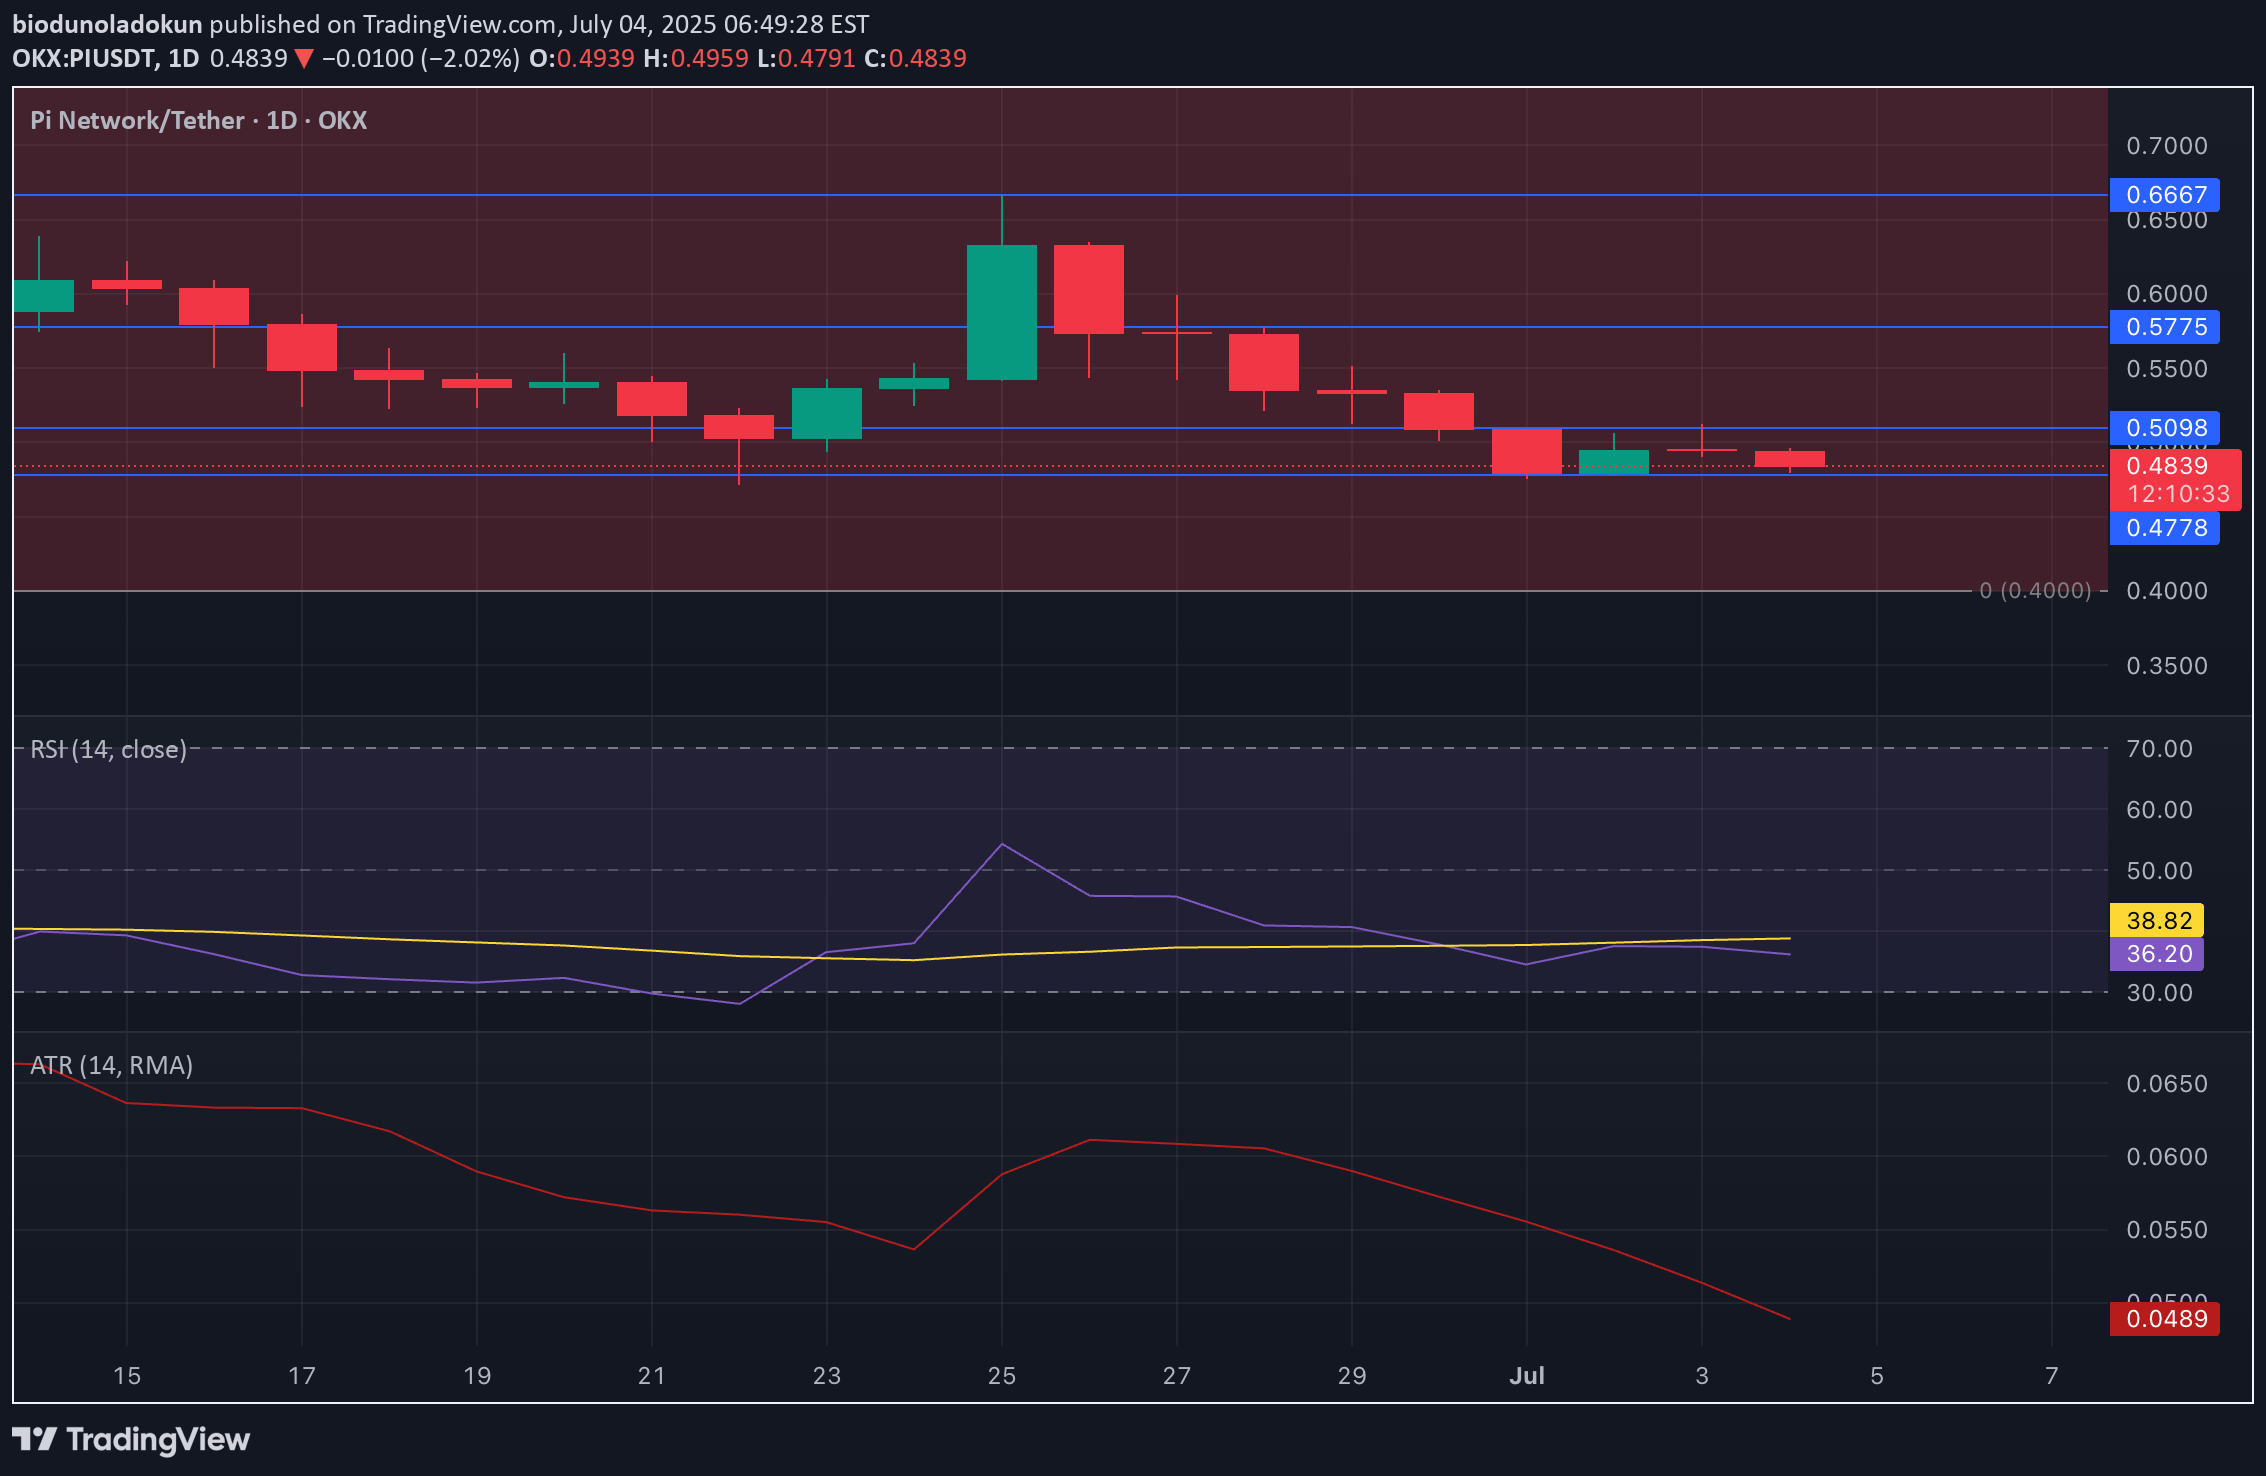
Since Tuesday, PI has been trading within a tight range between the $0.47 support and the $0.50 resistance level. This sideways movement reflects a balance between buyers and sellers, with neither side showing enough strength to push the price in a clear direction. The market appears to be in a state of indecision, as participants wait for a fundamental or technical catalyst to spark a breakout.The Relative Strength Index (RSI) currently sits at 36.18 and has remained relatively flat over the past few days. This indicates a lack of momentum and weak conviction among traders. When RSI trends sideways like this, it typically signals that market participants are staying on the sidelines, avoiding large positions until a clearer trend emerges.Additionally, the Average True Range (ATR) has dropped to 0.048, marking a 12% decline since Tuesday. This confirms the ongoing reduction in market volatility. A falling ATR suggests that price swings are narrowing, often preceding a significant breakout as the market builds up pressure.Taken together, the flat RSI and declining ATR paint a picture of a consolidating market. While PI lacks strong directional momentum at the moment, these conditions often set the stage for a sharp move. Traders should keep a close eye on the $0.47–$0.50 range for signs of a breakout in either direction.
