Technical analysis by Activetrader0 about Symbol PAXG on 7/3/2025

Activetrader0
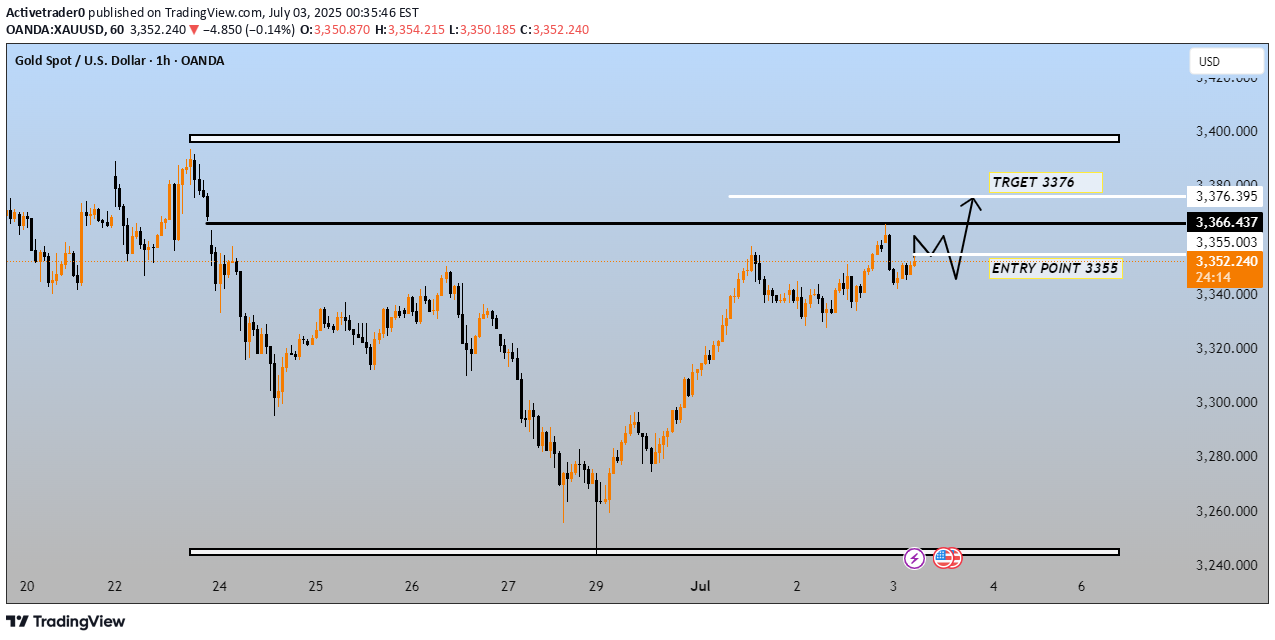
This chart is a technical analysis for Gold Spot (XAU/USD) on the 1-hour timeframe, and it outlines a potential long (buy) trade setup. Here's a breakdown of the key elements:---🔍 Key Levels:Entry Point: 3,355 USDTarget (TP): 3,376 USDCurrent Price: Around 3,352.975 USDResistance Zone: Near 3,366 USDSupport Zone: Around 3,355 USD---📈 Trade Idea Summary:The chart suggests a buy setup if the price retests 3,355 USD and finds support there.A bullish continuation is expected after consolidation, with a projected target of 3,376 USD.The visual arrow and pattern suggest a potential breakout-retest-bounce structure.---⚠ Important Notes:The chart implies waiting for confirmation around 3,355 before entering.The target level (3,376) sits just below the next resistance area, suggesting a conservative take-profit approach.No stop-loss is shown, but it should be considered — possibly just below the recent swing low (around 3,340–3,345).---Would you like help identifying a stop-loss level, risk/reward ratio, or confirmation signals for this setup?
