Technical analysis by 11esmaeili about Stock عیار: Sell recommendation (7/1/2025)
11esmaeili
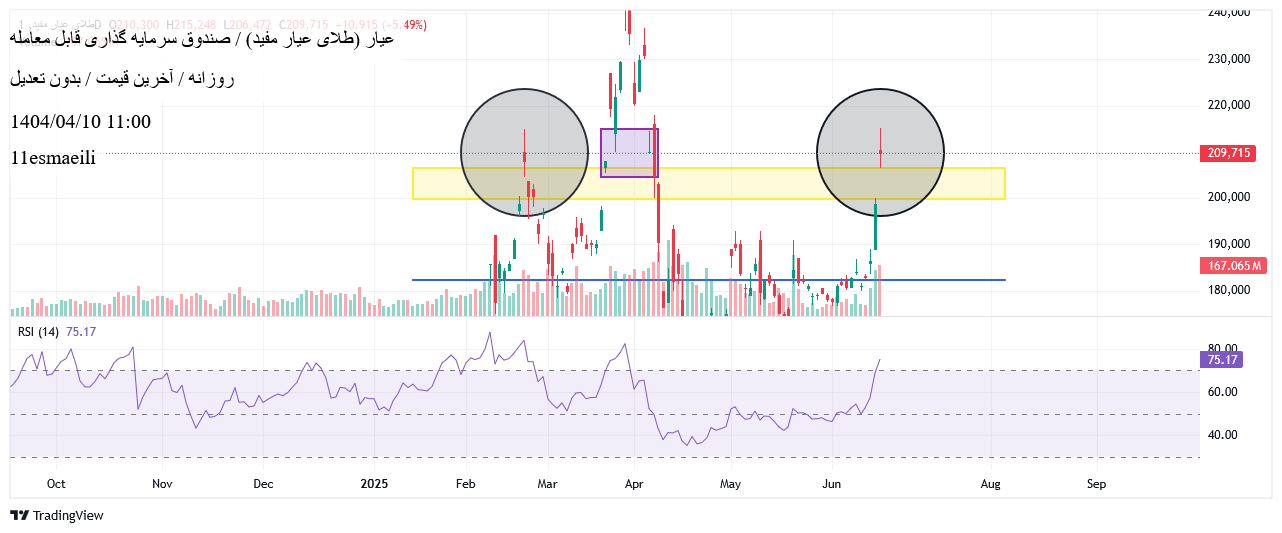
Width of your devotion. #To -time_care Yes, friends of the series of paintings in my service. #History_ will be repeated This analysis includes the following: ** Two circles of black = represent the similarity of the candlesticks ** a Purple Square = indicating a hurry to break the previous roof ** a yellow rectangle = indicating a previous chat repeating ** a blue line = represents the support point —————————————————————————————————————————————————————————————————————————————————————————————————————————Ics Explanations I have to say: According to the chart, both candlesticks inside the circles and their conditions are quite similar, except that it has hit the ceiling in the past and is now the same roof that was rushed by the purple box and could not remain constant, which has reacted to the same price as I had to display with yellow box. If the correction approves, we should wait for the reaction to the support point of the blue line. Currently, the support point with the recent positives and positive trends has been able to reach 18200. I hope that my beginner explanation has been understandable and understanding. Thanks for the precision you left
 Rahavard