11esmaeili
@h_11esmaeili

What symbols does the trader recommend buying?
Purchase History
پیام های تریدر
Filter
11esmaeili
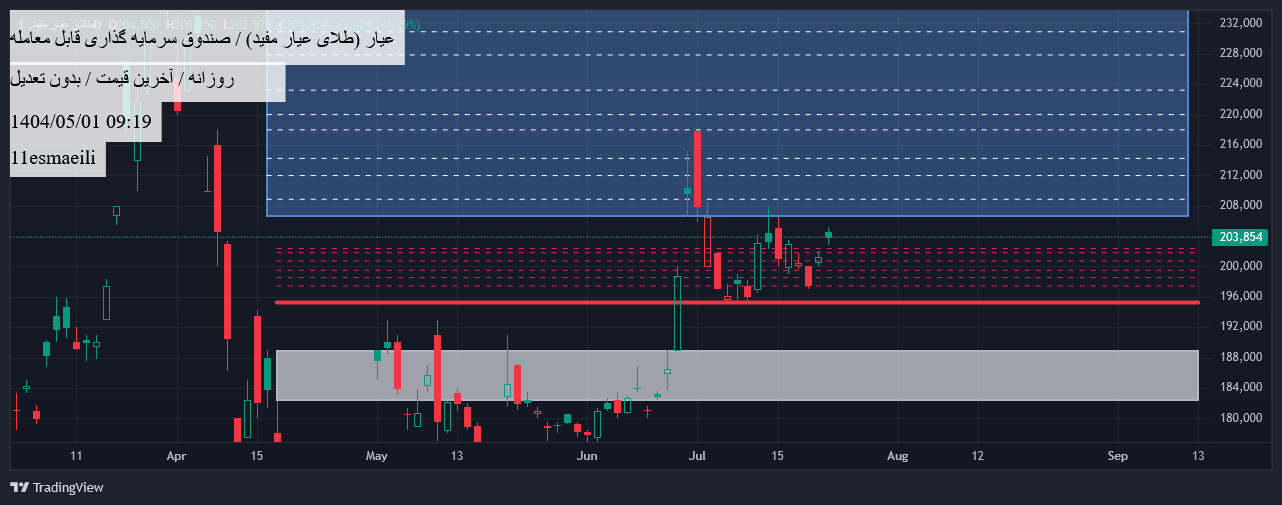
#Painting time Well again my servant with a drawing of another painting We have a low -color red line that is a reflection of the 19300 support floor. We also have a blue box above that show the resistance ahead and the hard work that has the help of growth. We also have a white box that we don't have the support of the red chapter. So for now, the conditions for climbing are met. thanks for by. By. Aghayhamsar
11esmaeili
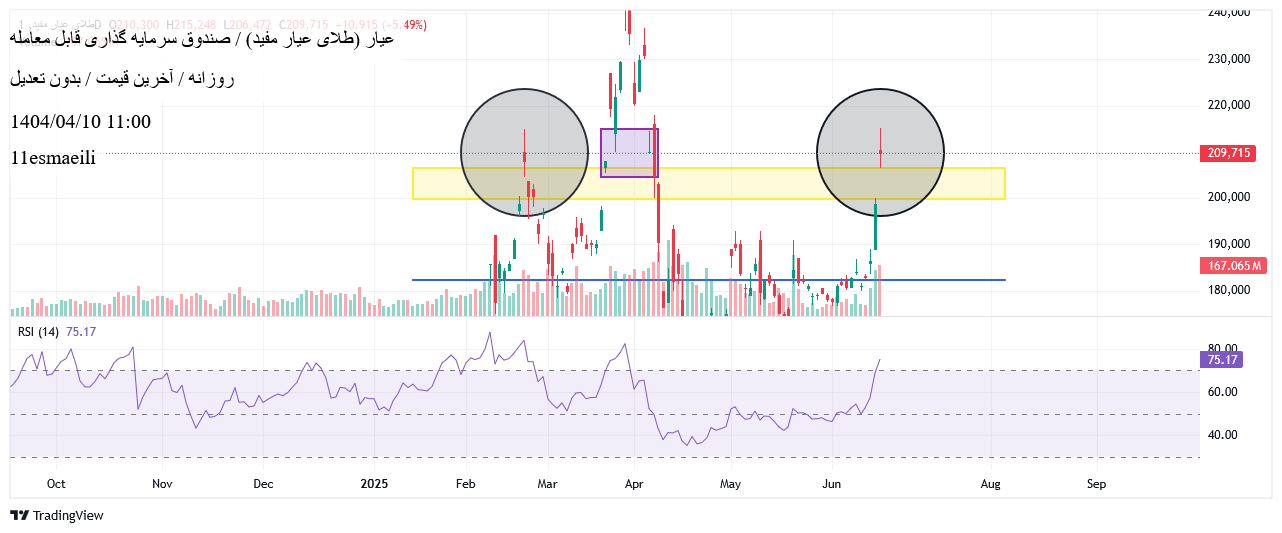
Width of your devotion. #To -time_care Yes, friends of the series of paintings in my service. #History_ will be repeated This analysis includes the following: ** Two circles of black = represent the similarity of the candlesticks ** a Purple Square = indicating a hurry to break the previous roof ** a yellow rectangle = indicating a previous chat repeating ** a blue line = represents the support point —————————————————————————————————————————————————————————————————————————————————————————————————————————Ics Explanations I have to say: According to the chart, both candlesticks inside the circles and their conditions are quite similar, except that it has hit the ceiling in the past and is now the same roof that was rushed by the purple box and could not remain constant, which has reacted to the same price as I had to display with yellow box. If the correction approves, we should wait for the reaction to the support point of the blue line. Currently, the support point with the recent positives and positive trends has been able to reach 18200. I hope that my beginner explanation has been understandable and understanding. Thanks for the precision you left
11esmaeili
#Analysis update With the politeness and respect of the service, I will not be at your service for a continuous service. I am honored to announce that all the boxes mentioned in the last 2 months analysis were implemented step by step (in the history of analysis you can follow up) Conditions to realize the last box. Considering the liquidity and personal strategy and the history of purchasing the necessary measures.
11esmaeili
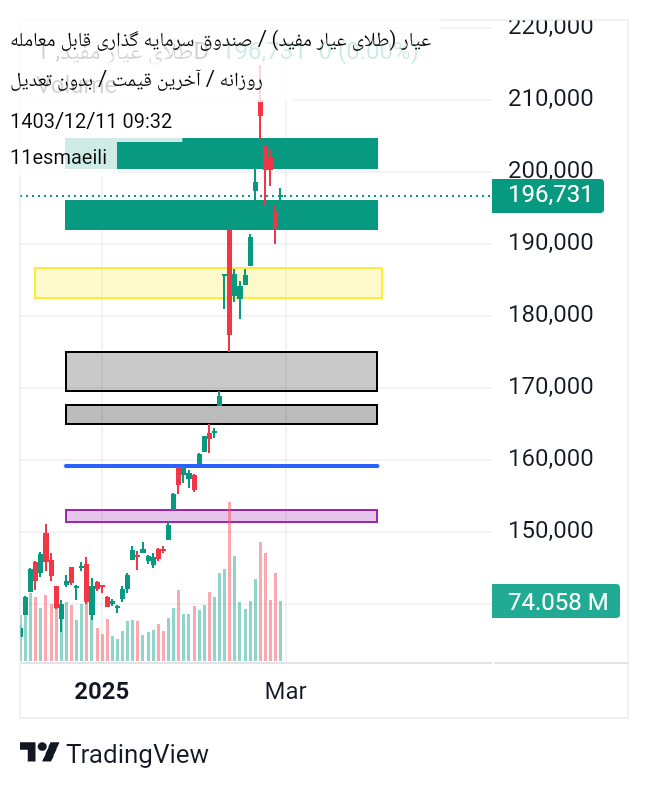
Update the previous statement: As I mentioned earlier, one of the chats was filled and the black box became green. Today we are all waiting for the yellow box to touch, with a negative 2 % price correction. It is permissible to enter a step. Finally, I personally expect the black box to range from 1 to 2.
11esmaeili
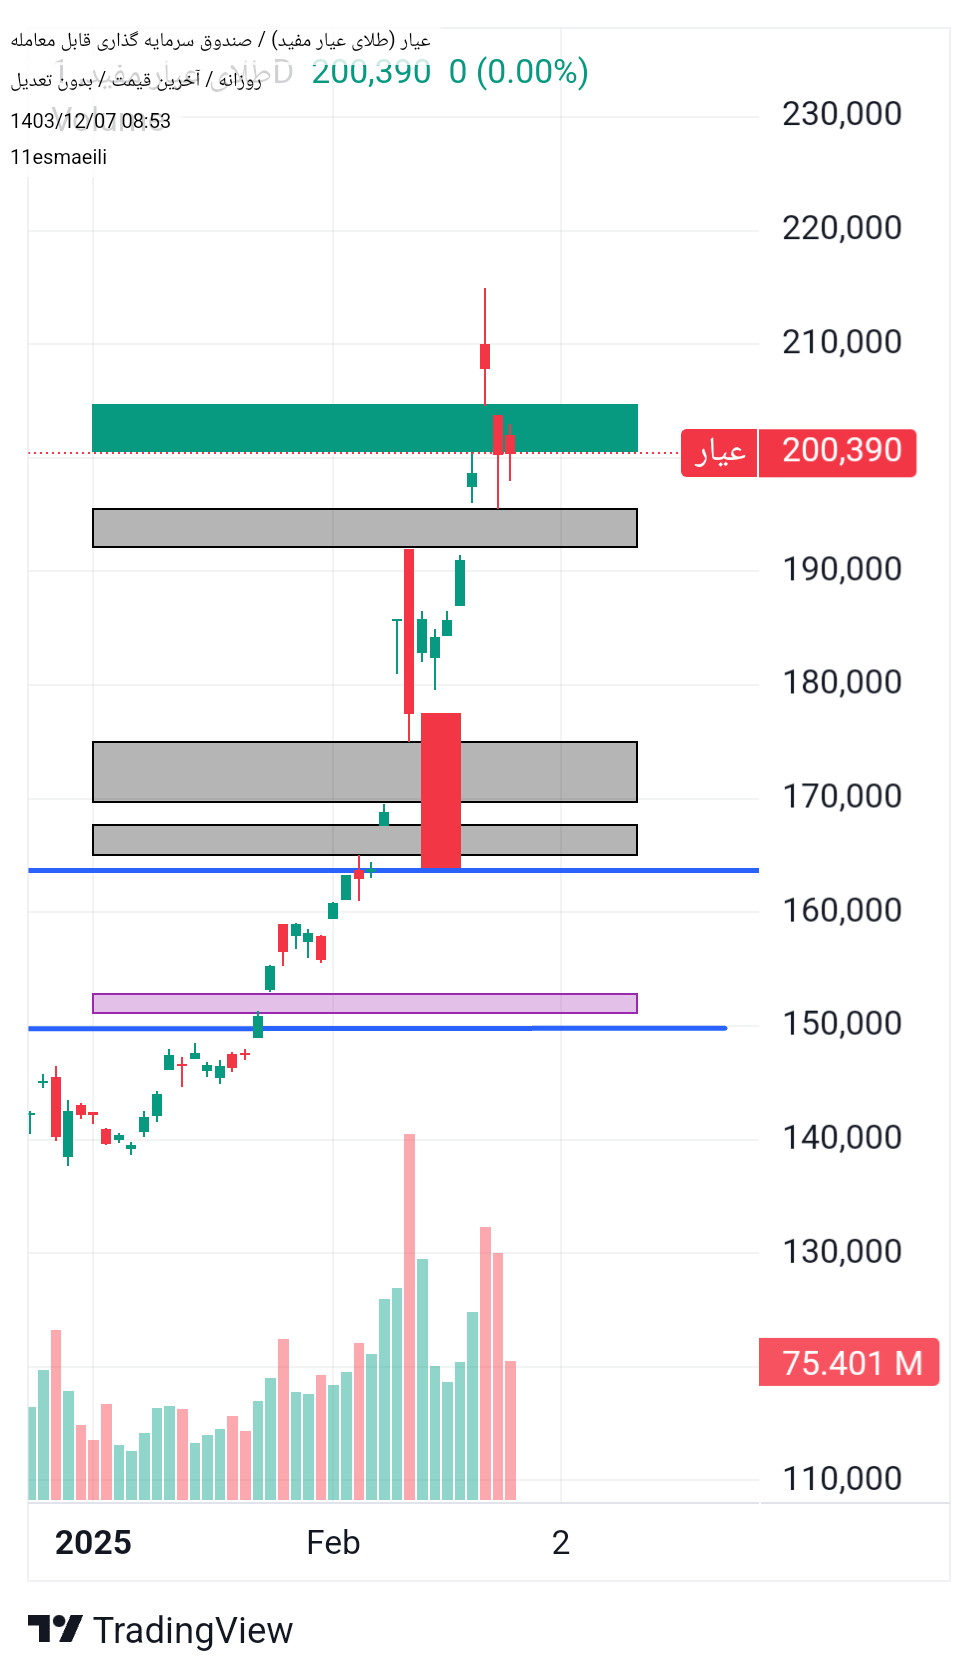
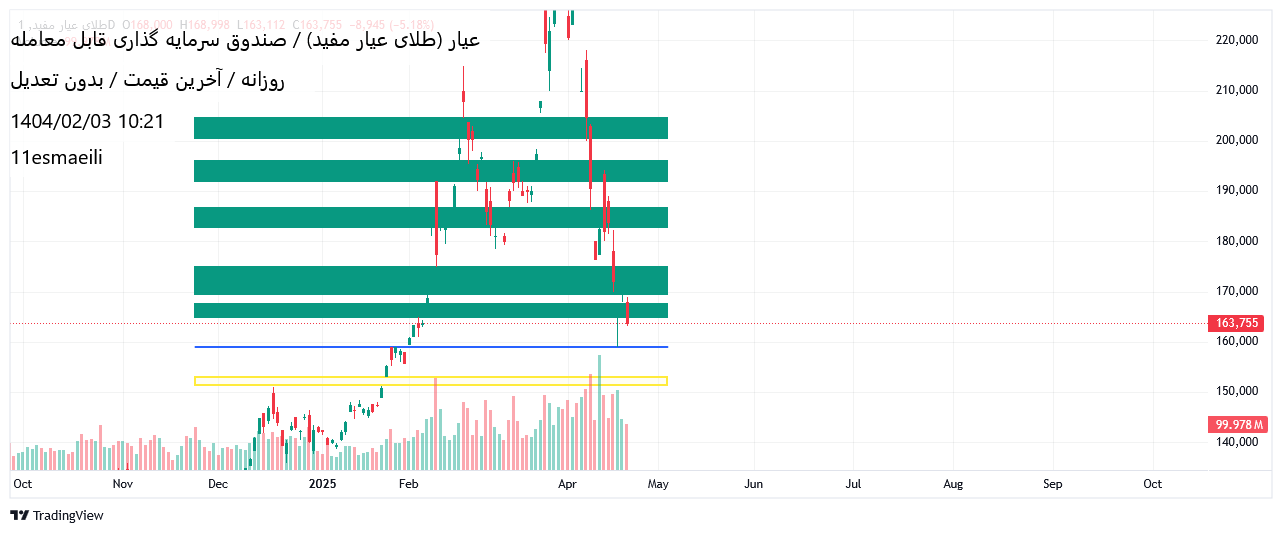
This statement is not an analysis. It is only a drawing for those who are strategic. We have a few chats that are logical to be filled with future prices, otherwise it is possible to return to those points. Green horizontal box first chat. Black horizontal cadres are unpublished chats. Purple horizontal box is an forgotten chat -filled color so -called fire. The red vertical frame of the space that the market could prevent with 4 red candlesticks could prevent so much stress and stress. The drawing blue lines can also be far from throwing points. In the meantime, the ceiling was formed within three days, and at the moment it could not maintain its uptrend.
11esmaeili
This writing is merely for displaying sensitive points, and there is definitely no discussion. Only, given the heart's belief that history is repeated, the current price is on the psychological ceiling. The extent to which buyers' power was visible.
11esmaeili
Greetings to all and happiness for birth and joy. As promoting the culture of training, I have learned to highlight the sensitive areas of the ceiling and floor and share with you. The hassle of research and research with you nobles. De King Izbeck. Be successful and victorious
11esmaeili

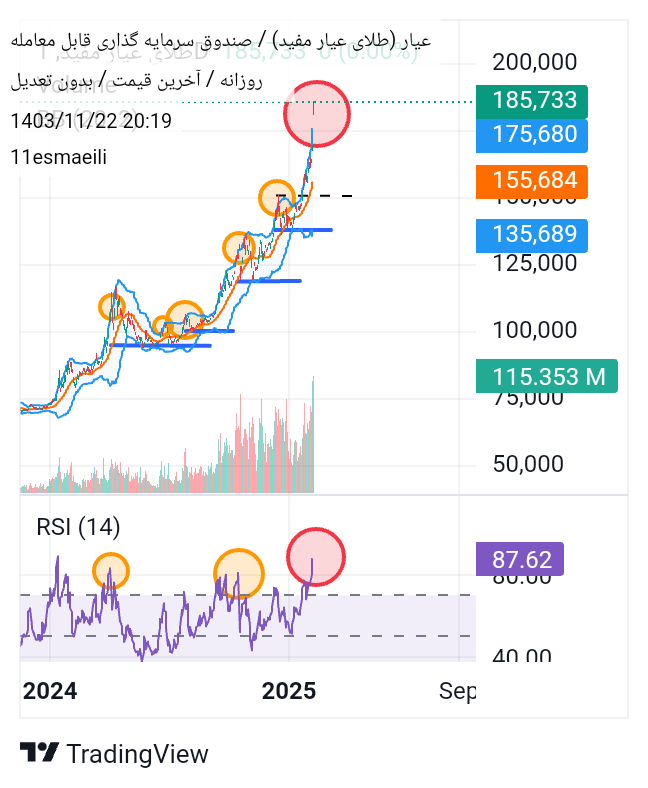
Due to the 2 % weekly discharge of the gold bubble and with the gold price trend as well as the RSI oscillator in the right range, it appears to be supported and resumed if the dollar continues to grow. Of course, I have to say that the two -three -day frame time has a decrease signal that should be further explored if the specified price chats should be further explored. Tomorrow and Friday more will be examined and your service informed.
11esmaeili

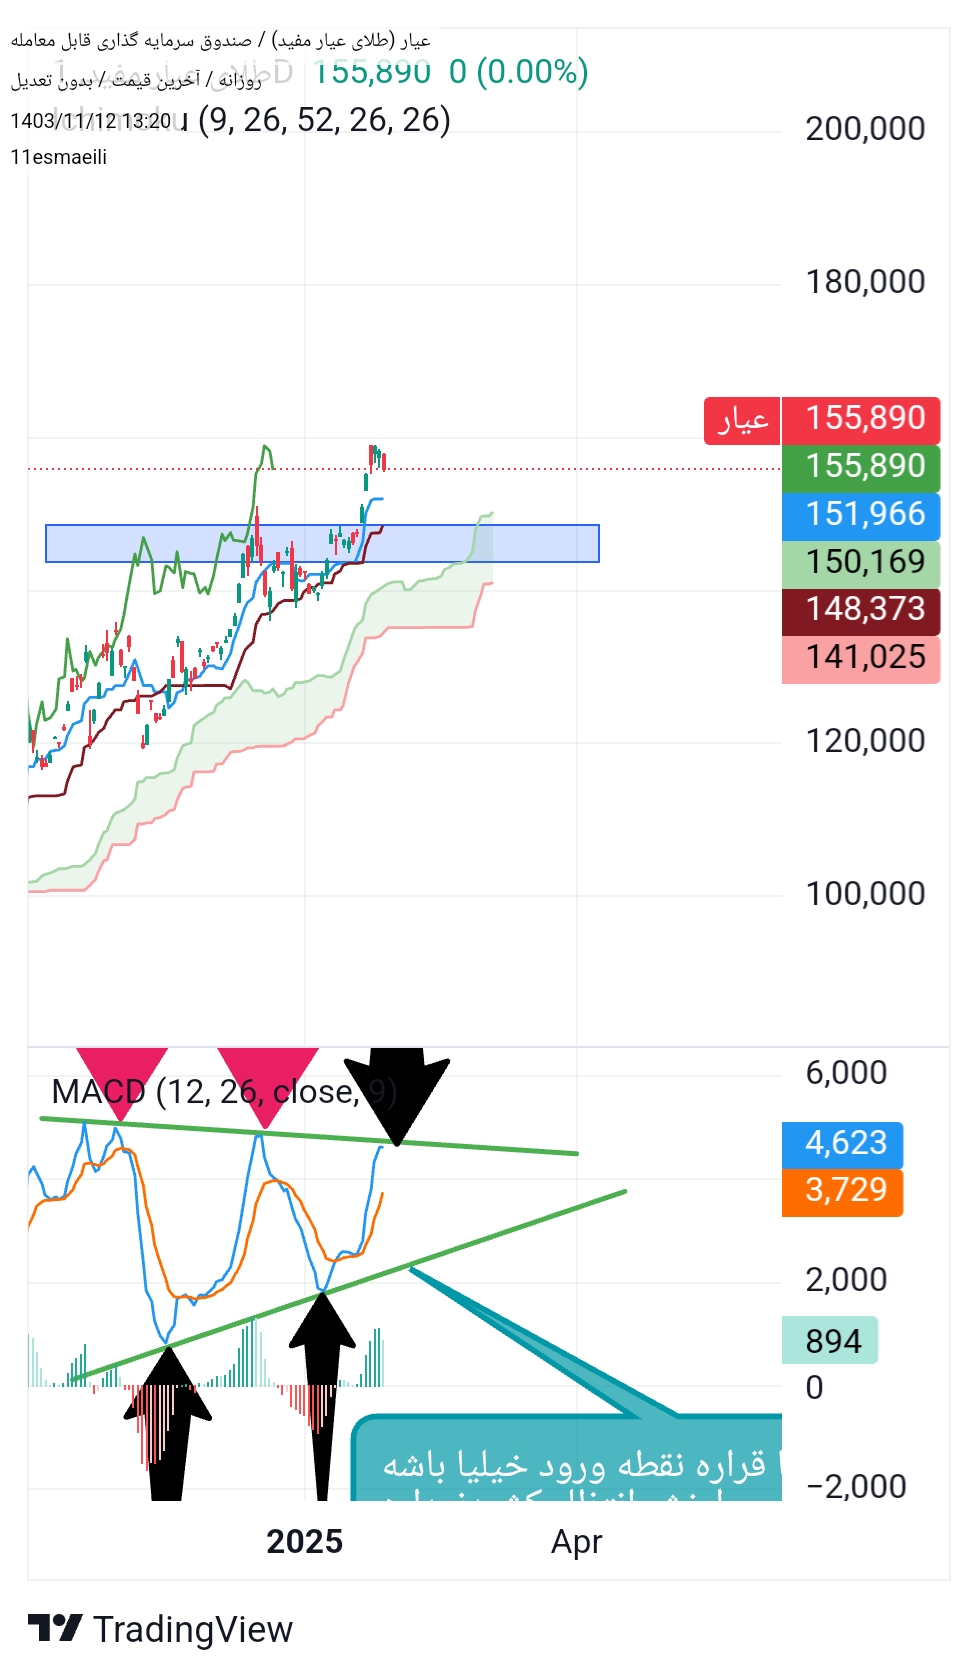
Width of your devotion. Failure of the water line up and fixing it is one of the requirements to continue the growth of the chair. As long as the trend in the black box depicted in the RSI indicator is not expected to grow.
11esmaeili

Greetings to everyone. According to the analysis of two days ago, we were around the price and saw a return, and today the consolidation was achieved. If a few other candlesticks are stabilized, you can decide to enter the support point. For now, the black box is monitored. The better the candlesticks are in the middle of the box to make the future decision.
Disclaimer
Any content and materials included in Sahmeto's website and official communication channels are a compilation of personal opinions and analyses and are not binding. They do not constitute any recommendation for buying, selling, entering or exiting the stock market and cryptocurrency market. Also, all news and analyses included in the website and channels are merely republished information from official and unofficial domestic and foreign sources, and it is obvious that users of the said content are responsible for following up and ensuring the authenticity and accuracy of the materials. Therefore, while disclaiming responsibility, it is declared that the responsibility for any decision-making, action, and potential profit and loss in the capital market and cryptocurrency market lies with the trader.