Technical analysis by Tami512 about Symbol PAXG on 7/1/2025

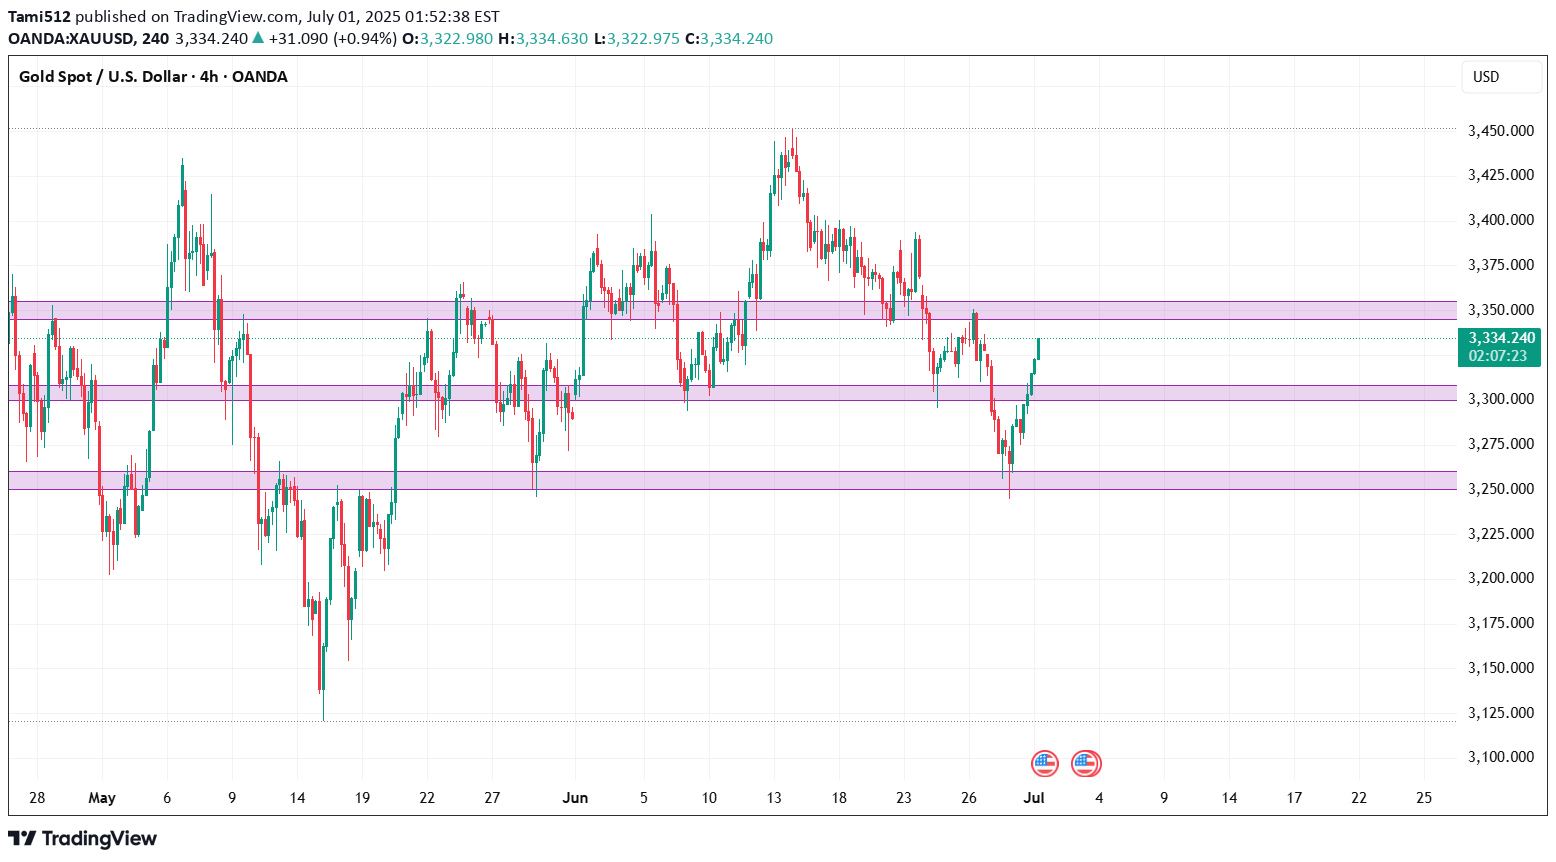
In the world of financial markets, few assets capture global attention like gold. A timeless store of value, gold continues to act as both a hedge against uncertainty and a battleground for technical traders seeking high-probability setups. As of today, gold (XAU/USD) is trading at $3328, a level that places it just beneath the most recent multi-month high at $3345. The recent surge in price is underpinned by both macroeconomic factors and bullish technical structure. However, as any seasoned trader knows, trends rarely move in straight lines — and gold is now approaching a technically sensitive juncture.I. Gold’s Structural Landscape on the 4-Hour ChartThe four-hour chart reveals a textbook bullish trend. Beginning with a significant impulse from the $3194 base, gold has climbed steadily, printing higher highs and higher lows. The most recent break of structure (BOS) above $3312 confirmed the continuation of bullish intent, while the market remains firmly above key swing lows — signaling that the bullish regime has not yet been invalidated.Price action shows clean, impulsive expansions followed by short consolidations, with buyers continuing to absorb supply at every retracement. Despite that strength, gold has now reached a potential exhaustion point, with the price reacting to overhead supply at $3345–3355, forming what could be an early-stage distribution zone.Key Market Structure Developments:BOS at $3312: confirms uptrendNo CHoCH (Change of Character) yet — no confirmed bearish reversalClean liquidity grab above $3345, followed by rejection — hinting at short-term profit-taking or internal bearish intentII. The Fibonacci Grid: Retracement and Extension ZonesApplying Fibonacci retracement from the $3194 swing low to the $3345 high offers crucial levels of interest. The golden ratio at 61.8% ($3253) aligns perfectly with prior demand and a 4-hour bullish order block. Similarly, the 38.2% level at $3285 corresponds with a minor liquidity pool and potential reaccumulation base.Fibonacci LevelPrice23.6%$330838.2%$328550.0%$326961.8%$325378.6%$3228On the extension side, should gold resume its rally beyond $3345, projected Fibonacci targets sit at $3372 (127.2%) and $3410 (161.8%), with both acting as measured projections for trend continuation.III. Supply and Demand: Mapping Institutional FootprintsInstitutional activity is best observed through unmitigated supply and demand zones — areas where large orders caused rapid price displacement. Gold currently trades between two such zones:Demand Zone: $3250–$3260 — a sharp bullish rejection occurred here on the last visit, indicating strong buy-side interest and likely pending buy ordersSupply Zone: $3345–$3355 — where a sell-side liquidity grab recently occurred, followed by a strong rejection candleThese two zones bracket the market and serve as the highest probability areas for future reactions.IV. The Smart Money Concepts (SMC) FrameworkSMC theory revolves around observing the footprints of large market participants — often labeled “smart money.” In gold’s current structure, SMC tools provide a clearer roadmap than standard indicators.Current Observations:Break of Structure (BOS): Confirmed at $3312 (bullish continuation)Change of Character (CHoCH): Absent (bull trend intact)Buy-Side Liquidity Grab: Above $3345 — trapped breakout buyers likely fuel for reversalSell-Side Liquidity Pool: Uncollected beneath $3280 — probable magnet for a liquidity sweepFair Value Gap (FVG): Between $3260 and $3280 — price inefficiency offering high-probability reentry for smart moneyBullish Order Block (OB): At $3250–$3260 — final down candle before explosive up move, unmitigatedAll these elements point to a high-probability pullback, rather than a full-blown reversal. Until structure is broken with a CHoCH, the base case remains bullish.V. High-Probability Levels for 4-Hour-Based OpportunitiesFrom this framework, we identify the following key price levels:The highest-probability reaction is expected at $3250–$3260, where smart money is likely to re-engage if price retraces.VI. Refinement on the 1-Hour Chart: Intraday Trade SetupsZooming into the 1-hour chart allows us to fine-tune our execution strategy. Gold is consolidating just below $3330, forming what appears to be an ascending triangle — a common bullish continuation structure — but within the broader context of a possible short-term pullback.Intraday Trade Idea #1 — High-Conviction LongEntry: $3260Stop-Loss: $3245Take-Profit 1: $3308Take-Profit 2: $3340Risk–Reward: ~1:4Rationale: Aligned with 4H demand, fair value gap, OB, and golden ratio retracement. Structure remains bullish.Intraday Trade Idea #2 — Speculative Short (Low Conviction)Entry: $3340–$3350Stop-Loss: $3362TP1: $3305TP2: $3285Risk–Reward: ~1:2.5Rationale: Countertrend, only viable if bearish rejection candle forms. Not aligned with dominant 4H structure.VII. The Golden Setup: Long from Demand + FVG ConfluenceAmong all technical configurations, the long setup at $3260 emerges as the most compelling. It is supported by:An unmitigated bullish order blockA clear fair value gap61.8% Fibonacci retracementUntouched sell-side liquidity belowDirectional alignment with trendInstitutional demand patternThis setup offers both superior risk-to-reward and a technical foundation that aligns with Smart Money’s modus operandi. It represents a low-risk, high-reward opportunity for traders who wait for price to re-enter the value zone and confirm with bullish order flow (e.g., a bullish engulfing or BOS on 15m).VIII. Final Thoughts and Tactical SummaryAs of July 1, 2025, the gold market reflects strong bullish momentum, albeit entering a corrective phase that should not be mistaken for reversal. While intraday volatility and range compression may tempt countertrend trades, the smartest play remains to wait for a discounted reentry into a zone of value.Until structure shifts significantly, the dominant trading thesis remains: “Buy the dip into institutional zones”. Patience, not aggression, will separate the retail trader from the professional in today’s complex market structure.
