
Tami512
@t_Tami512

What symbols does the trader recommend buying?
Purchase History
پیام های تریدر
Filter
Signal Type
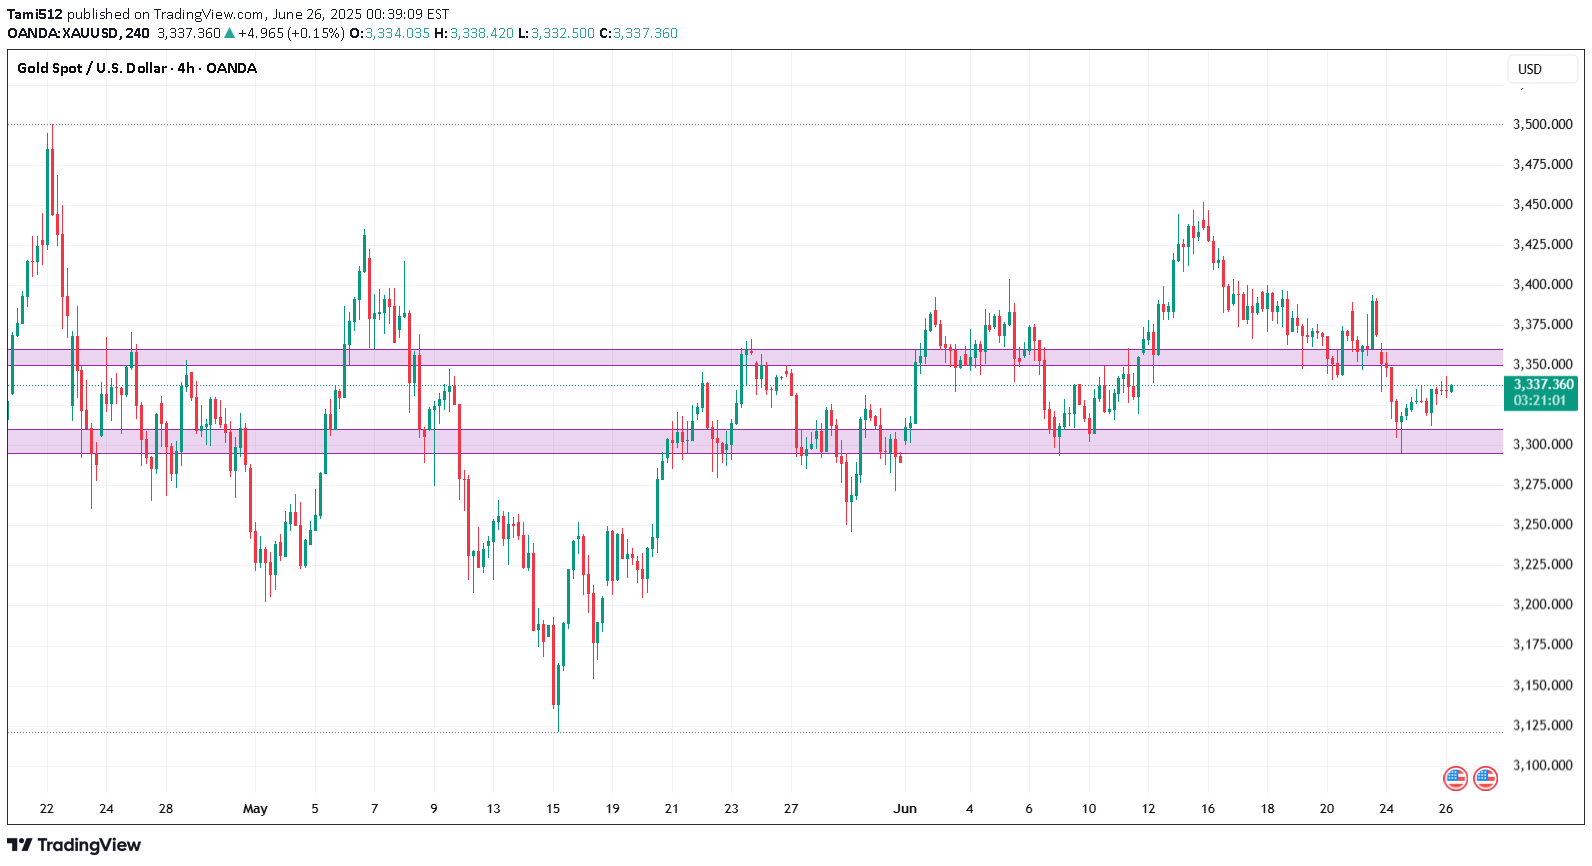
As gold continues to trade near record highs, the market’s current price action around $3,336–3,340 demands a sharp, disciplined technical view. This premium analysis combines price action, Fibonacci techniques, institutional concepts (ICT and Smart Money Concepts), and advanced supply–demand dynamics to identify actionable trade opportunities. We anchor on the 4-hour timeframe for directional bias and zoom into the 1-hour chart for precision intraday setups. 📊 4‑Hour Timeframe: Structure and Directional Bias Gold remains in a clear bullish structure on the 4-hour chart, as evidenced by sustained higher highs and higher lows. The most recent bullish Break of Structure (BOS) occurred above the $3,320–3,325 level, confirming buyers’ control for now. Currently, price hovers near equilibrium at the 61.8% Fibonacci retracement, testing prior resistance as potential support. This zone aligns with a small fair value gap (FVG), reinforcing it as an area of interest for smart money participants. Key 4H Levels to Watch LevelSignificance $3,360–3,365Major supply zone & bearish OB $3,350–3,355Minor resistance $3,337–3,34061.8% Fib / equilibrium $3,330–3,333BOS retest & key support $3,300–3,310Strong demand zone & bullish OB $3,285–3,295Secondary demand zone below BOS The directional bias on 4H remains neutral-to-bullish, contingent on price holding above $3,300. A clean break and close above $3,360 could open a path to $3,400–3,420, while a sustained drop below $3,300 would mark a change of character (CHOCH) and shift bias to bearish. 🪙 Institutional Concepts in Play Order Blocks (OB): Strong bullish OB sits at $3,300–3,310, while a bearish OB dominates at $3,355–3,365. Fair Value Gaps (FVG): On the bullish side, $3,300–3,315 remains unfilled; on the bearish side, $3,330–3,345 caps rallies. Liquidity Grabs: Dips toward $3,295–3,300 appear to sweep sell-side liquidity, while spikes above $3,360 tap into resting buy stops. The area around $3,330 remains a key battleground where smart money likely accumulates positions before the next impulsive move. ⏳ 1‑Hour Timeframe: Intraday Trade Setups On the 1-hour chart, the market is compressing between a bullish order block and bearish supply. Price action shows evidence of short-term liquidity sweeps and reactions to imbalances, offering two clear scenarios for intraday traders. 📈 Setup A – Bullish Zone Bounce Entry: Buy limit at $3,332–3,333 Stop-loss: Below $3,328 Take-Profit 1: $3,345 Take-Profit 2: $3,355 Rationale: Confluence of 4H demand, Fib retracement, BOS retest, and 1H bullish order block. 📉 Setup B – Supply Rejection Short Entry: Sell limit at $3,355–3,360 Stop-loss: Above $3,365 Take-Profit 1: $3,337 Take-Profit 2: $3,330 Rationale: Price into 4H bearish OB, aligning with supply and stop runs above recent highs. 🌟 The Golden Setup Among these, the Bullish Zone Bounce at $3,332–3,333 stands out as the highest-probability trade. This level represents maximum confluence: Retest of 4H BOS. Bullish OB on 1H. 61.8% Fibonacci support. Unmitigated fair value gap. This setup offers a favorable risk–reward profile with clear invalidation and multiple upside targets. 🔎 Summary Table BiasKey Support ZonesKey Resistance Zones Neutral-to-bullish$3,300–3,310, $3,330–3,333$3,350–3,355, $3,360–3,365 Intraday SetupsEntry ZoneStop-LossTake-Profit Targets Bullish Zone Bounce 🌟$3,332–3,333< $3,328$3,345 / $3,355 Supply Rejection Short$3,355–3,360> $3,365$3,337 / $3,330 📣 Final Word Gold maintains a structurally bullish outlook above $3,300, with strong institutional footprints evident in the $3,300–3,333 demand zones. Traders should remain vigilant around $3,360, where sell-side liquidity and supply are concentrated. The Golden Setup — a bullish bounce from $3,332 — offers the best confluence and statistical edge intraday.Contact me to Join our group for free gold trading ideas on daily basis Watsapp Contact +971559939571
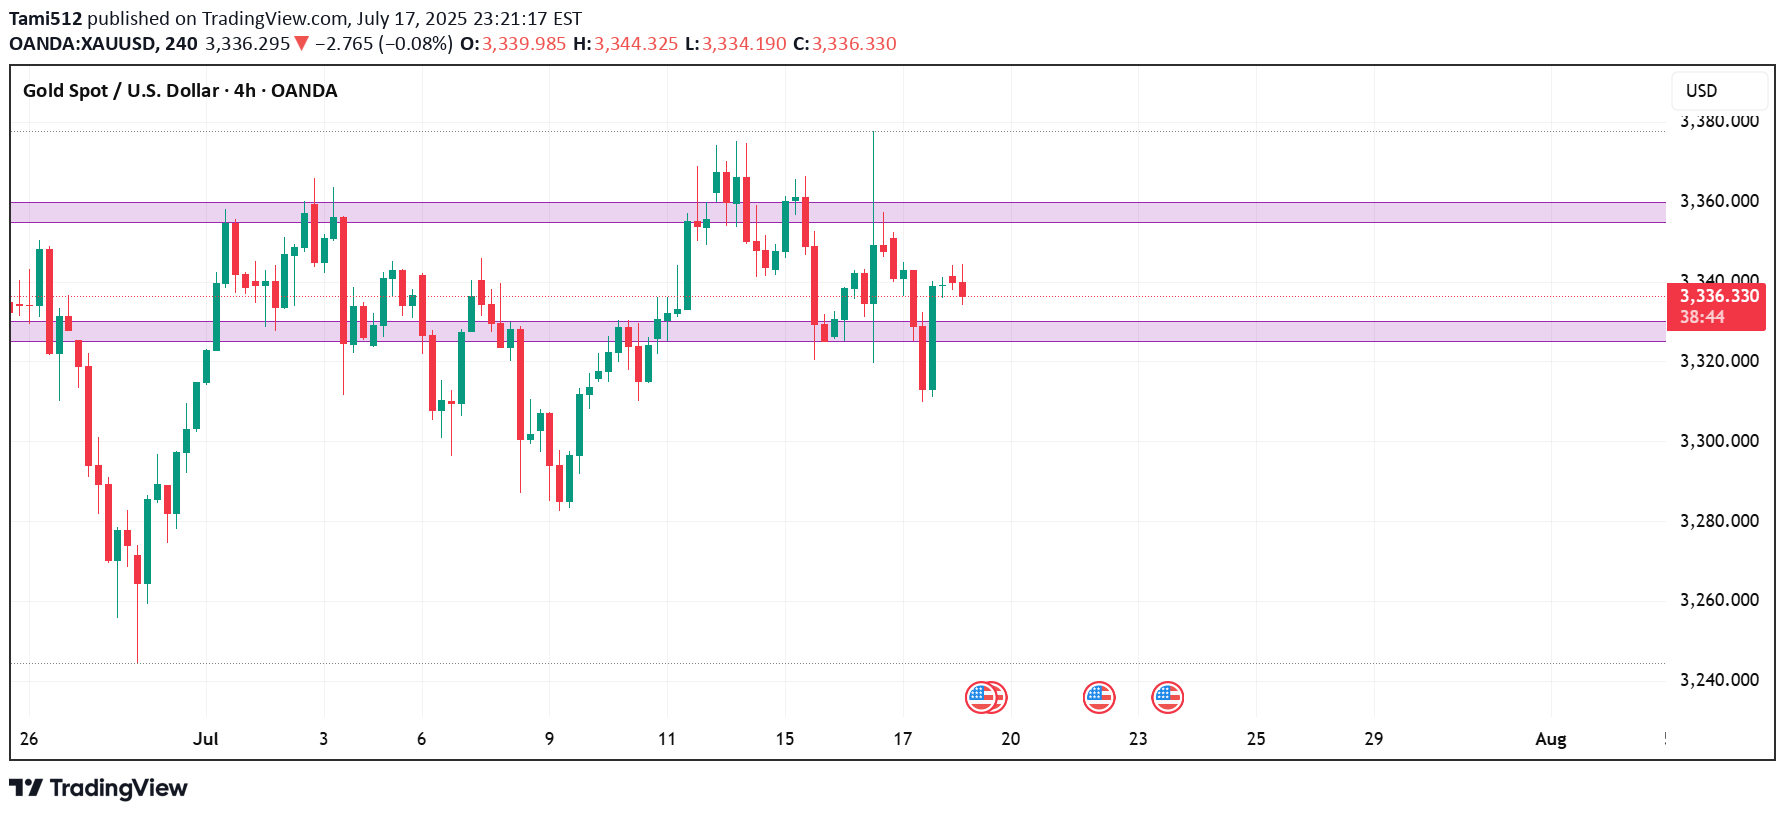
🔷 Market Context and Current Price As of July 17, 2025, gold (XAU/USD) is trading near $3,341, slightly above the week’s midpoint. The metal remains range-bound but shows signs of bullish resilience as it tests key structural support zones. Today’s analysis integrates advanced technical methodologies — including Price Action, Fibonacci tools, ICT and Smart Money Concepts — to present a clear directional bias and actionable trade ideas. 📊 4‑Hour Chart Analysis 1️⃣ Price Structure & Trend Gold has maintained a sideways-to-upward bias, consolidating between $3,320 (support base) and $3,377 (range resistance). Higher lows since early July reinforce the short-term bullish narrative, though price remains capped by supply in the upper 3,370s. No decisive Break of Structure (BOS) has yet occurred, keeping price within this range. However, minor bullish BOS signals have appeared near $3,332–$3,334, with a confirmed Change of Character (CHOCH) around $3,320–$3,324, as buyers repeatedly defended this level. 2️⃣ Smart Money Concepts & ICT Insights Demand Zone / Order Block (OB): $3,332–$3,334. This zone aligns with a recent fair value gap and bullish order block. Supply Zone / OB: $3,355–$3,359, corresponding to prior inefficiencies and institutional selling. Liquidity Levels: Sell-side liquidity was swept near $3,320 earlier this week, suggesting smart money accumulation below prior lows. Fair Value Gap (Imbalance): Present at $3,332–$3,333, partially filled and offering a strong risk-reward for long setups. 3️⃣ Fibonacci Levels Using the recent swing low ($3,320) and swing high ($3,377), Fibonacci retracements show: 38.2%: ~$3,342 — currently being tested. 50%: ~$3,348 — an interim bullish target. Fibonacci extensions project potential upside toward $3,401 if momentum strengthens beyond the range top. 4️⃣ Key Levels Summary (4H) ZoneLevel Demand / Buy Zone$3,332–$3,334 Structural Support$3,320 Interim Pivot$3,340–$3,342 Supply / Sell Zone$3,355–$3,359 Range Ceiling$3,375–$3,377 🔷 Directional Bias and Strategy The 4-hour structure remains neutral-to-bullish, favoring upside so long as the $3,332–$3,334 demand zone holds. A confirmed BOS above $3,342–$3,344 could accelerate bullish momentum toward $3,355–$3,360 and even $3,375. Conversely, a breakdown below $3,332 risks revisiting $3,320 and potentially $3,300. ⏳ 1‑Hour Chart – Intraday Trade Setups The 1-hour timeframe reveals tactical opportunities aligned with the broader bias: SetupDirectionEntryStop LossTake Profit Setup A – Smart Money LongLong$3,334$3,329$3,348 / $3,355 Setup B – Breakout LongLong$3,344 (after breakout)$3,340$3,355 / $3,375 Setup C – Range ShortShort$3,355–$3,359$3,362$3,340 / $3,332 🏆 The Golden Setup Setup A – Smart Money Long offers the highest statistical edge: Entry: $3,334 (at demand OB / FVG) Stop Loss: $3,329 (below structure) Take Profits: TP1: $3,348 (pivot) TP2: $3,355 (supply zone) R:R Ratio: ~2.8:1 This setup benefits from multi-timeframe confluences: demand zone, fair value gap, bullish CHOCH, and proximity to BOS, making it a high‑conviction trade. 🔷 External Consensus Check An alignment scan of professional analyst views shows strong consensus: Buy interest remains concentrated around $3,332–$3,335. Profit-taking and caution advised as price approaches $3,355–$3,377. No notable divergence in professional outlook — most remain cautiously bullish above $3,332. 📜 Summary Report ✅ Bias: Neutral-to-bullish above $3,332; downside risk below. ✅ Key Levels: $3,332–$3,334 (buy zone), $3,355–$3,359 (sell zone), $3,375–$3,377 (range ceiling). ✅ Top Trade: Long from $3,334 with stops under $3,329 and targets at $3,348/$3,355. ✅ Alternate Trades: Breakout long above $3,344 or short from supply near $3,355. ✅ Confidence Zones: Buyers dominate above $3,332; sellers reappear above $3,355. Conclusion Gold remains in a well‑defined range, with smart money likely accumulating near the lower boundary at $3,332. With structural supports intact and demand zones respected, the path of least resistance favors cautious upside toward $3,355 and possibly $3,375. Intraday traders are advised to focus on precise execution within the outlined confidence zones, maintaining discipline around stops and targets. The current market structure rewards patience and alignment with institutional footprints — positioning ahead of breakout confirmation, while respecting range extremes.Contact me to Join our group for free gold trading ideas on daily basis Watsapp Contact +971559939571
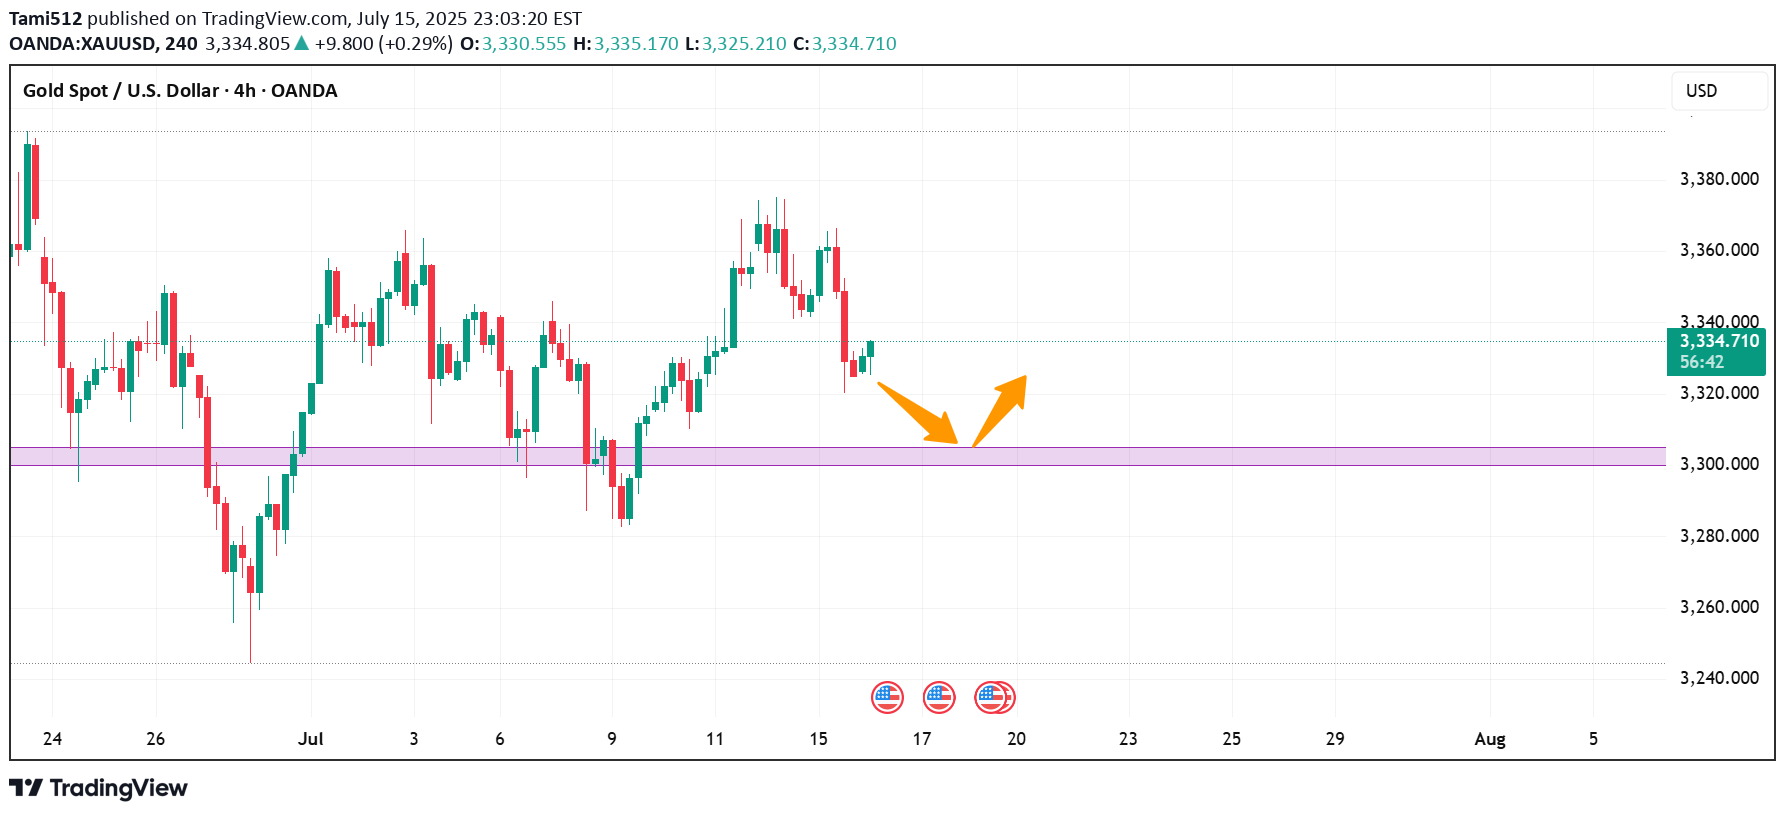
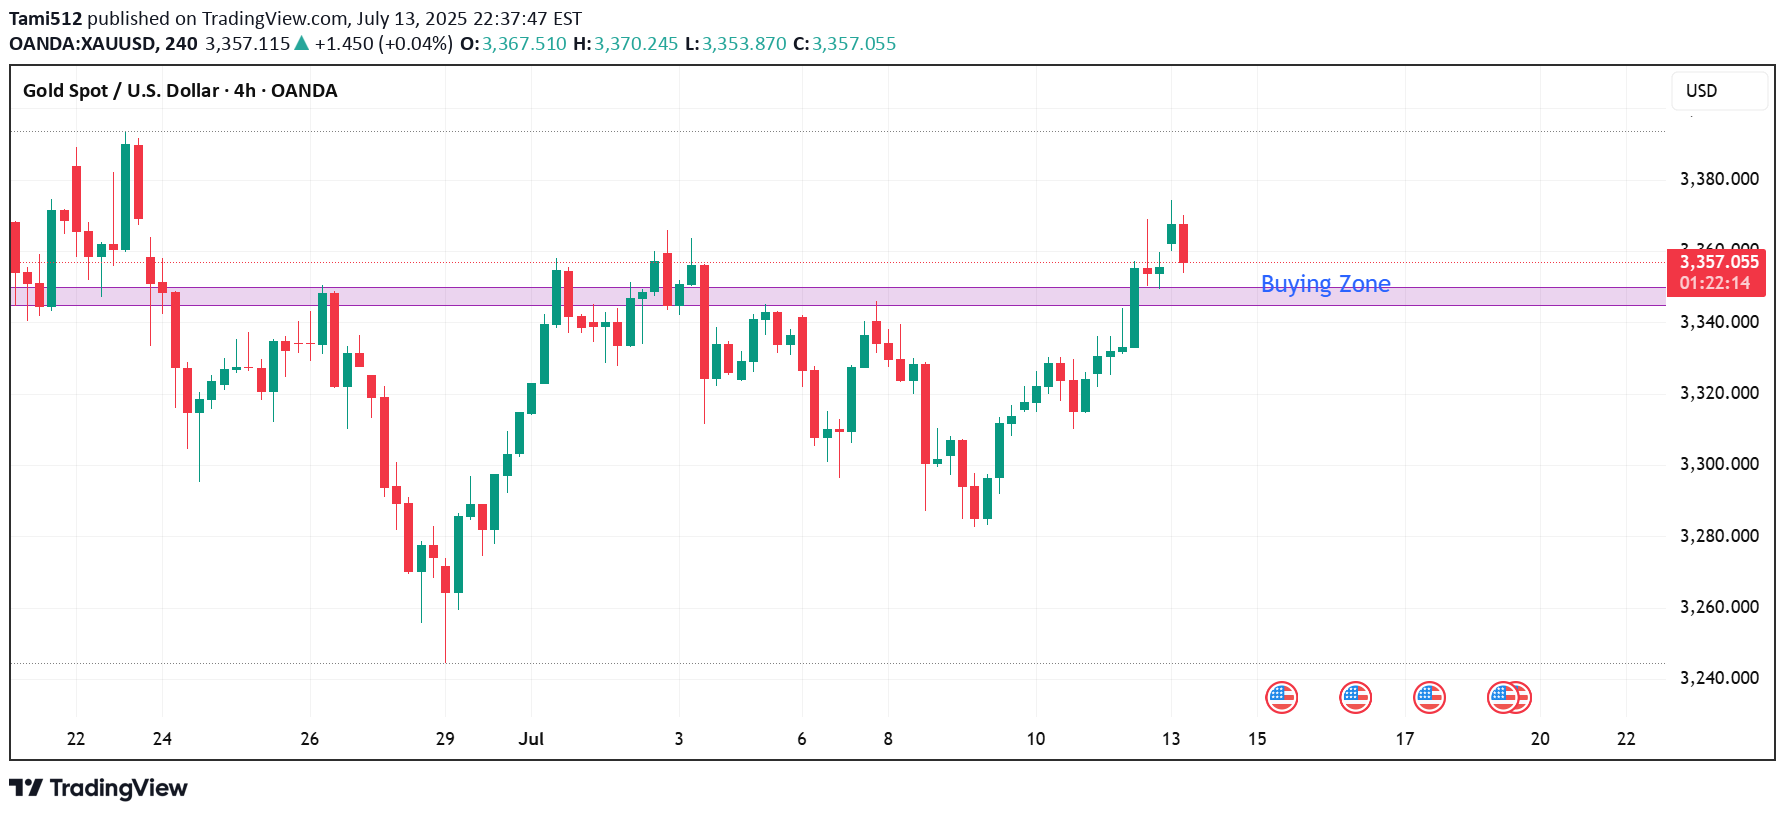
4-Hour Bias & Structural Context Gold has recently broken above a key structure level at $3,320, confirming a bullish market environment on the 4‑hour timeframe. This follows a Change of Character (CHOCH) around $3,300, signifying a shift from consolidation to an upward trend. The swing from the late-June low ($3,244) to mid-July’s high ($3,374) sets our Fibonacci context: 38.2% retrace ≈ $3,318 50% retrace ≈ $3,309 61.8% retrace ≈ $3,300 These fib levels also align with prior structure and key ICT/SMC zones, signaling strong areas of interest. 🧭 Key 4-Hour Confluence Zones Demand / Order Block → $3,300 – 3,305 Multi-method support: BOS, CHOCH, 50–61.8% fib convergence. Fair Value Gap (FVG) → $3,320 – 3,325 Volume deficient zone post-BOS, primed for a retest. Supply / Resistance Area → $3,360 – 3,370 High-timeframe supply, likely to cap further upside. 🧠 Smart Money Concepts BOS above $3,320 confirms bullish structure. CHOCH at ~$3,300 marks structure flip. Liquidity grab zones found between $3,335–3,340, validating the presence of institutional activity. Order Block at $3,300–3,305 supports buy-side interest. 📊 1-Hour Intraday Trade Setups 🔸 Setup #1 – FVG Re-Test Entry: At ~$3,325 on pullback into $3,320–3,325 zone SL: Below $3,320 TP1: $3,345, TP2: $3,360 🔸 Setup #2 – Demand OB Bounce (“Golden Setup”) Entry: In the $3,300–3,305 range SL: Below $3,298 TP1: $3,325, TP2: $3,345, TP3: $3,360 Edge: Tight risk, high confluence (SMC + fib + structure) 🌟 The Golden Setup Zone to Watch: $3,300–3,305 Why It Rates Highest: BOS, CHOCH, fib, and OB all align Offers tight stop placement and strong upside Risk-to-reward ~1:3 📌 Daily Watchlist Summary Directional Bias: Bullish (BOS above $3,320 intact) Primary Entry Zones: $3,300–3,305 (Demand OB + structure) $3,320–3,325 (FVG retest for continuation) Key Target Zones: $3,345–3,350 – realistic intraday exit $3,360–3,370 – major supply cap Invalidation Level: 4‑hour candle close below $3,298 negates bullish outlook Final Commentary Stay disciplined—only trade reactive signals at these levels: clean bounces, pinbars, or bullish engulfing patterns. The $3,300–3,305 zone stands out as the prime ‘Golden Setup’ entry.Contact me to Join our group for free gold trading ideas on daily basis Watsapp Contact +971559939571
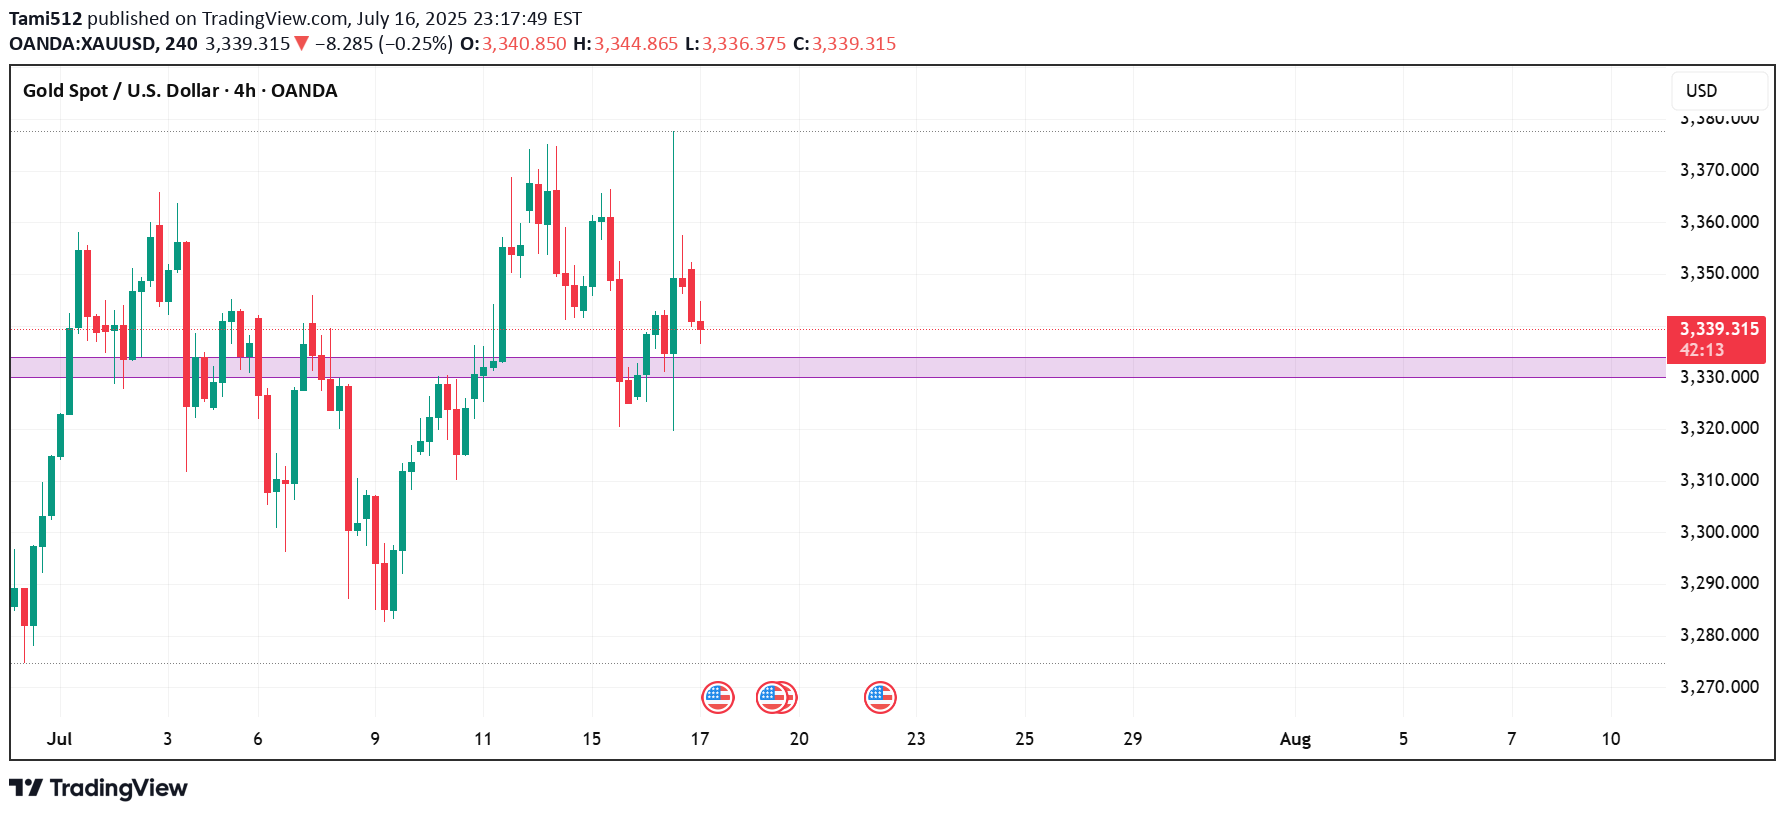
4‑Hour Technical Outlook — Bullish Bias Above Key BOS Zone Gold remains in a strong structural uptrend on the 4‑hour chart, carving out a sequence of higher highs and higher lows. Price is consolidating just below recent swing highs around $3,360, suggesting accumulation after last week’s impulsive rally. We saw a Break of Structure (BOS) above $3,340, confirming bullish control and establishing that area as a critical flip zone. Unless price closes decisively below that BOS, the directional bias remains bullish. 📐 Key Confluences & Zones on 4‑Hour 🔹 Fibonacci Retracement (Swing: $3,280 → $3,360): 38.2%: ~$3,331 — aligns perfectly with BOS & prior resistance turned support. 61.8%: ~$3,313 — deeper, but still within bullish context. 🔹 Supply & Demand Zones: Supply (Resistance): $3,355–$3,360 — recent highs, likely containing resting sell‑side liquidity. Demand (Support): $3,331–$3,335 — a bullish order block and fair value gap (imbalance) reside here. Deeper Demand: $3,313–$3,315 — secondary buy zone if the market hunts liquidity deeper. 🔹 Liquidity Profile: Buy‑side stops likely rest above $3,360 — breakout target. Sell‑side liquidity below $3,331 could trigger a shakeout before higher. 🧠 ICT/SMC Concepts Observed: ✅ BOS confirmed at $3,340, favoring longs. ✅ FVG/imbalance between $3,338–$3,342 suggests price may “fill” before next impulse. ✅ Recent wick above $3,355 hints at minor buy‑side liquidity grab — but no confirmed CHoCH (change of character) yet. ✅ Bullish order block formed at $3,331–$3,333, acting as strong support. 📈 1‑Hour Intraday Playbook — Aligned With Bullish Bias On the 1‑hour chart, momentum remains constructive above $3,331. Intraday traders can look for these setups: 1️⃣ Buy the Retest Entry: $3,335 (within 4H OB & FVG) Stop‑loss: $3,327 (below demand) Targets: 🔸 T1: $3,355 🔸 T2: $3,380 (next resistance) 2️⃣ Breakout Long Entry: Break and close above $3,360 Stop‑loss: $3,350 Targets: 🔸 T1: $3,380 🔸 T2: $3,406 (1.272 Fib ext.) 3️⃣ Deeper Pullback Buy Entry: $3,313–$3,315 (61.8% Fib + deeper demand) Stop‑loss: $3,305 Targets: back toward $3,355–$3,380 🎯 The Golden Setup: ✅ Long from $3,335, stop‑loss $3,327, targeting $3,355–$3,380. Why? This setup aligns BOS, bullish OB, FVG, 38.2% Fib, and current trend structure — highest confluence and best risk/reward ratio (~1:3). 🔎 Summary Table — Key Levels for Today 📈 Bullish ContinuationAbove $3,331 🟢 Strong Buy Zone$3,331–$3,335 🟢 Deeper Demand$3,313–$3,315 🔴 Resistance / Supply$3,355–$3,360 🚨 Bullish InvalidationBelow $3,331 Bias remains bullish as long as $3,331 holds. Look for reaction in the $3,331–$3,335 zone to join institutional flows.Contact me to Join our group for free gold trading ideas on daily basis Watsapp Contact +971559939571
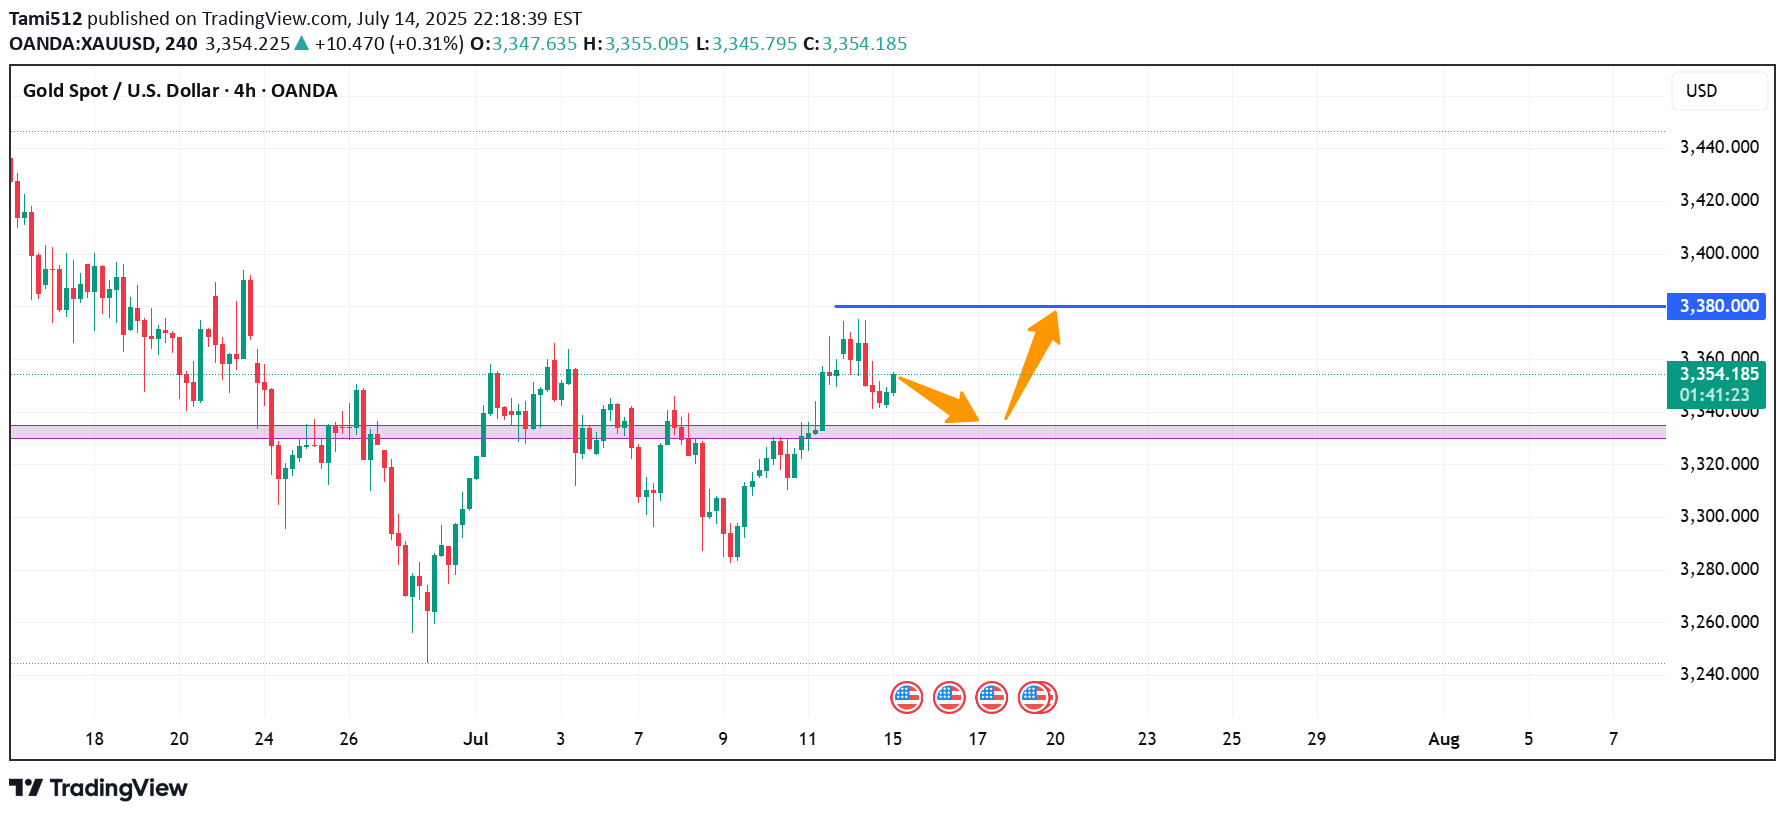
1. Price Action & Market Structure Gold has broken recent swing highs above ~$3,360, marking a bullish Break of Structure (BOS) and signaling upward momentum continuity Recent pullback zones around $3,350–$3,340 formed a clear Higher Low (Change of Character) — textbook price action confirmation. 2. Fibonacci Retracement / Extension Measuring from the last swing low near ~$3,326 to swing high ~3,374: 38.2% retracement at ~$3,352 coincides with the current bounce zone. 50% retracement at ~$3,350 aligns with key structure support. Upside extension targets: 1.272 at ~$3,396, 1.618 at ~$3,425 — overlapping major resistance zones 3. ICT & Smart Money Concepts (SMC) Order Blocks (OBs) identified near $3,340–$3,342 (prior resistance turned support) — ideal demand zone. A recent Buy-side liquidity grab eclipsed above $3,360, sweeping stops and gathering liquidity before the breakout — classic ICT setup . A Fair Value Gap (imbalance) lies around $3,345–$3,350 — zone to expect value-driven retracement. Higher timeframe has clear SMC alignment: BOS above 3,360 with CHoCH already formed. 4. Major Supply / Demand & Support / Resistance Zones Demand: $3,340–$3,352 (OB + Fib + BOS confluence). Supply: $3,380–$3,385 (intraday swing high resistance), followed by zone at $3,396–$3,400. Key resistance at $3,360–$3,362 — confirmed supply pocket that needs to be reclaimed 5. Moving Average Confirmation The 4‑hour SMA/EMA 100–200 band is sloping up just below current price (~$3,340–$3,350), reinforcing the bullish context . 1‑Hour Intraday Setups (Aligned with HTF Bullish Bias) Setup A: Pullback into 4‑Hour OB / Fair Value Gap Entry: Limit buy at $3,345–$3,350. Stop: Below $3,335 (below imbalance & BOS). TP1: $3,362 (former resistance). TP2: $3,380 (next supply block). Setup B: Breakout Retest of 3,360 Entry: Buy on retest of broken resistance at $3,360. Stop: Below $3,356. TP1: $3,380. TP2: $3,396 (Fib extension confluence). Setup C: Momentum Continuation Fresh Breakout Entry: Market buy on clear H1 BOS above $3,365. Stop: Below breakout candle low (~$3,360). TP: $3,396 (1.272 Fib) – extend to $3,425 if momentum strong. The Golden Setup: Setup A—buy from $3,345–$3,350—has strong confluences: 4‑hour demand OB + fair value gap, 38.2–50% Fib retracement, SMC BOS/imbalance alignment, ICT-style order block zone. This offers high edge with confluence clusters. ✔ Summary Report: Direction & Key Zones Directional Bias: Medium-term (4H): Bullish, confirmed by BOS above 3,360, higher lows, OB and Fibonacci alignment. 🔹 Primary Buy Zones: $3,345–$3,350 — 4H OB + fair value gap + Fib. $3,360 on retention — breakout retest zone. Momentum entry >$3,365. 🔹 Key Target Zones: First resistance: $3,360–$3,362. Next supply: $3,380–$3,385. Extension target: $3,396 (1.272 Fib), then $3,425 (1.618 Fib). 🔻 Watchdownside Risk: Daily invalidation if drop below $3,335 (4H OB break). Next support at $3,326–$3,330. 📋 Consolidated Table: Setups at a Glance SetupEntry ZoneStopTargets Golden$3,345–$3,350$3,335TP1: $3,362 / TP2: $3,380 Breakout Pullback$3,360 retest$3,356$3,380 → $3,396 Momentum BOS>$3,365 (H1 BOS)< $3,360$3,396 → $3,425 Final Thoughts On the 4‑hour chart, price is firmly in a bullish regime, supported by price structure, SMC, ICT concepts, and Fibonacci confluence. The $3,345–$3,350 zone is the highest‑probability entry for buyers, offering excellent risk/reward. The Golden Setup targets ~$3,380 and beyond, combining structure, gap fill, and liquidity strategy.Contact me to Join our group for free gold trading ideas on daily basis Watsapp Contact +971559939571
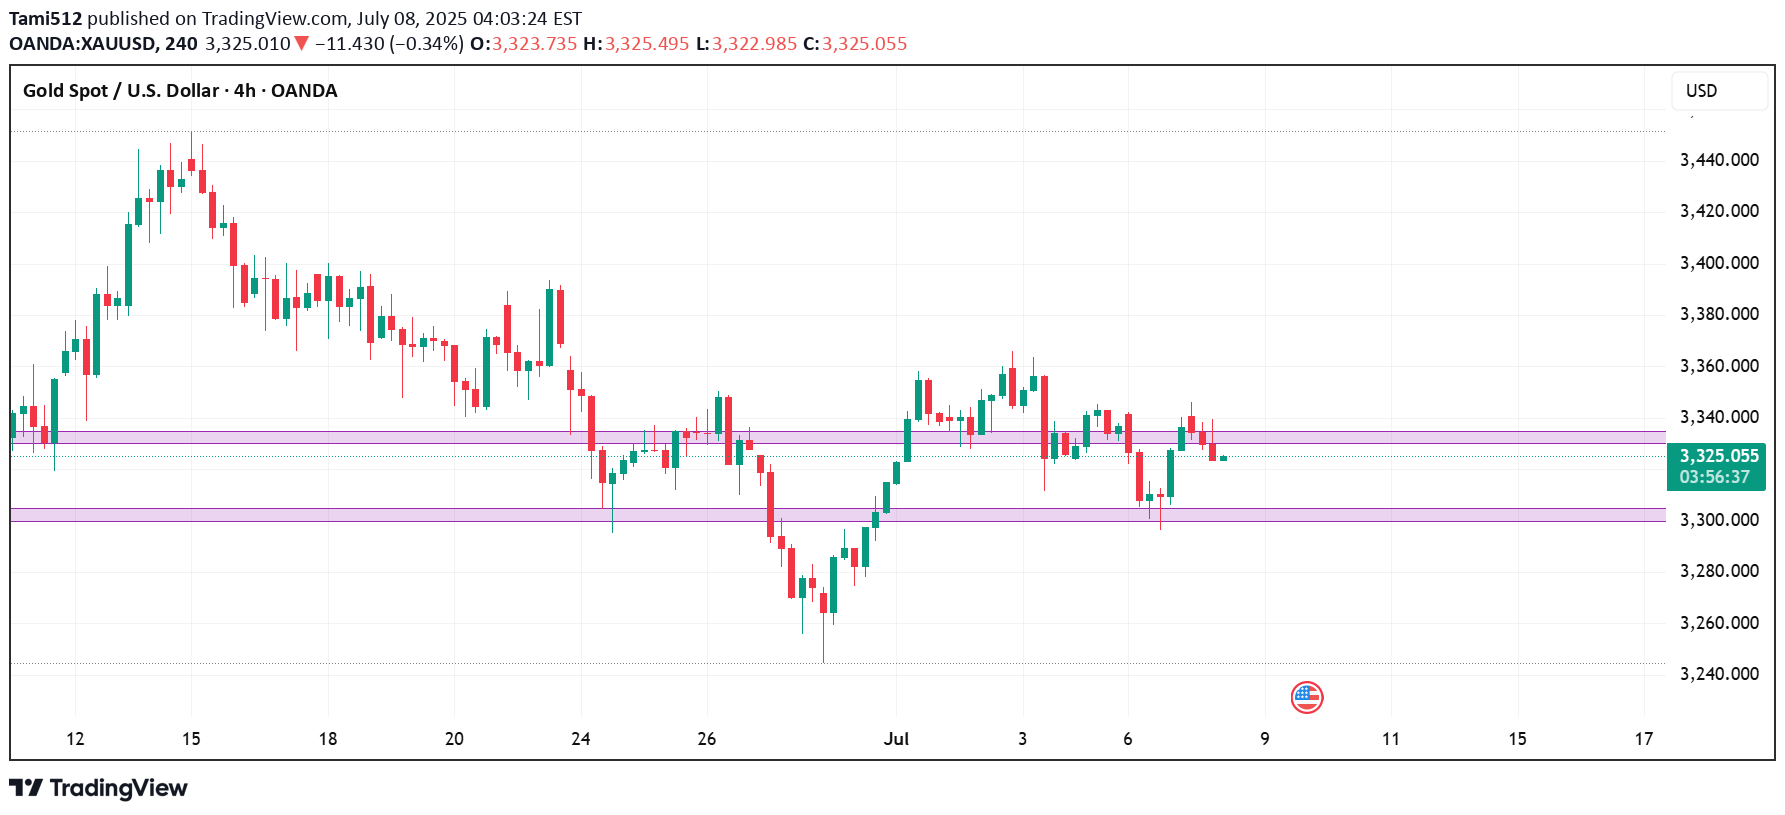
Current Price: ~$3,330Timeframe Focus: 4‑Hour and 1‑HourDirectional Bias: Neutral-to-BearishMethodologies Used:✅ Price Action, Fibonacci Levels, Support & Resistance✅ Supply & Demand Zones✅ ICT / Smart Money Concepts (BOS, CHoCH, Liquidity, OB, FVG)4‑Hour Market Structure AnalysisGold has shifted into a neutral-to-bearish regime on the 4‑hour timeframe, after a decisive Break of Structure (BOS) below prior swing lows at ~$3,345 and a clear Change of Character (CHoCH) as bulls failed to sustain above the ~$3,350 level. Price currently hovers around ~$3,330, consolidating within a bearish Fair Value Gap (FVG) left by the recent impulsive drop.Key Observations:A liquidity grab above $3,349 (stop sweep) preceded a sharp reversal, validating this as a sell-side liquidity zone.The 4H supply zone / bearish Order Block (OB) at $3,345–$3,350 remains unmitigated and likely to attract sellers.Immediate downside is cushioned by a 4H demand zone & FVG at $3,300–$3,305, which has acted as support during the prior dip.A deeper daily demand zone rests around $3,280–$3,290, which aligns with historical support and unmitigated buy‑side liquidity.Key 4‑Hour Levels to WatchPrice LevelTypeNotes$3,360–$3,365Supply / Fib 61.8%Strong resistance$3,345–$3,350Supply / OB + 50% FibPrimary sell zone$3,330–$3,334Bearish FVGActive imbalance$3,300–$3,305Demand / FVGPrimary buy zone$3,280–$3,290Demand (daily OB)Secondary buy zoneThe neutral-to-bearish bias is reinforced by the fact that price has failed to reclaim prior support and continues to respect supply zones.1‑Hour Intraday Trade IdeasZooming into the 1‑hour chart, we align intraday setups with the broader 4H directional bias: selling into supply and covering into demand.Setup 1: Short at 4H ImbalanceEntry: ~$3,332–$3,334 (inside active FVG)Stop-Loss: Above $3,335Targets:TP1: $3,305TP2: $3,280Confluences: BOS + CHoCH, 4H FVG, sell‑side liquidity above.Setup 2: Short on RetracementEntry: ~$3,345–$3,350 (50% Fib + OB)Stop-Loss: Above $3,352Targets: Same as Setup 1.Setup 3: Aggressive Long (Countertrend)Entry: ~$3,300–$3,305 (demand + FVG)Stop-Loss: Below $3,295Target: $3,327Note: Only valid if strong bullish reaction occurs in demand.The Golden SetupSell at ~$3,332–$3,334 (active 4H imbalance) with a target of $3,300.This setup offers maximum confluence — bearish FVG, BOS, and supply rejection — with tight risk parameters and favorable reward/risk ratio.Summary TableBiasLevels of InterestDirectional BiasNeutral-to-BearishStrong Sell Zones$3,330–$3,334 and $3,345–$3,350Strong Buy Zones$3,300–$3,305 and $3,280–$3,290Closing NotesGold continues to respect Smart Money footprints on the 4‑hour chart, suggesting more downside unless bulls reclaim $3,350 decisively. Today’s focus remains on short opportunities at premium levels into supply and imbalances, targeting well‑defined demand areas below.Watch price action closely in the $3,332–$3,334 zone for the highest‑probability short entry of the session — The Golden Setup.Contact me to Join our group for free gold trading ideas on daily basisWatsapp Contact +971559939571
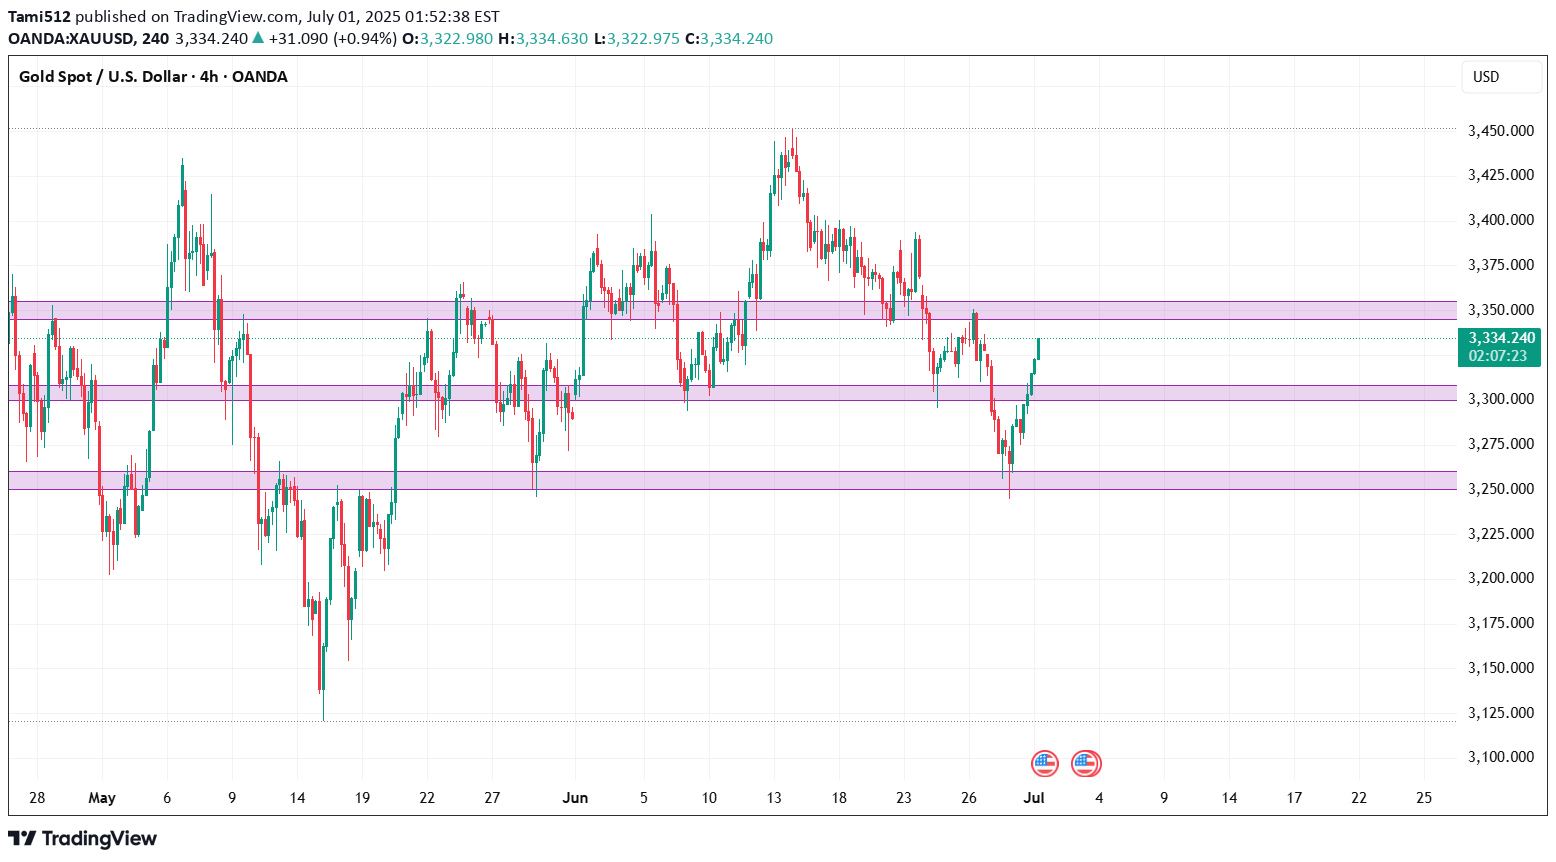
In the world of financial markets, few assets capture global attention like gold. A timeless store of value, gold continues to act as both a hedge against uncertainty and a battleground for technical traders seeking high-probability setups. As of today, gold (XAU/USD) is trading at $3328, a level that places it just beneath the most recent multi-month high at $3345. The recent surge in price is underpinned by both macroeconomic factors and bullish technical structure. However, as any seasoned trader knows, trends rarely move in straight lines — and gold is now approaching a technically sensitive juncture.I. Gold’s Structural Landscape on the 4-Hour ChartThe four-hour chart reveals a textbook bullish trend. Beginning with a significant impulse from the $3194 base, gold has climbed steadily, printing higher highs and higher lows. The most recent break of structure (BOS) above $3312 confirmed the continuation of bullish intent, while the market remains firmly above key swing lows — signaling that the bullish regime has not yet been invalidated.Price action shows clean, impulsive expansions followed by short consolidations, with buyers continuing to absorb supply at every retracement. Despite that strength, gold has now reached a potential exhaustion point, with the price reacting to overhead supply at $3345–3355, forming what could be an early-stage distribution zone.Key Market Structure Developments:BOS at $3312: confirms uptrendNo CHoCH (Change of Character) yet — no confirmed bearish reversalClean liquidity grab above $3345, followed by rejection — hinting at short-term profit-taking or internal bearish intentII. The Fibonacci Grid: Retracement and Extension ZonesApplying Fibonacci retracement from the $3194 swing low to the $3345 high offers crucial levels of interest. The golden ratio at 61.8% ($3253) aligns perfectly with prior demand and a 4-hour bullish order block. Similarly, the 38.2% level at $3285 corresponds with a minor liquidity pool and potential reaccumulation base.Fibonacci LevelPrice23.6%$330838.2%$328550.0%$326961.8%$325378.6%$3228On the extension side, should gold resume its rally beyond $3345, projected Fibonacci targets sit at $3372 (127.2%) and $3410 (161.8%), with both acting as measured projections for trend continuation.III. Supply and Demand: Mapping Institutional FootprintsInstitutional activity is best observed through unmitigated supply and demand zones — areas where large orders caused rapid price displacement. Gold currently trades between two such zones:Demand Zone: $3250–$3260 — a sharp bullish rejection occurred here on the last visit, indicating strong buy-side interest and likely pending buy ordersSupply Zone: $3345–$3355 — where a sell-side liquidity grab recently occurred, followed by a strong rejection candleThese two zones bracket the market and serve as the highest probability areas for future reactions.IV. The Smart Money Concepts (SMC) FrameworkSMC theory revolves around observing the footprints of large market participants — often labeled “smart money.” In gold’s current structure, SMC tools provide a clearer roadmap than standard indicators.Current Observations:Break of Structure (BOS): Confirmed at $3312 (bullish continuation)Change of Character (CHoCH): Absent (bull trend intact)Buy-Side Liquidity Grab: Above $3345 — trapped breakout buyers likely fuel for reversalSell-Side Liquidity Pool: Uncollected beneath $3280 — probable magnet for a liquidity sweepFair Value Gap (FVG): Between $3260 and $3280 — price inefficiency offering high-probability reentry for smart moneyBullish Order Block (OB): At $3250–$3260 — final down candle before explosive up move, unmitigatedAll these elements point to a high-probability pullback, rather than a full-blown reversal. Until structure is broken with a CHoCH, the base case remains bullish.V. High-Probability Levels for 4-Hour-Based OpportunitiesFrom this framework, we identify the following key price levels:The highest-probability reaction is expected at $3250–$3260, where smart money is likely to re-engage if price retraces.VI. Refinement on the 1-Hour Chart: Intraday Trade SetupsZooming into the 1-hour chart allows us to fine-tune our execution strategy. Gold is consolidating just below $3330, forming what appears to be an ascending triangle — a common bullish continuation structure — but within the broader context of a possible short-term pullback.Intraday Trade Idea #1 — High-Conviction LongEntry: $3260Stop-Loss: $3245Take-Profit 1: $3308Take-Profit 2: $3340Risk–Reward: ~1:4Rationale: Aligned with 4H demand, fair value gap, OB, and golden ratio retracement. Structure remains bullish.Intraday Trade Idea #2 — Speculative Short (Low Conviction)Entry: $3340–$3350Stop-Loss: $3362TP1: $3305TP2: $3285Risk–Reward: ~1:2.5Rationale: Countertrend, only viable if bearish rejection candle forms. Not aligned with dominant 4H structure.VII. The Golden Setup: Long from Demand + FVG ConfluenceAmong all technical configurations, the long setup at $3260 emerges as the most compelling. It is supported by:An unmitigated bullish order blockA clear fair value gap61.8% Fibonacci retracementUntouched sell-side liquidity belowDirectional alignment with trendInstitutional demand patternThis setup offers both superior risk-to-reward and a technical foundation that aligns with Smart Money’s modus operandi. It represents a low-risk, high-reward opportunity for traders who wait for price to re-enter the value zone and confirm with bullish order flow (e.g., a bullish engulfing or BOS on 15m).VIII. Final Thoughts and Tactical SummaryAs of July 1, 2025, the gold market reflects strong bullish momentum, albeit entering a corrective phase that should not be mistaken for reversal. While intraday volatility and range compression may tempt countertrend trades, the smartest play remains to wait for a discounted reentry into a zone of value.Until structure shifts significantly, the dominant trading thesis remains: “Buy the dip into institutional zones”. Patience, not aggression, will separate the retail trader from the professional in today’s complex market structure.
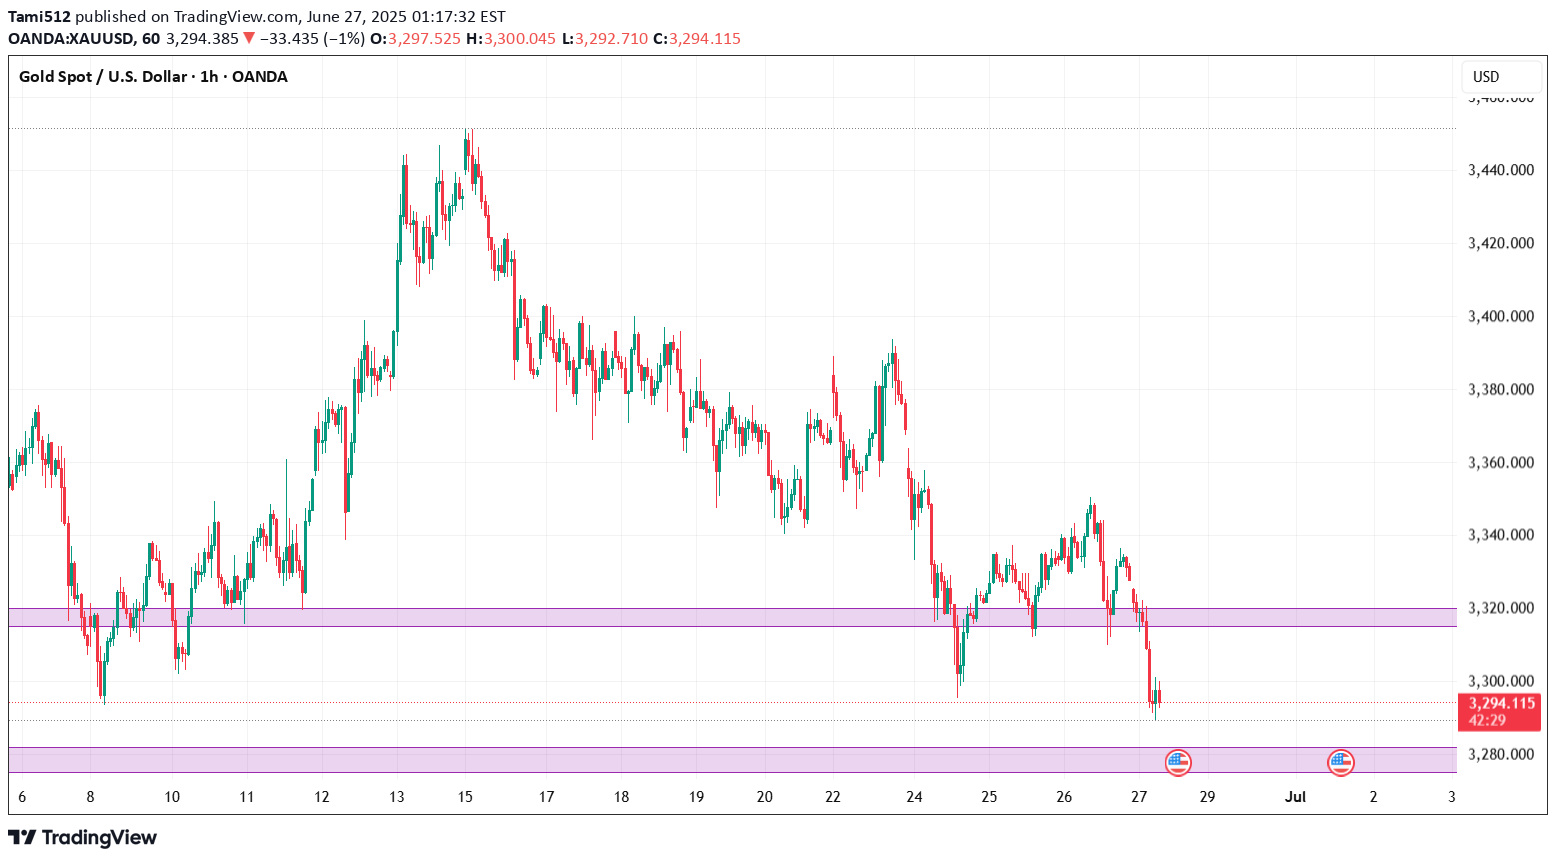
4-HOUR TIMEFRAME – HIGHER TIMEFRAME BIASGold continues to trade near its all-time highs, consolidating just below a recent swing high of $3,315. Despite minor pullbacks, the macro trend remains bullish, with bullish structure still intact. Recent price action shows shallow retracements and strong rejections of key fib levels, a typical sign of underlying smart money accumulation.Price Action & Market StructureGold recently printed a Break of Structure (BOS) at $3,290, followed by a retest of the broken level.We observed a Change of Character (CHoCH) near $3,300, quickly invalidated by bullish strength – further confirming accumulation behavior.Market remains in bullish alignment unless $3,250 is broken decisively.Key Support & Resistance ZonesResistance $3,315–$3,320Demand$3,275–$3,282Support$3,250Targets$3,340 / $3,355Smart Money Concepts (SMC)Liquidity Grab beneath $3,275 likely triggered retail stop hunts4H Bullish Order Block between $3,275–$3,282 remains unmitigatedImbalance Zone: $3,283–$3,289 – price may wick into this before launchSell-side liquidity taken below $3,275 → bullish reactionBuy-side liquidity sits above $3,315 → likely short-term magnetZOOMING INTO 1-HOUR CHART – INTRADAY SETUPSThe 1-hour chart aligns with the bullish higher-timeframe bias, offering two potential premium-level setups:Setup #1: Bullish Rejection from 4H OBEntry Zone: $3,275–$3,282This setup targets a liquidity sweep beneath $3,275 followed by bullish mitigation of a clean order block and imbalance zone. Confluence across fibs, OB, and structure support increases probability.Setup #2: Breakout Retest PlayTrigger: Clean breakout and retest of $3,315Entry: On successful retest (bullish confirmation candle)Ideal if momentum pushes through local resistance, clearing buy-side liquidity. Reclaim of structure suggests smart money continuation.Bearish Contingency (Low Probability for Now)If price breaks below $3,250 and confirms below structure:Look to short on retests into $3,275Target next demand around $3,235Until that happens, bullish bias remains dominant.Gold remains one of the most structured and responsive instruments to smart money technicals right now. A well-planned entry around demand, imbalance, or breakout levels provides excellent RRR potential if structure holds.Contact me to Join our group for free gold trading ideas on daily basisWatsapp Contact +971559939571
Gold (XAU/USD) is pushing into fresh highs around $3337, and we may be approaching a key inflection point. But beneath the surface of candles and wicks lies the real story — one written by liquidity, displacement, and smart money positioning.This outlook breaks down gold’s price action using Smart Money Concepts (SMC), price structure, and Fibonacci confluence, to help identify the most probable high-value trade zones for both swing and intraday traders.4H Outlook – Institutional Flow & StructureMarket StructureGold recently broke above the $3310–$3320 resistance, confirming a bullish Break of Structure (BOS). This keeps the market in a sequence of higher highs and higher lows, validating continued bullish pressure.Smart Money InsightsBOS: Clean break above $3320 signals strength.CHoCH: None yet — trend remains bullish.Liquidity Sweep: Sell stops below $3295 have already been taken.Buy-Side Liquidity: Sits above $3350 — price may gravitate there next.FVG: Unfilled Fair Value Gap between $3314–$3322 — possible retracement zone.Bullish OB: Identified between $3300–$3310, aligned with FVG and BOS level.Equilibrium: Using $3275 (swing low) and $3342 (swing high), the midpoint sits near $3308, acting as fair re-entry value.Key ZonesBuy Zone (Demand): $3295–$3310 — OB + FVG + Fib confluence.Sell Zone (Supply): $3350–$3360 — next likely liquidity target.Bias SummaryAs long as price remains above $3295, the bullish structure stays valid. Watch for a retracement into $3308–$3316 for potential continuation toward $3350–$3360. Price may briefly dip below $3310 to trigger liquidity before moving higher.1H View – Precision EntriesStructureFollowing the high at $3342, price has pulled back slightly and is forming what appears to be a bullish flag — often a continuation pattern.Smart Money Zones (1H)FVG: $3315–$3322 — potential short-term reaction zone.Order Block: $3305–$3312 — 1H bullish OB aligned with 4H bias.Sell-side Liquidity: Swept at $3295 earlier this week — supports continuation.Trade SetupsLong Setup #1 – Optimal EntryEntry: $3308–$3315Stop: Below $3295TP: $3342 (partial), $3350–$3360 (full)Why: Strong zone combining FVG, OB, and Fib support.Long Setup #2 – Aggressive EntryEntry: $3316–$3320Stop: $3300TP: $3340–$3350Why: Quicker entry inside the imbalance — riskier but valid.Short Setup – Countertrend (Low Conviction)Only valid on a clear break below $3310 + CHoCHEntry: Below $3310 (confirmed)Target: $3295Note: Lower confidence unless 1H structure turns bearish.Final NotesThe bias remains bullish above $3301–$3308. This is a high-probability area to look for long setups on retracement. Avoid shorts unless we see a confirmed structural shift with a CHoCH and OB breakdown.Expect the market to potentially hunt stops below $3310, then aim for liquidity sitting above $3350–$3360.Contact me to Join our group for free gold trading ideas on daily basisWatsapp Contact +971559939571
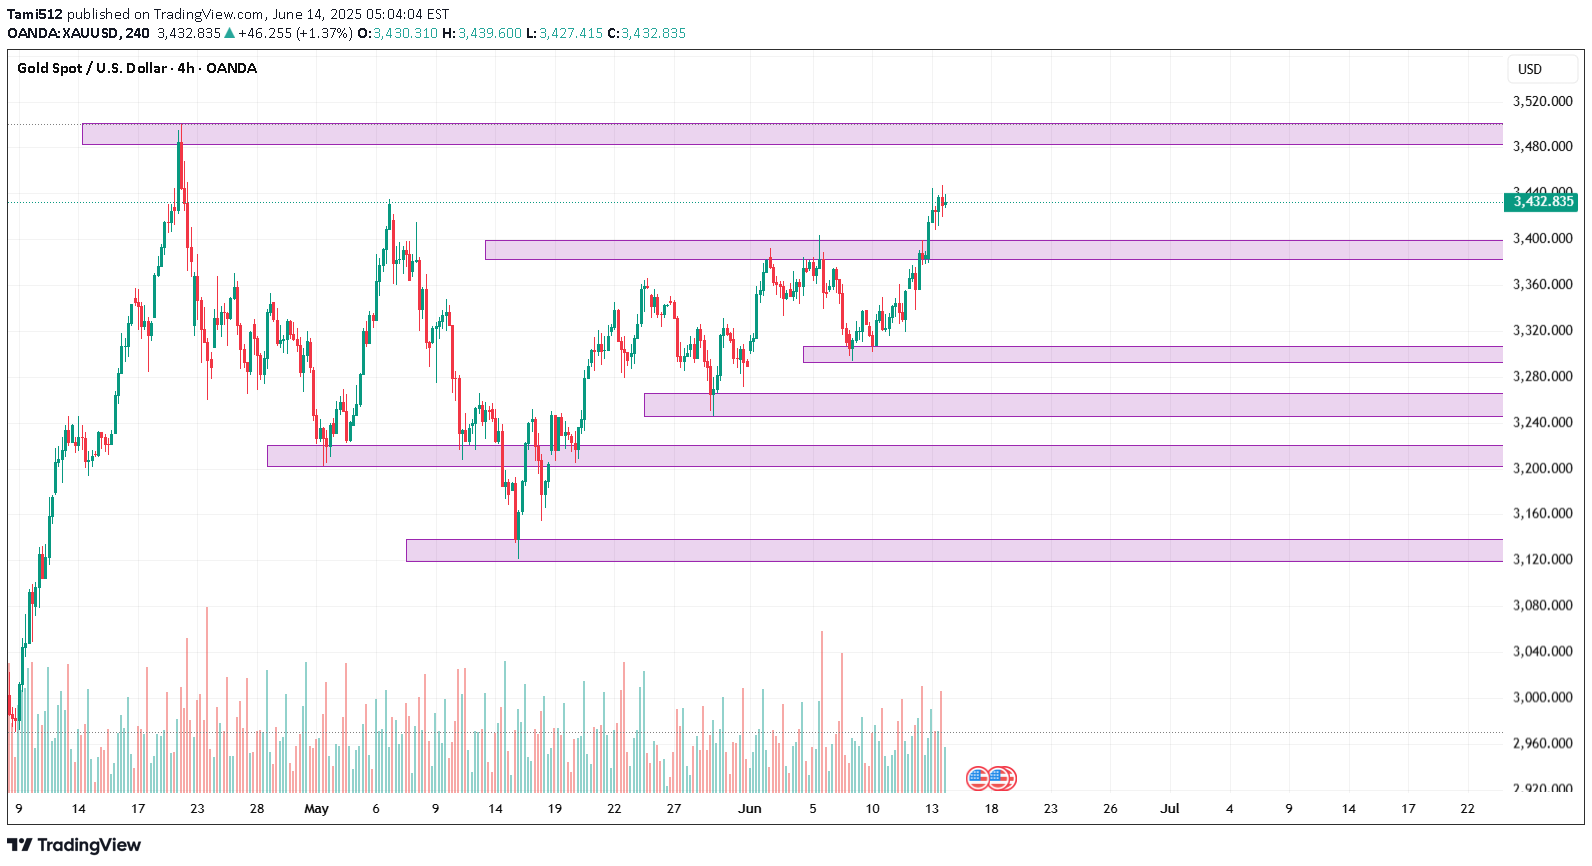
4-Hour Analysis: The Bigger PicturePrice Action & Market StructureCurrent price is at $3432.835.The market has printed a higher high above the previous swing at ~$3425.Last Break of Structure (BOS): Occurred to the upside at ~$3412.Recent CHoCH (Change of Character): None yet to the downside—bullish structure still intact.Conclusion: Bullish Market Structure is dominant.Fibonacci LevelsMeasured from the swing low at $3362 to the recent swing high at $3437:38.2% retracement: ~$341050% retracement: ~$339961.8% retracement: ~$3388These are our retracement zones where demand is likely to step in.Smart Money Key ConceptsImbalance: Clean imbalance exists between $3408–$3415.Bullish Order Block (OB): 4H candle at $3394–$3402Liquidity Grab: Sweep below $3411 (old low) before reversal signals smart money accumulation.Premium/Discount Zone: Current price is above 50% of last impulse → In premium zone (better to look for sells here until retracement).Key Zones (Interaction Points)Buy Zone Cluster (Discount Price)Zone A (OB + 61.8% + Liquidity Pool) → $3385–$3402Zone B (Imbalance + Fib 50%) → $3408–$3415Sell Zone Cluster (Premium Price) – for retracementsZone C (Last Supply + Swing Highs) → $3437–$3445Zone D (Rejection Block + Liquidity Above) → $3455–$34624-Hour Bias: BullishWe are in a bullish continuation phase. Ideal trades are buys from demand zones, aiming for new highs or liquidity sweeps above swing points.Zoom-In: 1-Hour Chart – Trade SetupsSetup 1: Buy from Demand + OB ReactionEntry Zone: $3394–$3402Direction: BuyStop-Loss: $3384Take Profit 1: $3430Take Profit 2: $3445Trigger Condition: Bullish engulfing or bullish BOS on 15-min chart after liquidity grab into the zone.Reason: Overlap of OB, 61.8% fib, and clean liquidity pool below $3400.Setup 2: Buy from Imbalance TapEntry Zone: $3408–$3415Direction: BuyStop-Loss: $3398Take Profit 1: $3432Take Profit 2: $3440Trigger Condition: CHoCH on 15m with FVG fill (imbalance closes with bullish follow-through).Reason: Bullish continuation with low-risk entry within imbalance zone and close to 50% fib retracement.Setup 3: Short from Supply Zone for RetracementEntry Zone: $3455–$3462Direction: SellStop-Loss: $3472Take Profit 1: $3432Take Profit 2: $3415Trigger Condition: Bearish engulfing or 1H CHoCH inside the zone.Reason: Price likely to grab liquidity above highs before retracing; this is a countertrend scalp within premium pricing.Final Takeaway:“Stay bullish on Gold while it’s above $3394—but let price correct into demand before looking to join the trend.”Contact me to Join our group for free gold trading ideas on daily basisWatsapp Contact +971559939571
Disclaimer
Any content and materials included in Sahmeto's website and official communication channels are a compilation of personal opinions and analyses and are not binding. They do not constitute any recommendation for buying, selling, entering or exiting the stock market and cryptocurrency market. Also, all news and analyses included in the website and channels are merely republished information from official and unofficial domestic and foreign sources, and it is obvious that users of the said content are responsible for following up and ensuring the authenticity and accuracy of the materials. Therefore, while disclaiming responsibility, it is declared that the responsibility for any decision-making, action, and potential profit and loss in the capital market and cryptocurrency market lies with the trader.