Technical analysis by Aria-Margot-Fx about Symbol PAXG: Buy recommendation (6/27/2025)

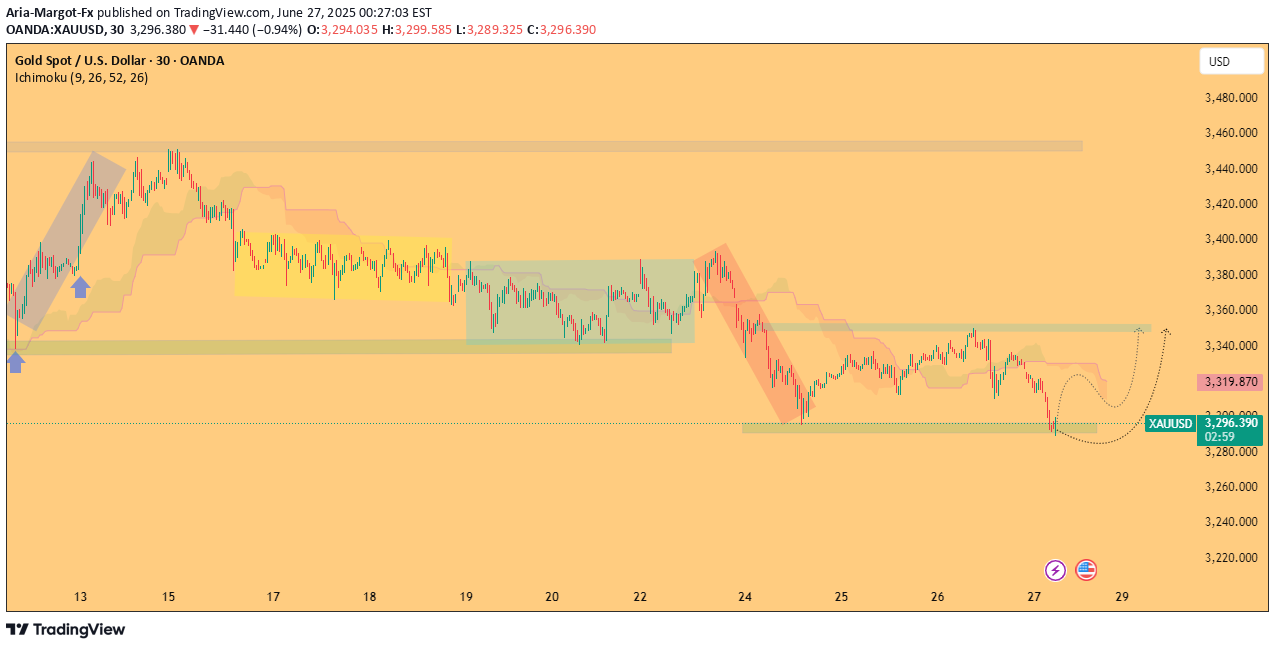
🔍 Market Context:Gold (XAU/USD) has recently revisited a historical demand zone around the $3,288–$3,295 level — an area that previously triggered strong bullish moves (see arrows on left structure). This zone has consistently acted as a bullish inflection point, with high-probability reversals following prior visits.📊 Technical Analysis Breakdown:Previous Rally (Left Side):The strong impulsive move from this zone (marked by blue arrows) laid the foundation for the bullish bias, further confirmed by the breakout rally.Mid-Chart Consolidation (Yellow/Green Zones):A large period of range-bound consolidation followed the rally, suggesting accumulation or distribution. Breakout from this structure eventually led to a significant bearish correction (red channel).Current Structure (Right Side):Price has once again reached the critical support, where we observe:A possible double-bottom or sweep of liquidity below the previous lows.Bullish divergence (if confirmed on lower TF indicators such as RSI or MACD).A projected recovery path toward the $3,360 zone (highlighted in green).⚠ Bearish Scenario to Watch: A clean break and close below $3,288 with volume could invalidate the bullish thesis and expose the next downside targets toward the $3,240 and $3,220 levels. Always manage risk accordingly.---🧭 Why This Setup Matters:This chart isn’t just about a potential bounce — it’s about understanding market psychology at a key demand zone. If bulls defend this area again, it reinforces the narrative of smart money accumulation. If not, it could be the early stages of a much deeper correction.---🎯 Trade Setup (Example, Not Financial Advice):Entry Idea: Wait for bullish confirmation via 15m–1h candle closure above $3,305Stop-Loss: Below $3,280Target 1: $3,340Target 2: $3,360---✅ Tips to Further Improve Your TradingView Post:📌 Use annotated labels directly on your chart (e.g., “Demand Zone,” “Liquidity Sweep,” “Range Breakout”).📈 Add RSI or MACD indicators if you mention divergence — this supports your logic.💬 End your post with a question to engage readers:“Will Gold hold the line again — or is this just a bull trap before deeper downside?”---🧱 SummaryThis post shows:Depth: Explains price behavior and structure shifts.Clarity: Uses clean, jargon-free language with trader-relevant terms.Originality: Connects structure, psychology, and tactical planning.Engagement: Encourages readers to interact and think critically.
