Technical analysis by Johnson67 about Symbol BTC: Buy recommendation (6/16/2025)

Johnson67
BTC/USD Likely a bullish order block or accumulation zone.
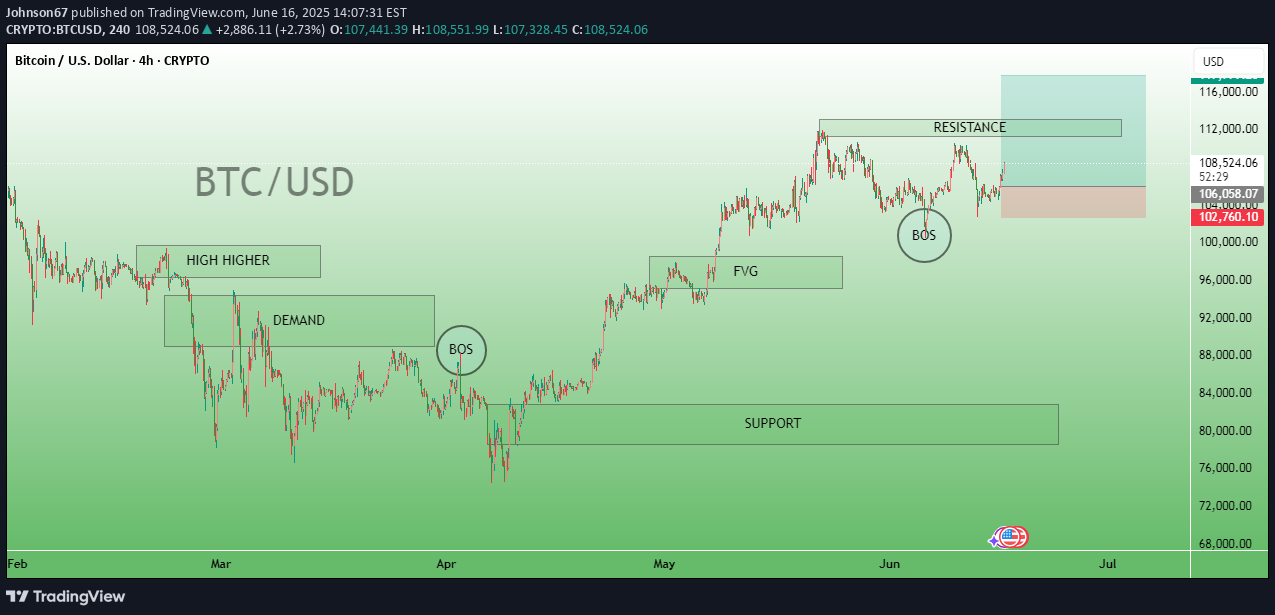
Price Action: The market is in a downward correction after hitting a resistance area.---📊 Key Marked Zones and Concepts1. High Higher (Left Side):Indicates previous higher high formed in an uptrend structure.2. Demand Zone (Below High):Area where buyers previously stepped in strongly.Likely a bullish order block or accumulation zone.3. BOS (Break of Structure):Two BOS points are marked, confirming market structure breaks:Left BOS: Marks transition from uptrend to a possible downtrend.Right BOS: Confirms shift again or continuation of downward correction.4. FVG (Fair Value Gap):Indicates an imbalance in price action.Price may revisit this zone to "fill the gap."5. Resistance (Top Right):Price reached this level and is rejecting downward.Could be a short-entry zone, as indicated by the red-to-green risk box (risk-to-reward trade setup).6. Support (Bottom):A larger green support block exists far below current price (~$91,000–$82,000).Possibly a target area for longer-term bears.---🎯 Trade Setup VisibleShort Position Active:Entry near resistance zone (~108K–110K).Stop-loss above resistance (~115K).Take-profit near $102,760 or lower, aligned with BOS and demand area.---🧠 InterpretationThis analysis shows that:The trader expects BTC to drop from the resistance zone.The bearish BOS and FVG support a retracement or reversal.Targeting a deeper correction toward support or earlier demand zones.