Technical analysis by XAUUSD_MASTER003 about Symbol PAXG: Sell recommendation (6/16/2025)

XAUUSD_MASTER003
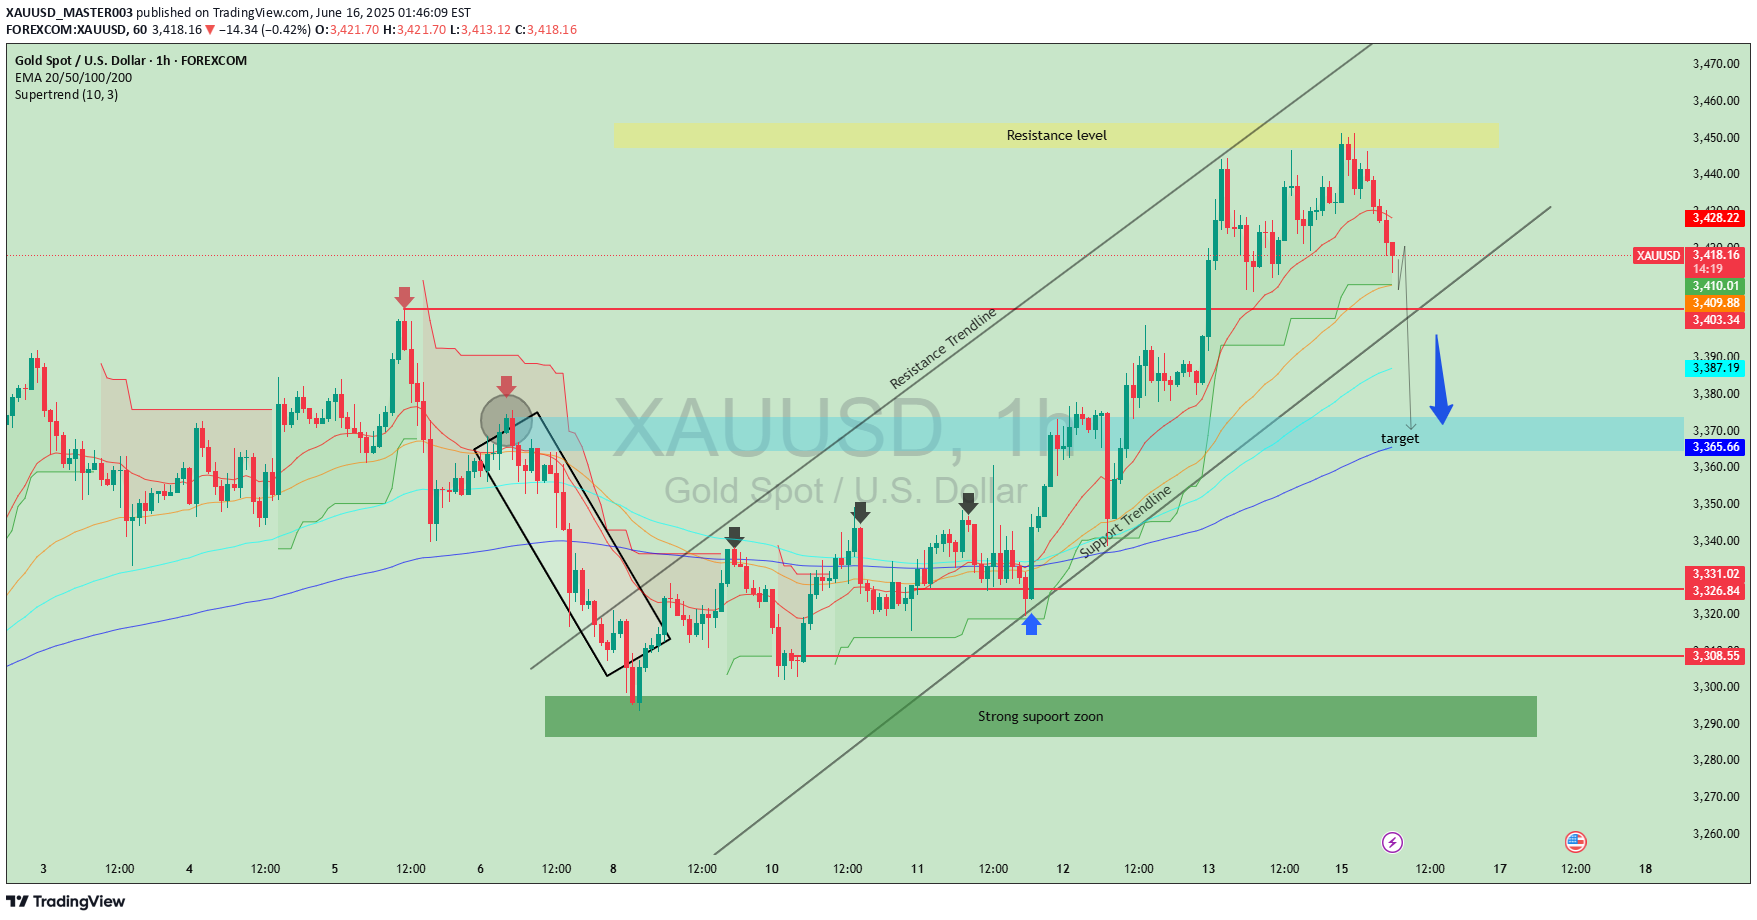
This chart is an XAUUSD (Gold vs. US Dollar) technical analysis on the 1-hour timeframe, showing price movements and potential future scenarios based on various technical indicators and chart patterns.Here’s a breakdown and explanation:🔍 Key Chart Elements:Resistance Level (Yellow Box at Top):The price recently hit this resistance area (~$3,455–$3,460) and got rejected, indicating strong selling pressure.Support Zone (Green Box at Bottom):A strong support zone around $3,290–$3,310 where buyers previously entered the market aggressively.Trendlines:Support Trendline (lower black line): Shows the rising trend that has recently been broken.Resistance Trendline (upper black line): Marks the upper boundary of the previous ascending channel.Target Zone (Blue Box):Marked as the next target area around $3,366, near the 200 EMA. This suggests the analyst expects the price to drop toward this zone.Indicators:EMA Lines (20/50/100/200): Show current momentum and possible support/resistance. The price is above most of them but appears to be heading toward the 200 EMA.Supertrend (green/red clouds): Switched to bearish, signaling a potential sell setup.Candlestick Patterns:Recent bearish candles indicate selling pressure after hitting resistance.Red arrows show previous rejection points confirming the resistance.Blue Arrow:Suggests the forecasted price direction: a potential drop toward the blue target zone.📈 Summary / Interpretation:Current Bias: Bearish in the short term.Why: Price was rejected at a resistance zone, broke below the support trendline, and is now heading down.Target: Around $3,366, aligned with previous support and the 200 EMA.Potential Reaction Zone: Watch the blue zone for a bounce or further breakdown.💡 Trading Insight:Bearish Setup: Short opportunities may be valid below the broken trendline, targeting $3,366.Invalidation: If price climbs back above $3,428 (near resistance), the bearish view may be invalid.Would you like an updated outlook based on live price data or a longer-term forecast too?Target at the support zone around 3,373 was successfully hit after price rejected from resistance near 3,450 and followed a downward trend. Trade played out as expected, respecting both resistance and trendline structures.Setup: Price formed a double top near the resistance zone (~3,450) and respected the descending trendline.Entry: Initiated short position after bearish rejection with confirmation from Supertrend and EMA alignment.Target: Support zone around 3,373 marked as target.Result: Target successfully achieved as price followed bearish structure.Key Levels:Resistance: ~3,450Target/Support: ~3,373Tools Used: EMA 20/50/100/200, Supertrend, Trendlines, Price ActionConclusion: Well-executed short trade respecting technical structure and confirmation signals.
