
XAUUSD_MASTER003
@t_XAUUSD_MASTER003

What symbols does the trader recommend buying?
Purchase History
پیام های تریدر
Filter
Signal Type
XAUUSD_MASTER003
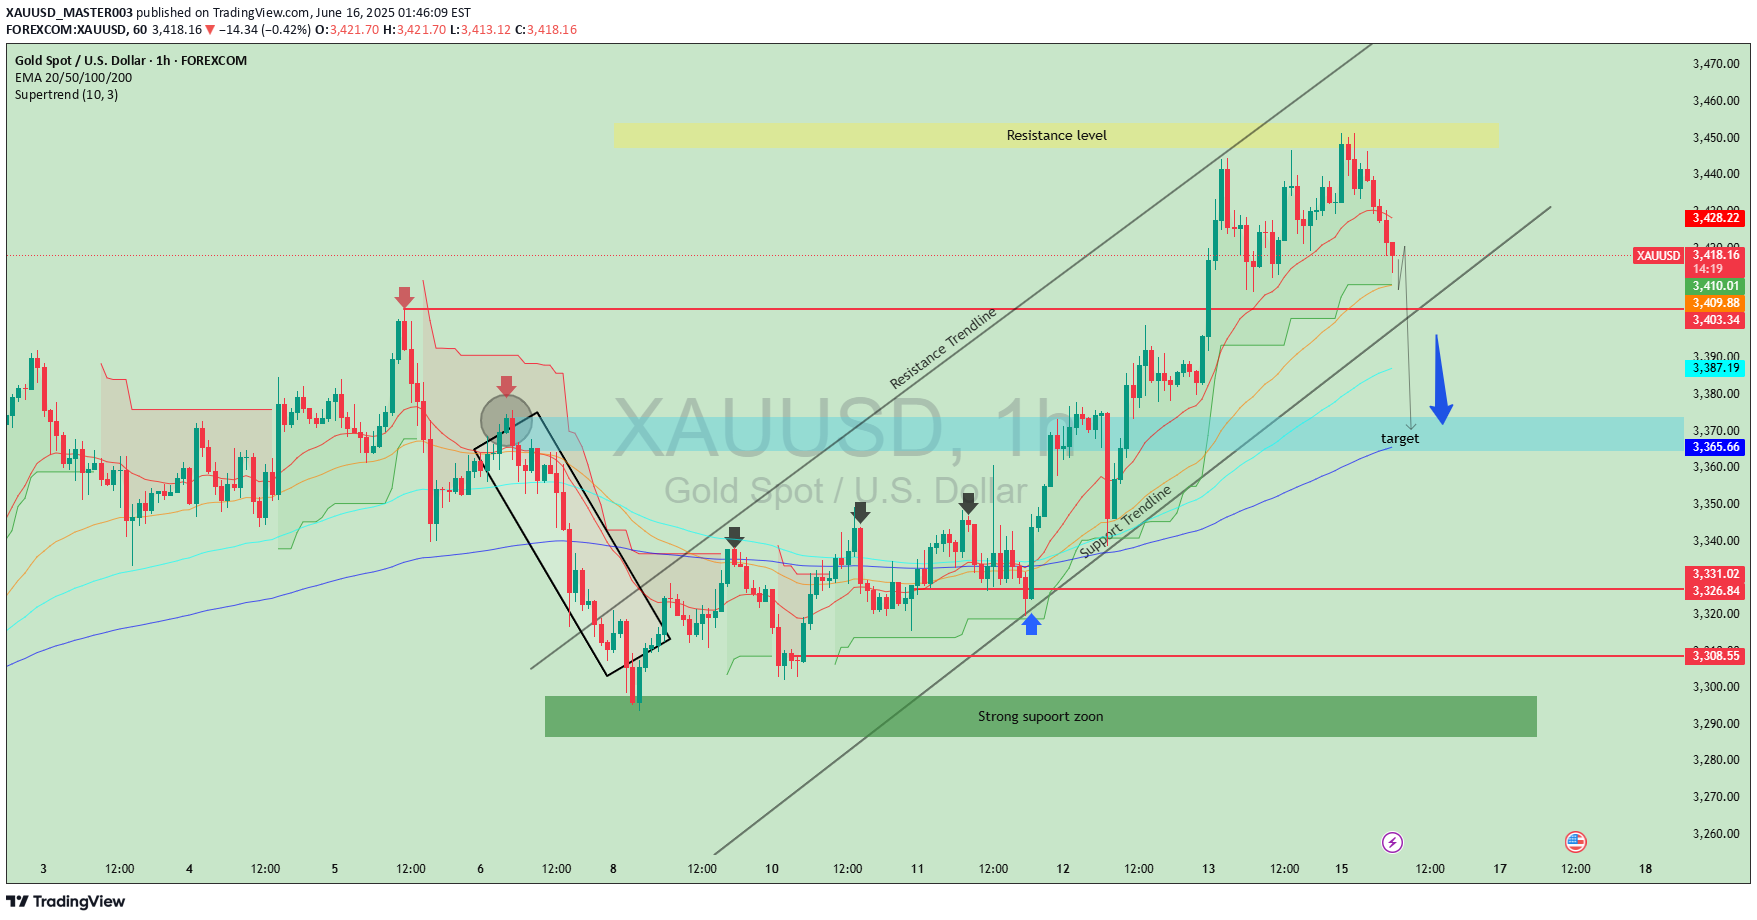
This chart is an XAUUSD (Gold vs. US Dollar) technical analysis on the 1-hour timeframe, showing price movements and potential future scenarios based on various technical indicators and chart patterns.Here’s a breakdown and explanation:🔍 Key Chart Elements:Resistance Level (Yellow Box at Top):The price recently hit this resistance area (~$3,455–$3,460) and got rejected, indicating strong selling pressure.Support Zone (Green Box at Bottom):A strong support zone around $3,290–$3,310 where buyers previously entered the market aggressively.Trendlines:Support Trendline (lower black line): Shows the rising trend that has recently been broken.Resistance Trendline (upper black line): Marks the upper boundary of the previous ascending channel.Target Zone (Blue Box):Marked as the next target area around $3,366, near the 200 EMA. This suggests the analyst expects the price to drop toward this zone.Indicators:EMA Lines (20/50/100/200): Show current momentum and possible support/resistance. The price is above most of them but appears to be heading toward the 200 EMA.Supertrend (green/red clouds): Switched to bearish, signaling a potential sell setup.Candlestick Patterns:Recent bearish candles indicate selling pressure after hitting resistance.Red arrows show previous rejection points confirming the resistance.Blue Arrow:Suggests the forecasted price direction: a potential drop toward the blue target zone.📈 Summary / Interpretation:Current Bias: Bearish in the short term.Why: Price was rejected at a resistance zone, broke below the support trendline, and is now heading down.Target: Around $3,366, aligned with previous support and the 200 EMA.Potential Reaction Zone: Watch the blue zone for a bounce or further breakdown.💡 Trading Insight:Bearish Setup: Short opportunities may be valid below the broken trendline, targeting $3,366.Invalidation: If price climbs back above $3,428 (near resistance), the bearish view may be invalid.Would you like an updated outlook based on live price data or a longer-term forecast too?Target at the support zone around 3,373 was successfully hit after price rejected from resistance near 3,450 and followed a downward trend. Trade played out as expected, respecting both resistance and trendline structures.Setup: Price formed a double top near the resistance zone (~3,450) and respected the descending trendline.Entry: Initiated short position after bearish rejection with confirmation from Supertrend and EMA alignment.Target: Support zone around 3,373 marked as target.Result: Target successfully achieved as price followed bearish structure.Key Levels:Resistance: ~3,450Target/Support: ~3,373Tools Used: EMA 20/50/100/200, Supertrend, Trendlines, Price ActionConclusion: Well-executed short trade respecting technical structure and confirmation signals.
XAUUSD_MASTER003

This chart represents a technical analysis of the price action for XAU/USD (Gold Spot vs. U.S. Dollar) on the 1-hour timeframe. Here’s a breakdown of the key elements and what they suggest:🔍 Key Components of the Chart🟥 Resistance Zone (Around 3,390 - 3,405)Marked at the top with red arrows.This area has historically seen price rejection, meaning gold struggled to go higher from here.It indicates strong selling pressure.🟦 Support Zone (Around 3,290 - 3,310)Price bounced back from this level several times.Shows buying interest and support.📉 Resistance TrendlineDiagonal black line sloping downward.Shows a pattern of lower highs – a bearish signal until broken.Price is currently testing or near this trendline, and a breakout could indicate bullish reversal.📊 Moving Averages (colored lines)These are short to medium-term moving averages (likely 9, 21, 50, 100 EMA).They help identify the trend direction and potential support/resistance levels.Currently, price is ranging around the moving averages, showing indecision or consolidation.🔮 Forecast Pathways (Possible Scenarios)✅ Bullish Scenario (Outlined with arrow):Price bounces off the support (around 3,310).Breaks above the resistance trendline.Heads back to test the resistance zone near 3,390–3,400.❌ Bearish Risk:If price fails to hold support at 3,310 or breaks lower,It could retest the lower support zone near 3,290 or even lower.📈 ConclusionThis chart suggests that gold is currently consolidating between support and resistance, and a breakout from the trendline will likely determine the next major move:Above = bullish towards 3,390–3,400.Below = bearish towards 3,290 or further.
XAUUSD_MASTER003

This chart shows the 1-hour (1H) price action for **Gold (XAU/USD)** as of **June 3, 2025**. It incorporates key technical indicators and price zones relevant for short-term trading or analysis. Here's a detailed breakdown:---### 📈 **Chart Components and Analysis**#### 1. **Trendline & Price Action*** A **resistance trendline** is drawn connecting recent higher highs, indicating a bearish breakout when price rejected the upper trend.* Price spiked above the trendline briefly but sharply reversed from a key area, suggesting **strong seller pressure** near the recent highs (\~\$3,400).#### 2. **Order Blocks (OBs)*** **Bearish OB (Order Block)**: Located just below the \$3,400 level. This zone marks a strong supply area where institutional selling likely occurred, leading to the recent drop.* **Bullish OB**: Around the \$3,320–\$3,340 zone. This represents a demand area where buyers previously stepped in, possibly creating a support base.#### 3. **Support Zone*** A **broad support zone** is shown in green between approximately **\$3,250 and \$3,270**.* This zone was tested previously and held firm, suggesting potential for bullish activity if price retraces deeply.#### 4. **Moving Averages (EMA 20/50/100/200)*** The EMAs are color-coded: * **20 EMA**: \$3,355.466 (red) * **50 EMA**: \$3,347.451 (orange) * **100 EMA**: \$3,333.973 (cyan) * **200 EMA**: \$3,318.522 (blue)* Price is currently trading between the 20 and 50 EMA, indicating a potential decision point (either breakout or pullback).#### 5. **Price Scenarios*** Two potential scenarios are drawn with arrows: * **Bullish Scenario**: Price bounces from the blue highlighted zone (minor demand) and targets the bearish OB. * **Bearish Scenario**: Price breaks down through the minor support and heads toward the **bullish OB** or **support zone**.---### 🧭 **Trading Implication*** **Short-term Bias**: Neutral to Bearish unless price reclaims and holds above \$3,355 (20 EMA).* **Key Levels to Watch**: * Resistance: \$3,380–\$3,400 (bearish OB) * Support: \$3,340–\$3,320 (bullish OB), then deeper at \$3,250–\$3,270---Would you like this analysis updated for future movements, or should I generate trading signals based on this setup?Target Achieved:The downward movement from the resistance zone to the support zone suggests that the short-term target mentioned in the title—"Eyes on Support Zone"—has been successfully achieved.
XAUUSD_MASTER003

This chart shows the price action of Gold (XAU/USD) on the 30-minute timeframe using TradingView. Here's a breakdown of what the chart indicates:---Key Elements:1. Price Level:Current price: $3,357.519 per ouncePrice is up +62.852 (+1.91%), indicating a strong recent bullish move.2. Support Level:A blue highlighted box labeled “Support level” around the $3,317–$3,338 range shows a key area where price previously found buying interest and bounced back up.3. Resistance & Breakout:There's a horizontal black resistance line just above $3,355.901.The price has broken above this resistance, which is a bullish signal.4. Bullish Projection:There’s a black arrow projection, suggesting a possible pullback (retest) to the broken resistance (now support) followed by a continuation upward.The projected target zone is near $3,396.230.5. Price Zones:Green and red price zones on the right show potential entry (buy) and stop-loss levels, supporting the idea of a long (buy) trade setup.
XAUUSD_MASTER003

This BTC/USD chart suggests a potential bearish scenario. Price is currently at $108,987, near resistance (highlighted zone). The chart shows a projected short-term bounce, followed by a drop toward the $104,486 support. Traders might expect a reversal if resistance holds.
XAUUSD_MASTER003

The chart you've shared is a technical analysis chart for Bitcoin (BTC) against the US Dollar (USD), specifically showing the price movement over a certain period. Here's a breakdown of the key elements and what they might indicate:1. *Chart Type and Time Frame*: The chart is a candlestick chart, which is a popular tool used in technical analysis to display the price action of an asset over time. The time frame indicated is 1 hour, meaning each candlestick represents the price movement of Bitcoin over a 1-hour period.2. *Price Movement*: The chart shows a recent upward trend in Bitcoin's price. The green candlesticks indicate periods where the price closed higher than it opened, while red candlesticks indicate the opposite. The overall direction suggests a bullish (upward) trend.3. *Trend Lines and Channels*: The chart includes several trend lines and a channel. The ascending channel (defined by the two parallel black lines) suggests that the price is moving within a certain range while maintaining an overall upward trajectory. The price touching the upper boundary of this channel could indicate a potential resistance level, while the lower boundary could act as support.4. *Annotations and Predictions*: The chart includes annotations that highlight certain price movements and predict future movements. The green rectangle on the left appears to highlight a consolidation or accumulation phase before a significant upward move. The orange rectangle seems to mark a recent consolidation or a potential "flag" pattern, which is often considered a continuation pattern in technical analysis, suggesting that the price might continue its upward trend after consolidating.5. *Predicted Price Movement*: The arrow pointing upwards from the current price level suggests a predicted continuation of the upward trend. This could be based on the analysis of the chart patterns, such as the breakout from the consolidation phase or the continuation of the trend within the ascending channel.6. *Support and Resistance Levels*: The chart highlights certain price levels that could act as support or resistance. The blue lines below the current price could represent support levels, where the price has historically bounced back. The levels marked on the right side of the chart (e.g., 107,160, 108,791) could be significant price points, potentially acting as support or resistance.
XAUUSD_MASTER003

This chart shows possible price movement predictions for gold (XAU/USD) on the 1-hour timeframe:Current price is around 3,202.If the price goes up, it may reach around 3,212–3,219 or even higher.If the price goes down, it may drop to the support zone near 3,125–3,118.Arrows show two possible directions: bounce up from support or drop after hitting resistance.
XAUUSD_MASTER003

This is a 30-minute candlestick chart of Gold (XAU/USD) showing technical analysis for short-term trading. Here's a breakdown of what the chart is illustrating:1. Falling Wedge Pattern (Bullish Reversal)The red lines form a falling wedge, a bullish reversal pattern.Price broke out upwards from the wedge, which is typically a buy signal.The orange circle marks the breakout point.2. Support and Resistance ZonesGreen Zone (Upper Box ~ 3,255): Strong resistance zone, where sellers might step in.Brown Zone (~3,192): Now acting as support, previously a resistance level.Blue Arrow: Suggests expected upward continuation after a possible retest of the support zone.3. Current Price ActionGold is trading at 3,222.440, up +1.43%.The chart suggests a bullish outlook with a potential move toward 3,255.828.4. Trade SetupA long (buy) trade has likely been initiated around the wedge breakout.Target: Resistance zone at ~3,255.Stop loss: Below the support at around ~3,172.881.
XAUUSD_MASTER003

---1. Chart Type & TimeframeInstrument: CFDs on Gold (XAUUSD)Timeframe: 30-minute candlesEach candlestick represents 30 minutes of price action.---2. Trend ChannelThe two diagonal lines forming a rising channel indicate a previous uptrend.Price respected this channel until it broke down below the lower boundary.---3. Recent Price ActionGold recently rejected the upper boundary of the channel near the 3,403–3,404 level.A sharp price drop followed, breaking below the lower trendline, indicating potential trend reversal or correction.---4. Trade SetupThis chart shows an active short (sell) trade setup:Entry: Around 3,387Stop Loss: Around 3,403 (marked in red)Take Profit: Around 3,329 (marked in green)Risk/Reward: Selling with expectation of further decline---5. Indicators & AnnotationsRed shaded box: Stop loss zone (risk area)Green shaded box: Target zone (reward area)Horizontal lines: Entry, stop loss, and take profit levelsOrange circle: A potential key resistance/reversal point---
XAUUSD_MASTER003

Key observations:Supply Zone: The upper orange region near $3,360–$3,380 represents a strong supply zone where sellers have consistently stepped in.Resistance Levels: Price has faced repeated rejections below the $3,320–$3,340 zone, aligning with downward trendlines.Demand Zone: The blue area between $3,260–$3,285 marks a clear demand region, with previous bounces showing buyer interest.Trendlines: Red descending trendlines indicate a bearish structure still intact. The green ascending trendline suggests slight bullish pressure building from the lows.Market Sentiment:Despite the outdated chart setup, the market is moving as anticipated. The price is respecting key levels and patterns drawn earlier, confirming our directional bias. A breakout below the lower support or above the upper resistance would signal the next major move.
Disclaimer
Any content and materials included in Sahmeto's website and official communication channels are a compilation of personal opinions and analyses and are not binding. They do not constitute any recommendation for buying, selling, entering or exiting the stock market and cryptocurrency market. Also, all news and analyses included in the website and channels are merely republished information from official and unofficial domestic and foreign sources, and it is obvious that users of the said content are responsible for following up and ensuring the authenticity and accuracy of the materials. Therefore, while disclaiming responsibility, it is declared that the responsibility for any decision-making, action, and potential profit and loss in the capital market and cryptocurrency market lies with the trader.