Technical analysis by Royalfxsignal about Symbol PAXG: Buy recommendation (5/8/2025)

Full Technical Analysis of XAU/USD (Gold Spot) – 1H Chart
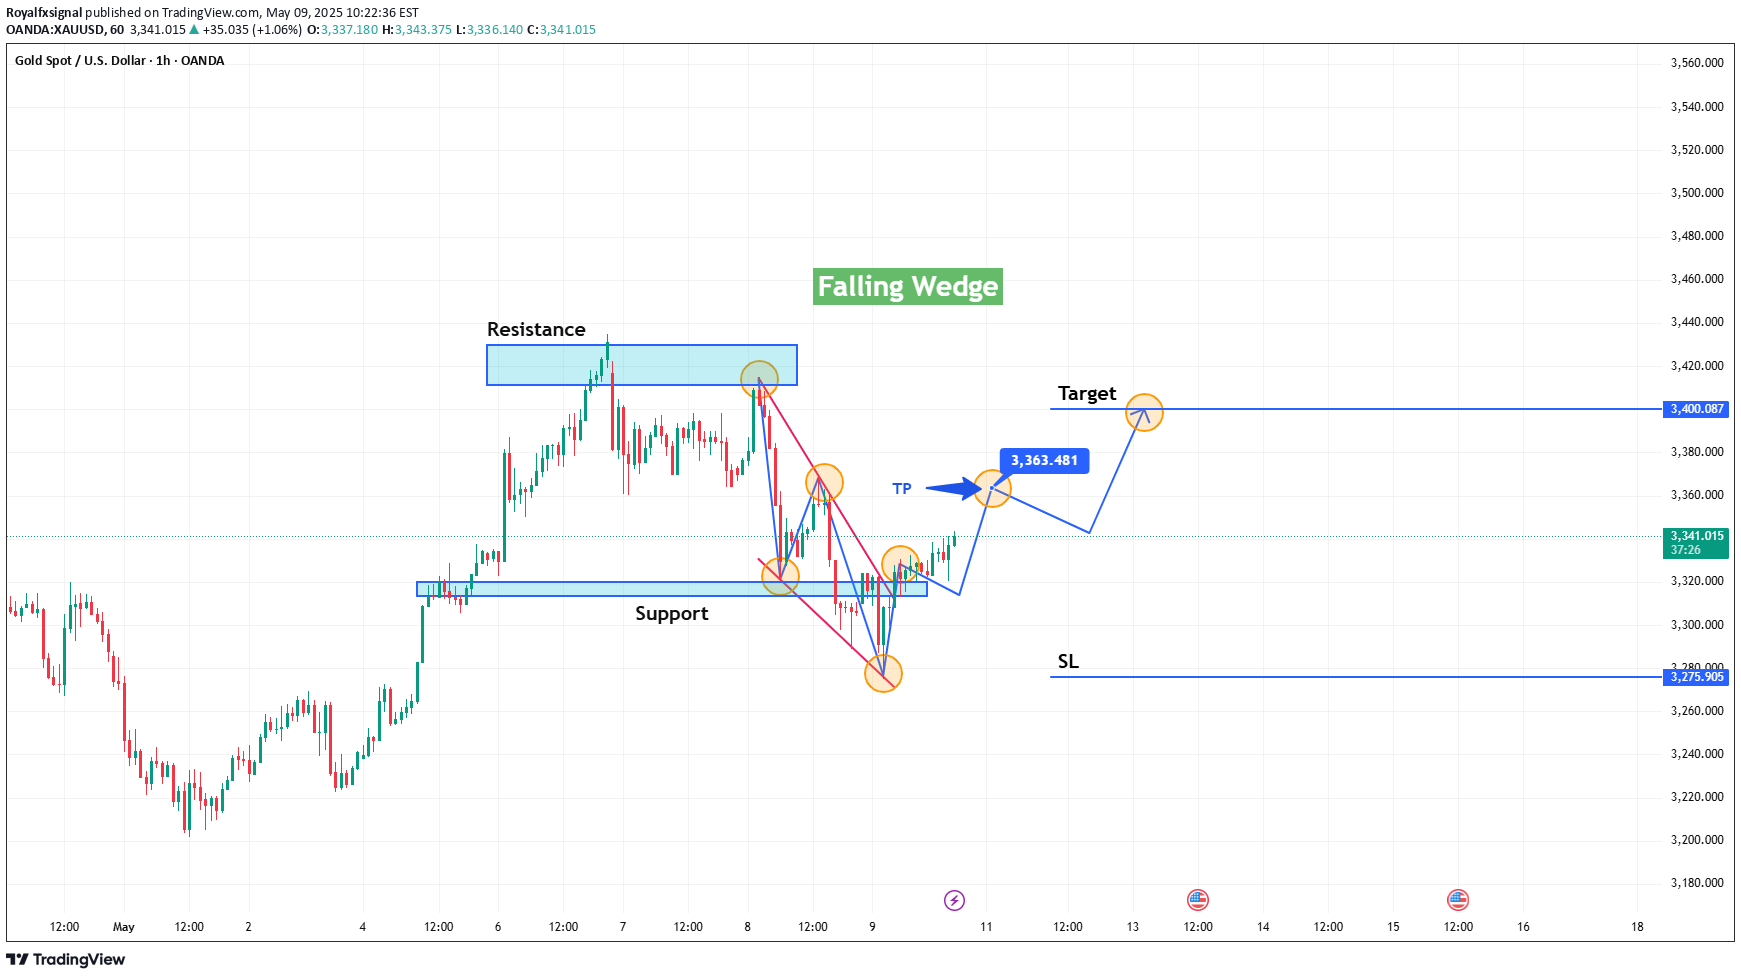
Full Technical Analysis of XAU/USD (Gold Spot) – 1H Chart📌 OverviewThis chart illustrates a textbook Falling Wedge Reversal Pattern, identified after a strong bearish correction from the resistance zone. The price has now broken out of this wedge, suggesting a potential bullish continuation in the short term. The setup includes clear support/resistance zones, entry/exit levels, and a favorable risk-reward ratio.🟩 Pattern Identified: Falling WedgeA Falling Wedge is a bullish reversal pattern characterized by two downward-sloping converging trendlines.The wedge began forming after price was rejected from the resistance zone around $3,470–$3,500.Multiple touchpoints confirm the wedge structure:Each swing high is lower than the previous (forming the upper resistance trendline).Each swing low is also lower but with diminishing strength (forming the lower support trendline).The wedge concludes with a bullish breakout, which is supported by strong price action and a momentum shift.🧱 Key Technical Zones🔹 Resistance Zone: $3,470–$3,500This level served as a strong supply zone.Price rejected this level twice, forming the beginning of the wedge.Now a potential long-term upside target if momentum continues.🔹 Support Zone: $3,275–$3,290Established by previous demand and the base of the wedge.It’s also the point of the last significant bullish reversal.Acts as the logical stop-loss area for long trades.🔹 Breakout ConfirmationThe breakout occurred just above $3,330–$3,335, completing the wedge structure.Breakout confirmed by bullish momentum and a higher high after the final lower low.Entry confirmation at the breakout retest area, marked near $3,340–$3,345.🎯 Trade Plan BreakdownElementLevelCommentEntry (TP area)$3,363.481Ideal breakout retest and early targetFinal Target$3,400.087Horizontal resistance + measured wedge projectionStop Loss (SL)$3,275.905Below wedge base, invalidates bullish thesis if brokenReward:Risk Ratio~2:1Favorable setup, strong pattern support📈 Projected Price PathPrice is expected to retest the breakout level ($3,363) before continuing upward.A smooth bullish wave could target $3,400, coinciding with prior resistance and Fibonacci zones.Failure to hold above $3,300 could reintroduce bearish pressure, invalidating the wedge.⚙️ Technical SummaryPattern: Falling Wedge (Bullish Reversal)Structure Shift: Bearish to BullishMarket Sentiment: Reversal from oversold zoneVolatility: Moderate, range-bound inside wedge, breakout expanding💬 Professional Insight“Gold (XAU/USD) has completed a falling wedge breakout from a key support zone, signaling a bullish reversal. The setup offers a clean entry with tight stop placement and an attractive upside toward $3,400. Watch for confirmation candles or volume spikes near the breakout retest area to confirm bullish continuation. A breach below $3,275 would invalidate the pattern.”