Technical analysis by Alessiocalabretta about Symbol PAXG: Sell recommendation (5/8/2025)

Alessiocalabretta
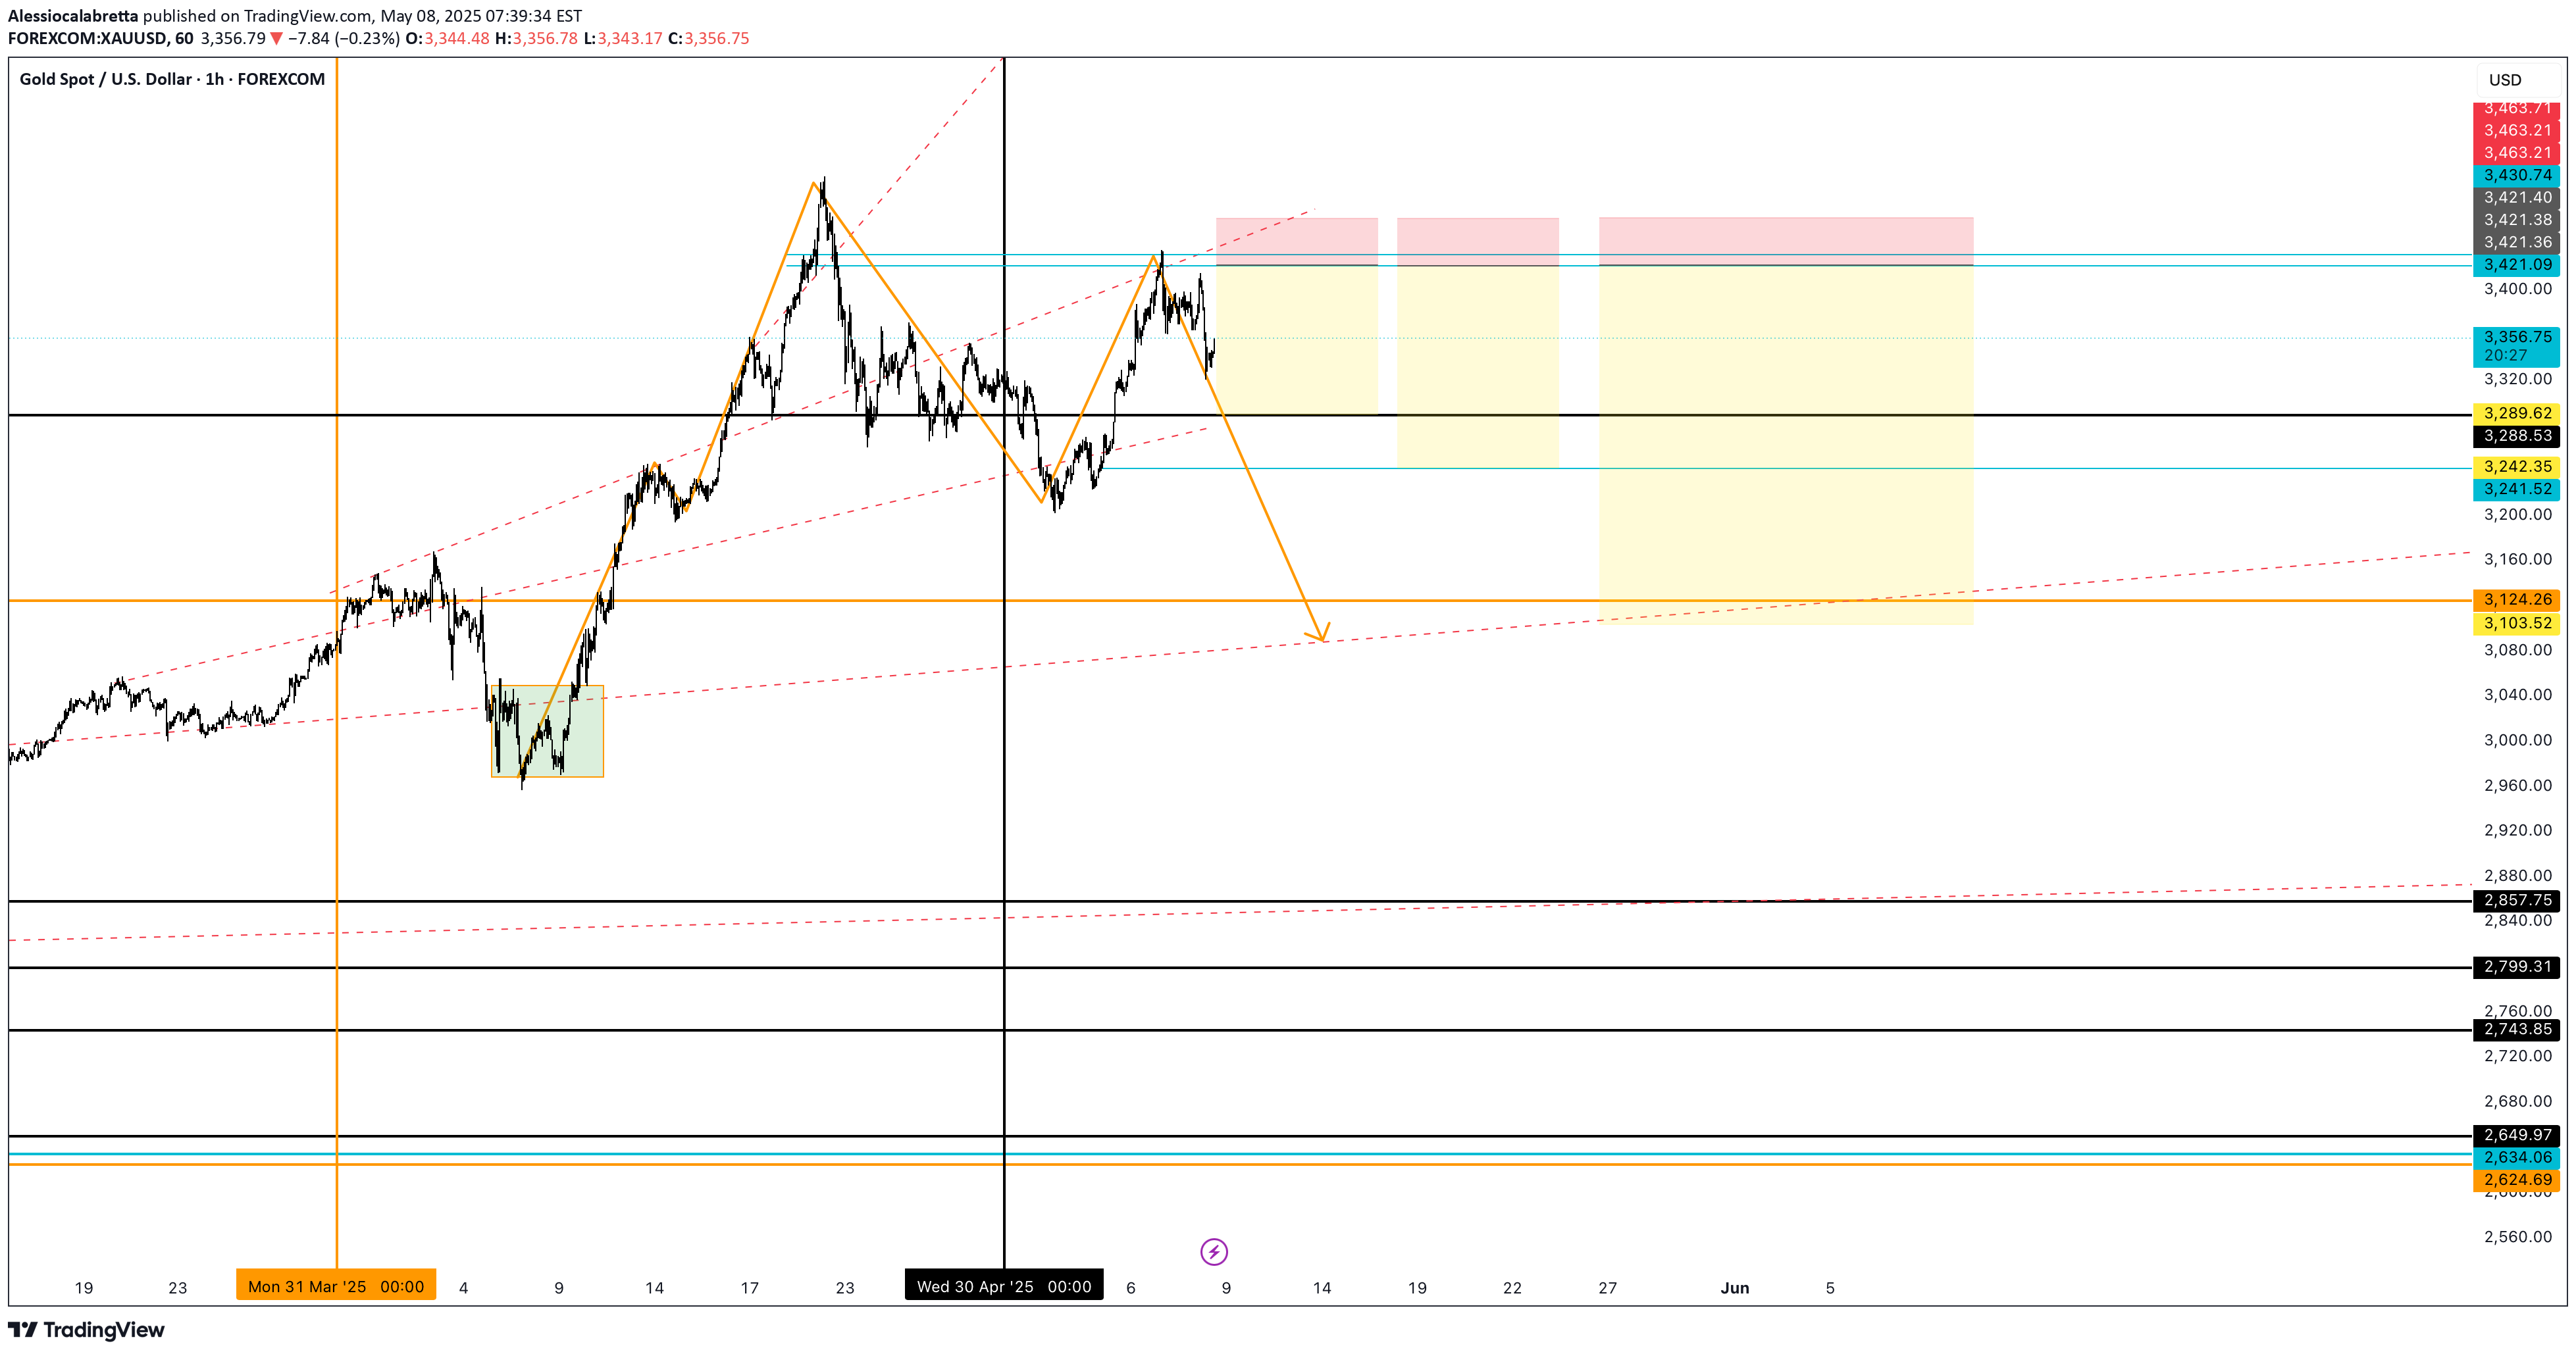
he image you provided is a technical analysis of Gold (XAU/USD) on the 15-minute timeframe from TradingView. It clearly reflects a bearish (short) outlook for the coming weeks, potentially lasting until the end of May 2025. Here's a detailed breakdown:🔍 Technical ContextGold reached a high around 3,500, followed by a correction that revisited the 3,421 level, creating a strong resistance zone (likely due to liquidity grabs and profit-taking).From there, the chart shows a potential reversal structure, with expectations of a downward move.🔻 Bearish Scenario (Short)The final target for this bearish move is in the 3,124–3,078 area, which represents a key liquidity zone (highlighted with dashed lines and orange horizontal levels).Before reaching that, the price might test several intermediate support zones:3,2883,2413,124The current pattern suggests that after a strong upward impulse, the market is now likely taking a breather, possibly influenced by strength in the equity markets, which reduces gold's appeal as a safe haven in the short term.📅 Expected TimeframeThis downward move is expected to unfold by the end of May 2025, as indicated by the vertical time markers on the chart (one marking May 15th).📈 Additional ObservationsThere's a red-green box on the chart indicating the risk/reward zone for the short entry.The previous bullish trend is marked by clear impulse and correction waves, but the current price action shows loss of momentum and possible reversal signs.
