Technical analysis by Royalfxsignal about Symbol ETH: Sell recommendation (5/5/2025)

ETH/USD Technical Analysis (30-Min Chart)
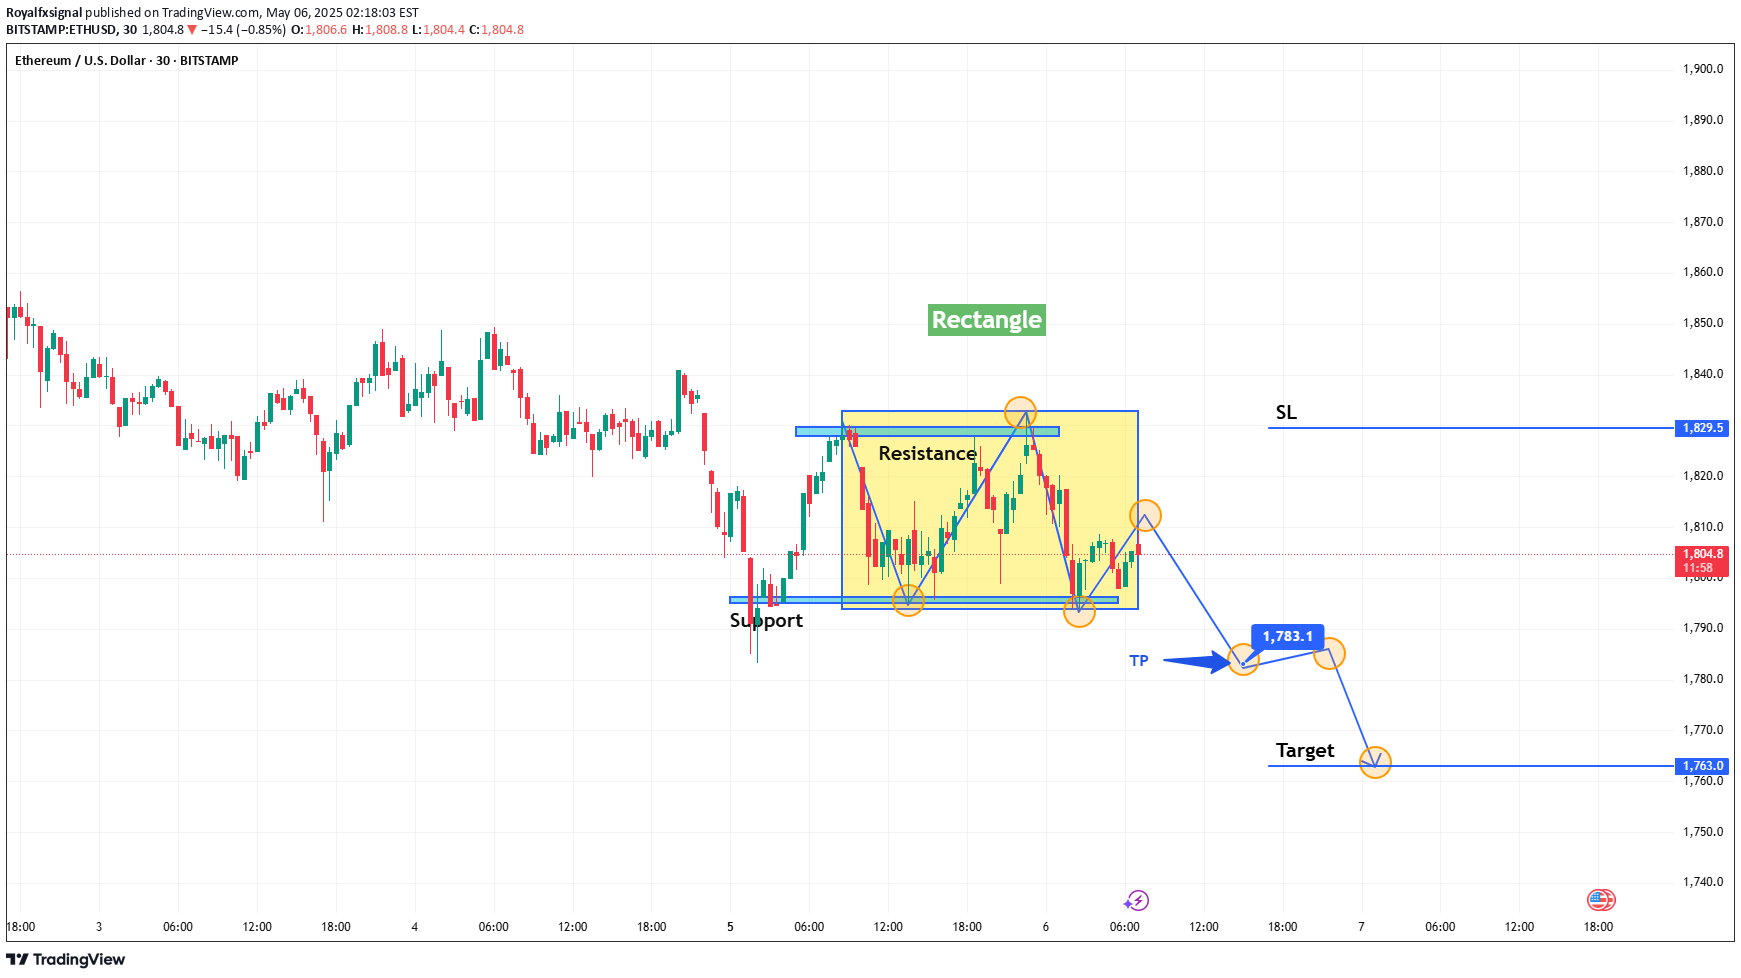
ETH/USD Technical Analysis (30-Min Chart)🗓️ Chart Date: May 6, 2025🧠 Author: Royalfxsignal🟨 Chart Pattern: Rectangle Pattern (Bearish Bias)🧱 Structure Explanation:This ETH/USD chart shows a Rectangle Pattern, also known as a Range-Bound Consolidation. Price has been oscillating between a defined resistance zone and a support zone, indicating indecision in the market. However, given the prior bearish trend, the pattern suggests a bearish continuation is likely.🔹 Key Chart Levels:LevelValue (USD)Description🔼 Resistance~1,815–1,820Top of the rectangle zone (multiple rejections)🔽 Support~1,794–1,798Bottom of the rectangle (held twice)🎯 Target1,763.0Bearish measured move target💡 Take Profit (TP)1,783.1Intermediate target for partial exit🛑 Stop Loss (SL)1,829.5Above rectangle resistance (invalidates setup)🔄 Price Action Breakdown:Prior Trend:The price entered this consolidation after a clear downtrend, indicating the rectangle is likely a bearish continuation pattern.Rectangle Formation:Multiple touches on both upper resistance and lower support define the rectangle.The range suggests accumulation/distribution before a breakout.Highlighted Swing Points:Price moved within the box, forming lower highs and equal lows.The most recent bounce off the lower edge aligns with prior structure, showing weak bullish momentum.Current Position:Price is hovering near the middle of the range, testing minor resistance after another bounce.A move below the lower support could trigger a breakout trade.📈 Trade Setup Strategy:🔽 Short Setup:Entry Trigger:Enter short on a confirmed break and close below $1,794.Take Profit (TP1):$1,783.10 — minor support zone, offers partial profit-taking.Take Profit (TP2):$1,763.00 — full measured move of rectangle projected downward.Stop Loss (SL):$1,829.50 — above rectangle highs and recent lower high swing.🎯 Measured Move Calculation:The rectangle's height is approximately:$1,820 (resistance) – $1,794 (support) = $26Projected downward:Breakout zone ($1,794) – $26 = Target at $1,768, which aligns well with your $1,763 target area.🧩 Risk Management:Risk-to-Reward Ratio:Approximately 1:2 to 1:3, depending on entry precision and TP level chosen.Trade Confirmation:Look for a strong bearish candle close below the support for confirmation before entering.Avoid Early Entries:Do not enter inside the range — wait for clean breakout or retest.📌 Conclusion:“ETH/USD is consolidating within a defined range after a strong bearish leg. A breakdown below $1,794 may confirm a rectangle continuation pattern, offering a short opportunity toward $1,763. The setup offers favorable risk-to-reward with a stop loss above $1,829.”