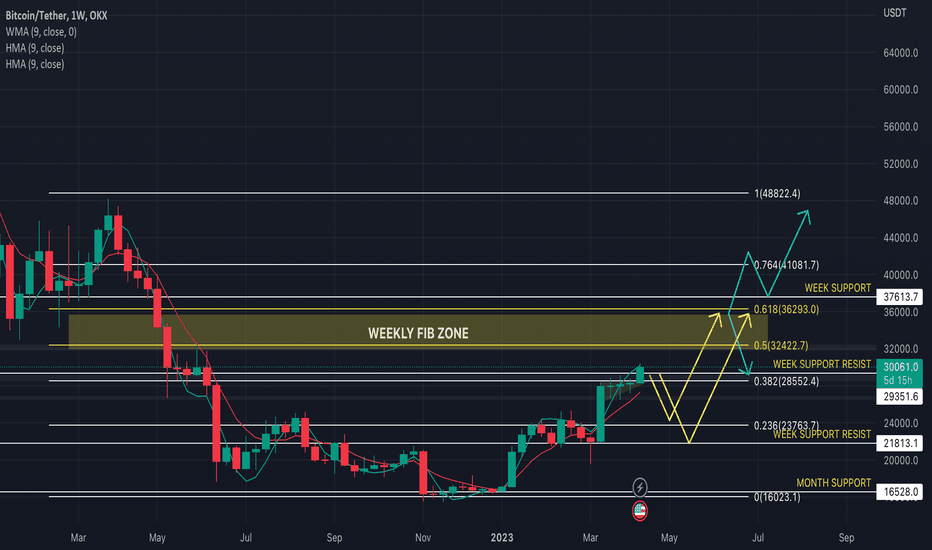
Technical analysis by OKX about Symbol BTC on 4/11/2023

Good day to all traders out there! Here’s an example of an OKXIDEAS contest submission: On the weekly outlook, BTC is forming higher lows, with mini consolidation on the daily timeframe’s resistance. No fancy analysis for this. Using Price Action + Supply & Demand levels, these are the following options we would be anticipating price to move. Possible move 1: - Price rejects resistance (28500-29200) zone and retrace down to (1) 24200 or (2) 21800. - Price bounces of either of the levels and heads into the Weekly Fibonacci Zone (31870 - 35741) This entire move should take about more than a week. Possible move 2: - Price breaks resistance (28500-29200) zone and heads straight into the Weekly Fibonacci Zone (31870 - 35741) In the Fibonacci Zone - We are expecting price to continue it’s upward trend to retest 48270, completing the “cup pattern”
