Technical analysis by Day_Trading_Attack_Penguins about Symbol PAXG on 8/21/2024

Day_Trading_Attack_Penguins
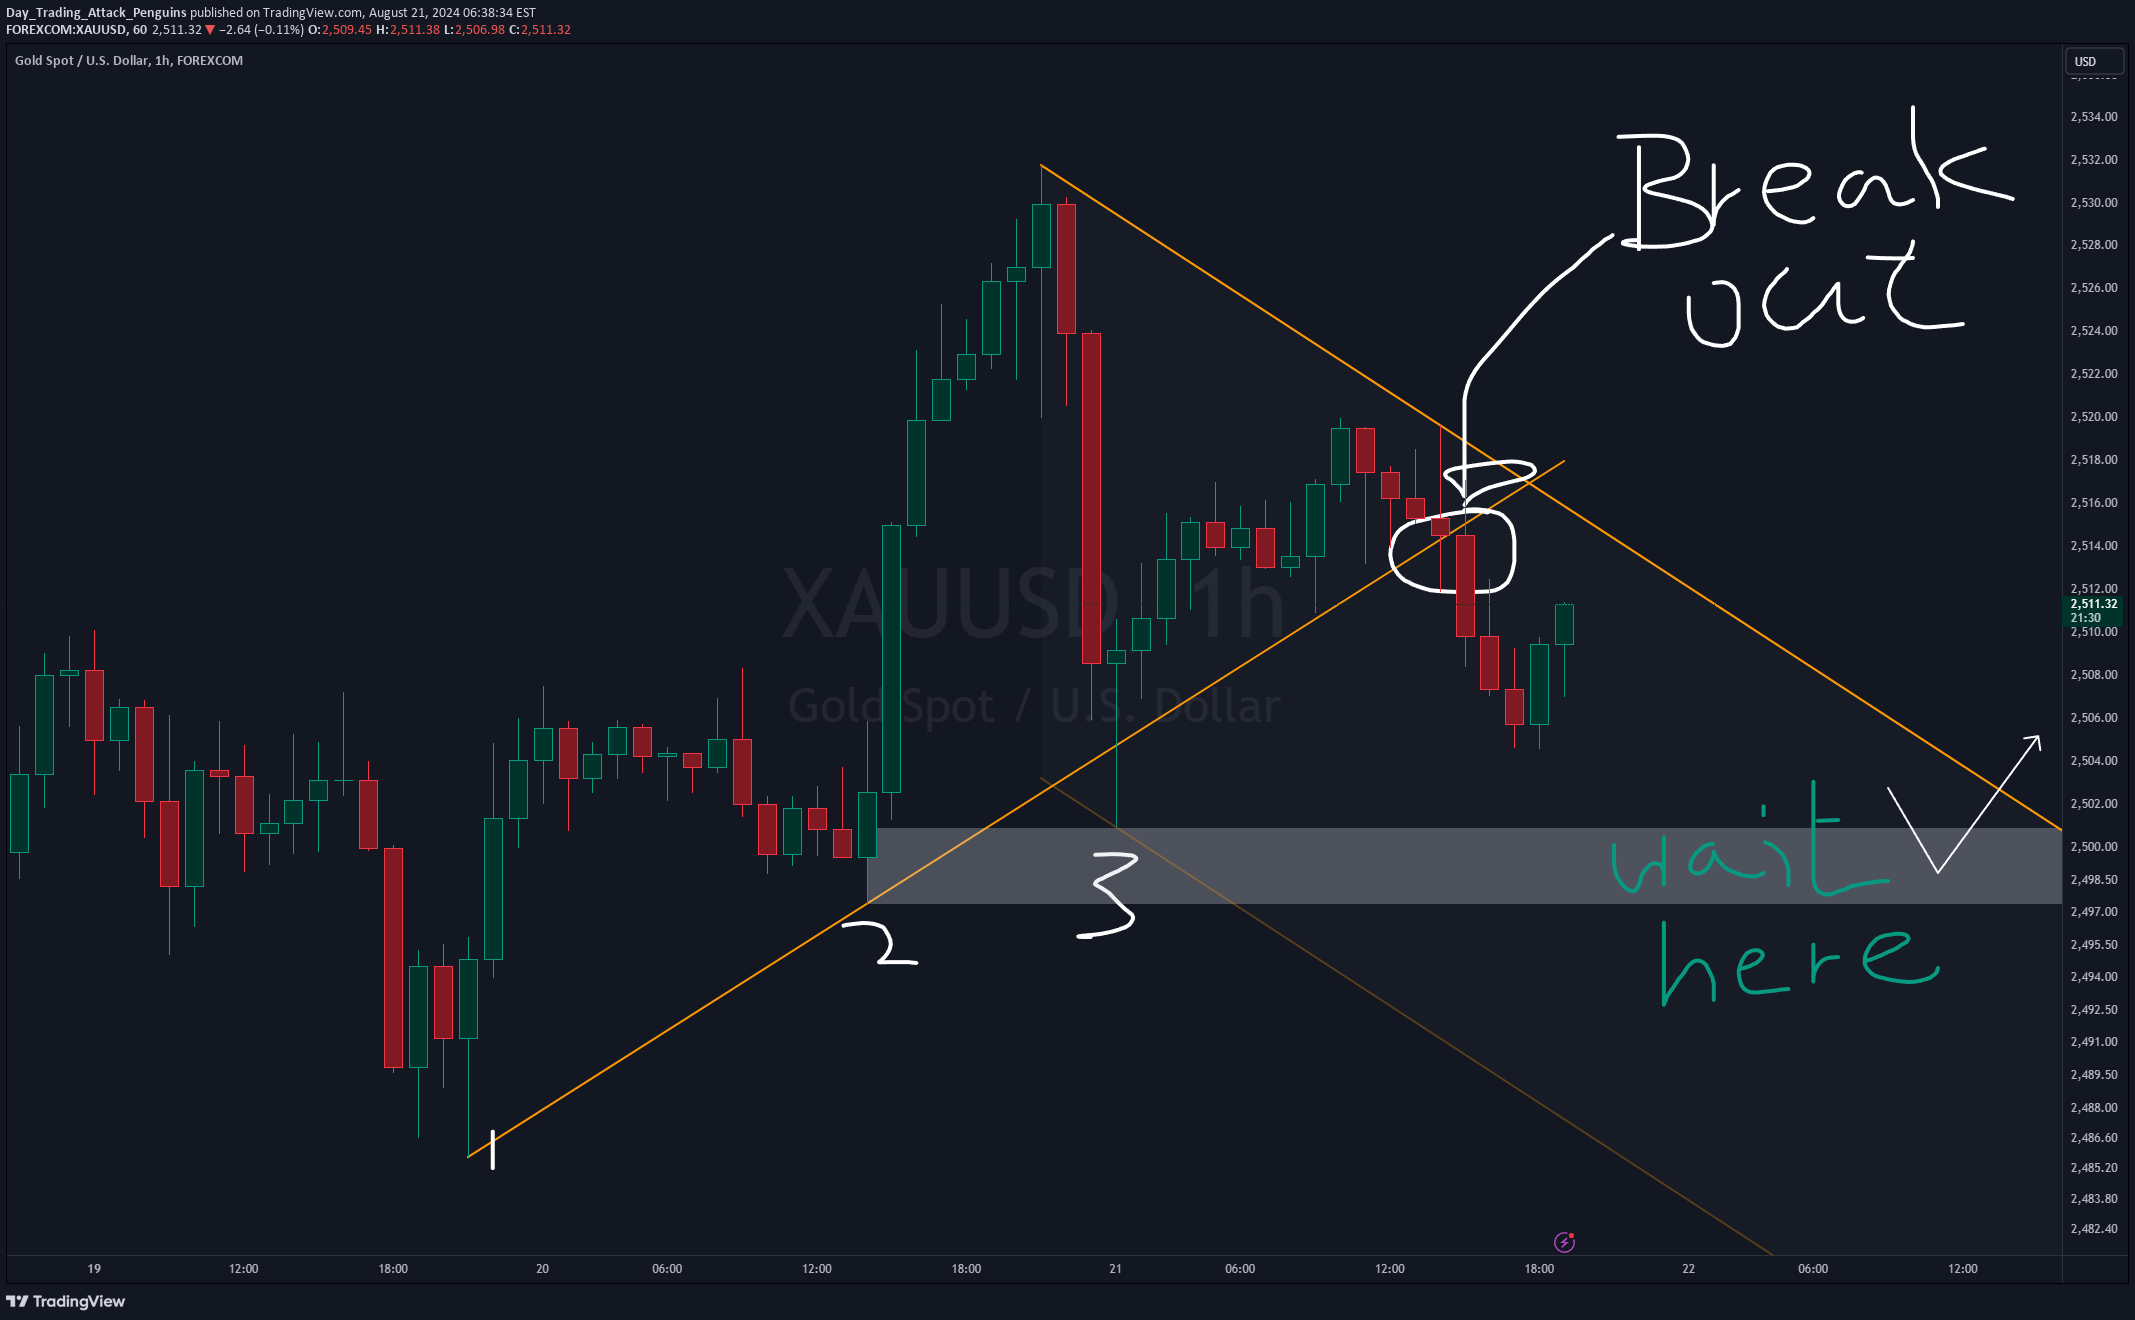
In this 1-hour chart of XAU/USD (Gold against the US Dollar), we can observe key market price actions. The yellow trendline on the chart connects several lows from the bottom left, indicating that the market has been in an upward trend recently. However, as the price breaks this upward trendline, this trend may be coming to an end, suggesting that the market could reverse or enter a new downward phase. Notably, the gray area on the chart is marked as a potential support zone. This zone is approximately between 2500 and 2490 and could serve as a support level for the market. It's important to closely monitor the price action within this area to confirm whether effective support (price behavior) will appear, which will help determine the next trading strategy. After the market breaks the trendline, it's important not to rush into selling. Instead, it's advisable to cautiously wait for the price to retrace to this key support area and use additional market signals to confirm the right entry point. This strategy can help reduce risk and increase the likelihood of successful trades.
