Technical analysis by CaterinaGoldTrading about Symbol PAXG on 4/10/2024
https://sahmeto.com/message/3342986

Gold Price Analysis: Technical Indicators and Trading Signals
Neutral
Price at Publish Time:
$2,334.33
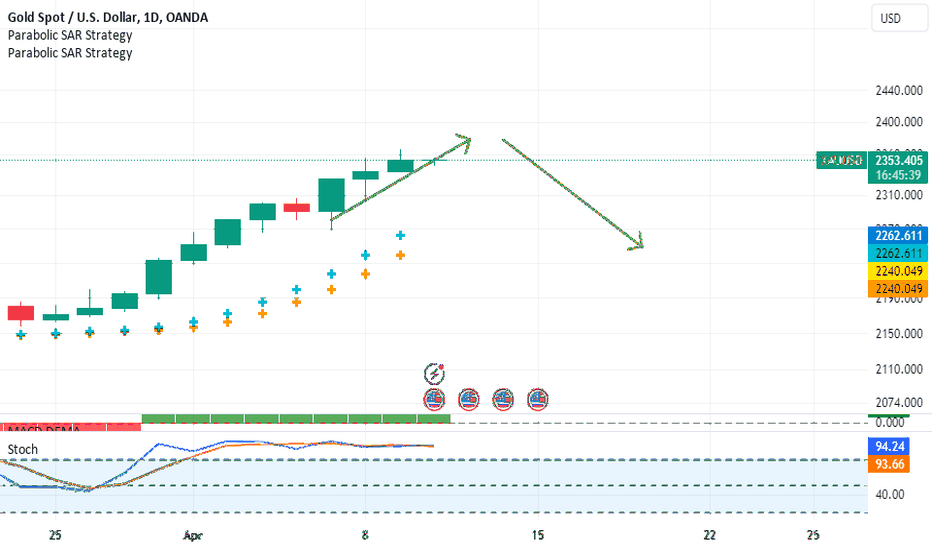
One technical indicator that can help identify potential reversal points for a trend is the Parabolic SAR (Stop And Reversal). The Parabolic SAR places dots on the chart to indicate potential reversal points. From the above figure, you can see the dots change from being below the candlesticks in an uptrend to being above the candlesticks when the trend reverses to a downtrend.When the Stochastic rises above 80, it signals that the market is entering an overbought condition. When the Stochastic falls below 20, it signals that the market is entering an oversold condition.
Source Message: TradingView