Technical analysis by efafinans about Symbol BTC: Buy recommendation (9/5/2022)

efafinans
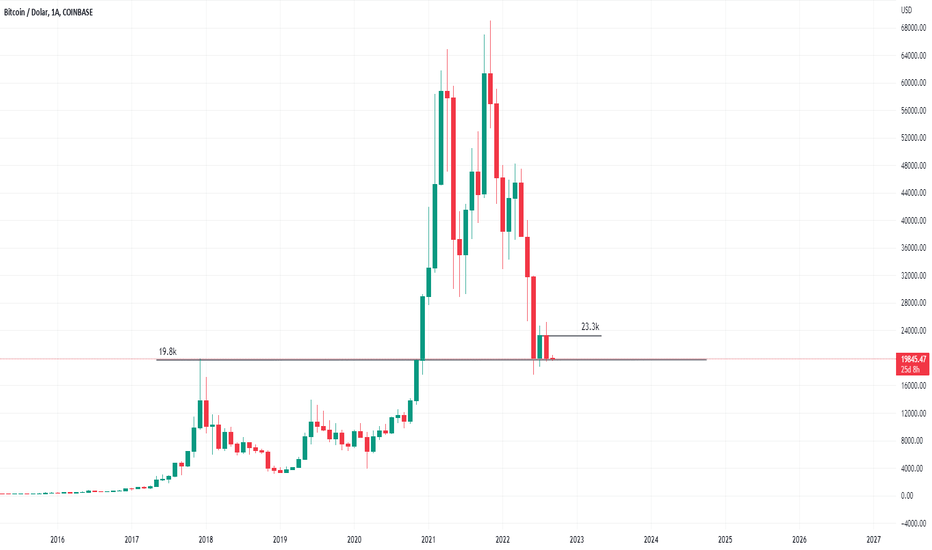
*The 19.8k level stands as psychological support on the monthly chart. In the volume decline in June, it left a wick of 2k points below this support (17.5k). Despite falling below this support 3 times in the last 3 months, it could not close on a monthly basis. If this level is broken, a volume decline may occur to 14k-13.9k levels. The 23.3k level is ahead of us as the resistance level (I indicated it on the chart). If it makes a monthly candle close above this level, a new uptrend may start. It left a wick of approximately 2k points above the resistance I mentioned 2 times in the last 2 months (25.1k) but could not close on a monthly basis. * There are 25 days until the candle close of September. Therefore, September is important for us. *In the daily chart, Bitcoin movements have been limited between 19k-24.4k for about 3 months. With the publication of the FED minutes on August 17, the rising wedge broke downwards and the BTC price fell by approximately 4.5k points to the 19.5k level. * There is currently a narrowing triangle formation and the price is going back and forth within this formation. If the formation breaks downwards, there may be a fall to the 17.6k level again. Conversely, if it breaks upwards, we can expect an increase to the 25.2k level. The FED meeting will be held on September 20-21. The interest rate decision will be announced after the meeting. There is currently an expectation of a 0.75 basis point interest rate increase and the market has priced in the expectation. In fact, I expect a recovery in the markets after the decision. When we look at the monthly chart, there is a positive outlook. Therefore, it would be healthier to act according to the monthly chart rather than the daily chart. As I mentioned above, there is a big squeeze in the daily chart and price movements are limited. For this reason, it would not be healthy to comment by looking at the daily chart. Do not take into account past analyses after sharing a new analysis. Because the market is in constant motion and there may be a difference in interpretation between the previous analysis and the new analysis. I had stopped trading for a long time, I want you to know that I have started trading again instantly :)
