
ZRX
0x
| تریدر | نوع سیگنال | حد سود/ضرر | زمان انتشار | مشاهده پیام |
|---|---|---|---|---|
No results found. | ||||
Price Chart of 0x
سود 3 Months :
سیگنالهای 0x
Filter
Sort messages by
Trader Type
Time Frame

CryptoAnalystSignal
تحلیل فوری ZRX/USDT: آماده جهش بزرگ از کف حمایت کلیدی!

#ZRX The price is moving in a descending channel on the 1-hour timeframe. It has reached the lower boundary and is heading towards breaking above it, with a retest of the upper boundary expected. We have a downtrend on the RSI indicator, which has reached near the lower boundary, and an upward rebound is expected. There is a key support zone in green at 0.1415. The price has bounced from this zone multiple times and is expected to bounce again. We have a trend towards stability above the 100-period moving average, as we are moving close to it, which supports the upward movement. Entry price: 0.1440 First target: 0.1458 Second target: 0.1481 Third target: 0.1522 Stop loss: Below the support zone in green. Don't forget a simple thing: capital management. For inquiries, please leave a comment. Thank you.#ZRX First target: 0.1458 Reached Second target: 0.1481 Reached Third target: 0.1522 Reached
CryptoAnalystSignal
#ZRX/USDT Bullish Impulse, New All-Time High Late 2025
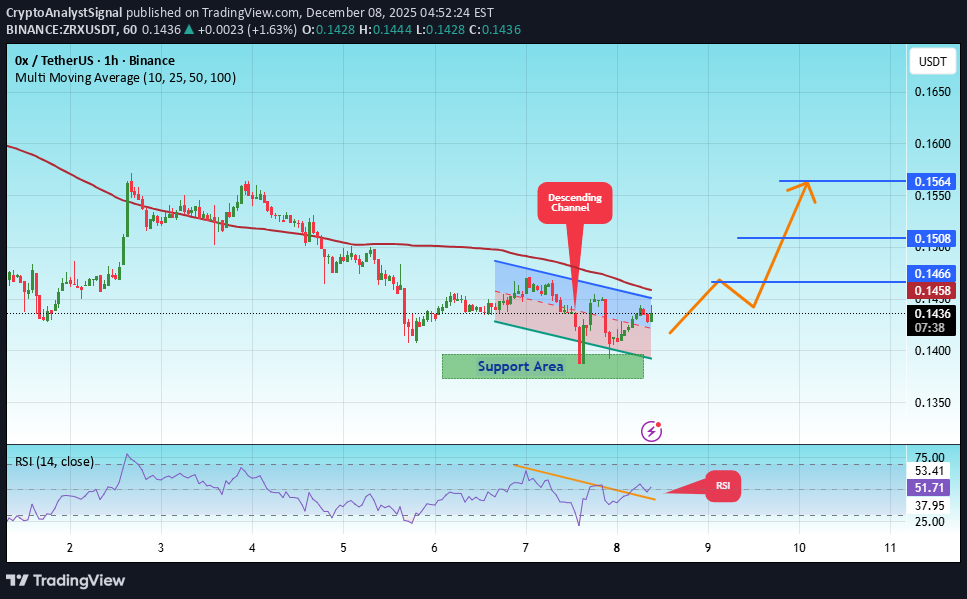
#ZRX The price is moving in a descending channel on the 1-hour timeframe. It has reached the lower boundary and is heading towards breaking above it, with a retest of the upper boundary expected. We have a downtrend on the RSI indicator, which has reached near the lower boundary, and an upward rebound is expected. There is a key support zone in green at 0.1380. The price has bounced from this level multiple times and is expected to bounce again. We have a trend towards consolidation above the 100-period moving average, as we are moving close to it, which supports the upward movement. Entry price: 0.1436 First target: 0.1466 Second target: 0.1508 Third target: 0.1564 Don't forget a simple principle: money management. Place your stop-loss order below the green support zone. For any questions, please leave a comment. Thank you.#ZRX First target: 0.1466 Reached Second target: 0.1508 Reached#ZRX First target: 0.1466 Reached Second target: 0.1508 Reached Third target: 0.1564 Reached

TRADEKING_1988
تحلیل زروکس (ZRX): سیگنال ورود آماده؟ (بررسی فیبوناچی و خطوط روند)

-Trendline retest Red -Liquidity taken -Fakeout GREEN trendline -Fib 0.7

WaveRiders2

DragonCaoB
تحلیل تکنیکال زوماوت ZRX: فرصت طلایی خرید با پتانسیل رشد بالا!

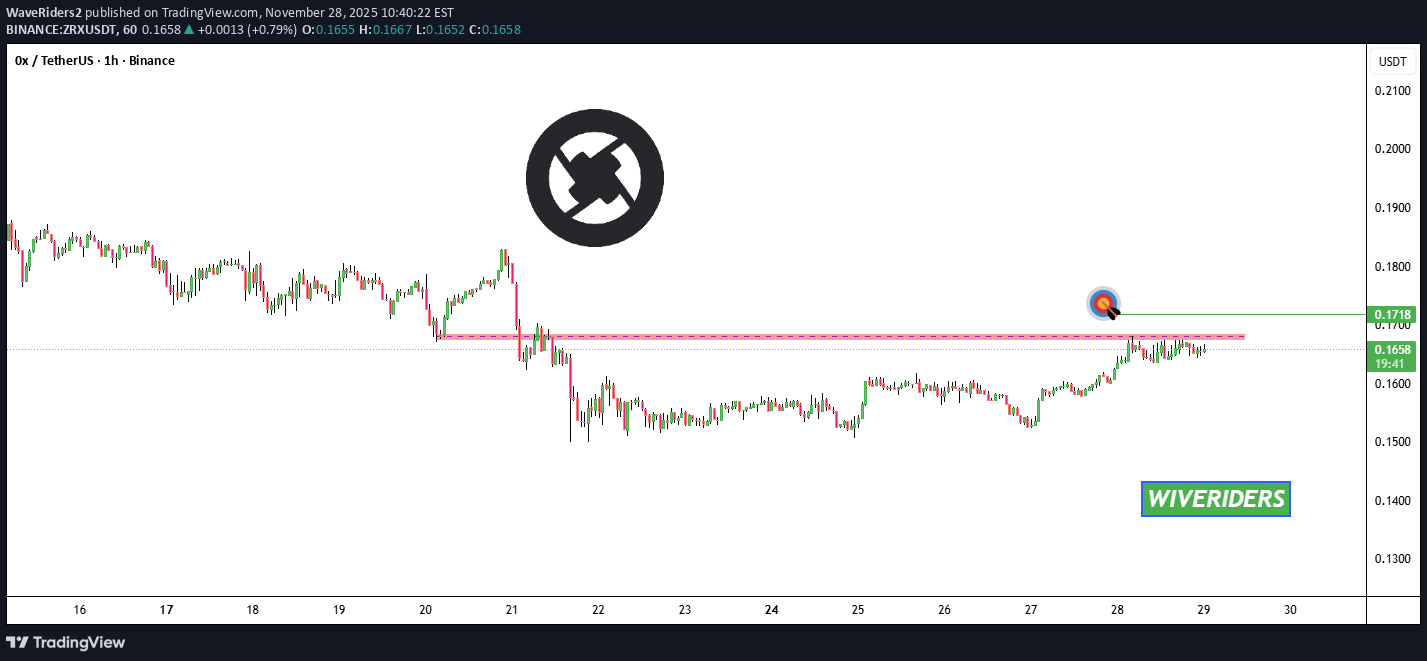
🐂 Scalp LONG – ZRX ZRX has broken its downtrend and is now pressing against the upper boundary of its accumulation range. A clean breakout from this box would open a strong path for price to retest the previous high. Momentum is stabilizing, and structure favors a bullish continuation if liquidity is cleared above the range. Key Signals Downtrend already broken → structure shifting bullish Price compressing at the top of accumulation Breakout = high probability move toward prior highs 🎯 TP: 0.1791 🛡️ SL: 0.1500 📊 RR: 1 : 2.38 A focused long setup, waiting for confirmation as ZRX escapes the range.

CaliG11
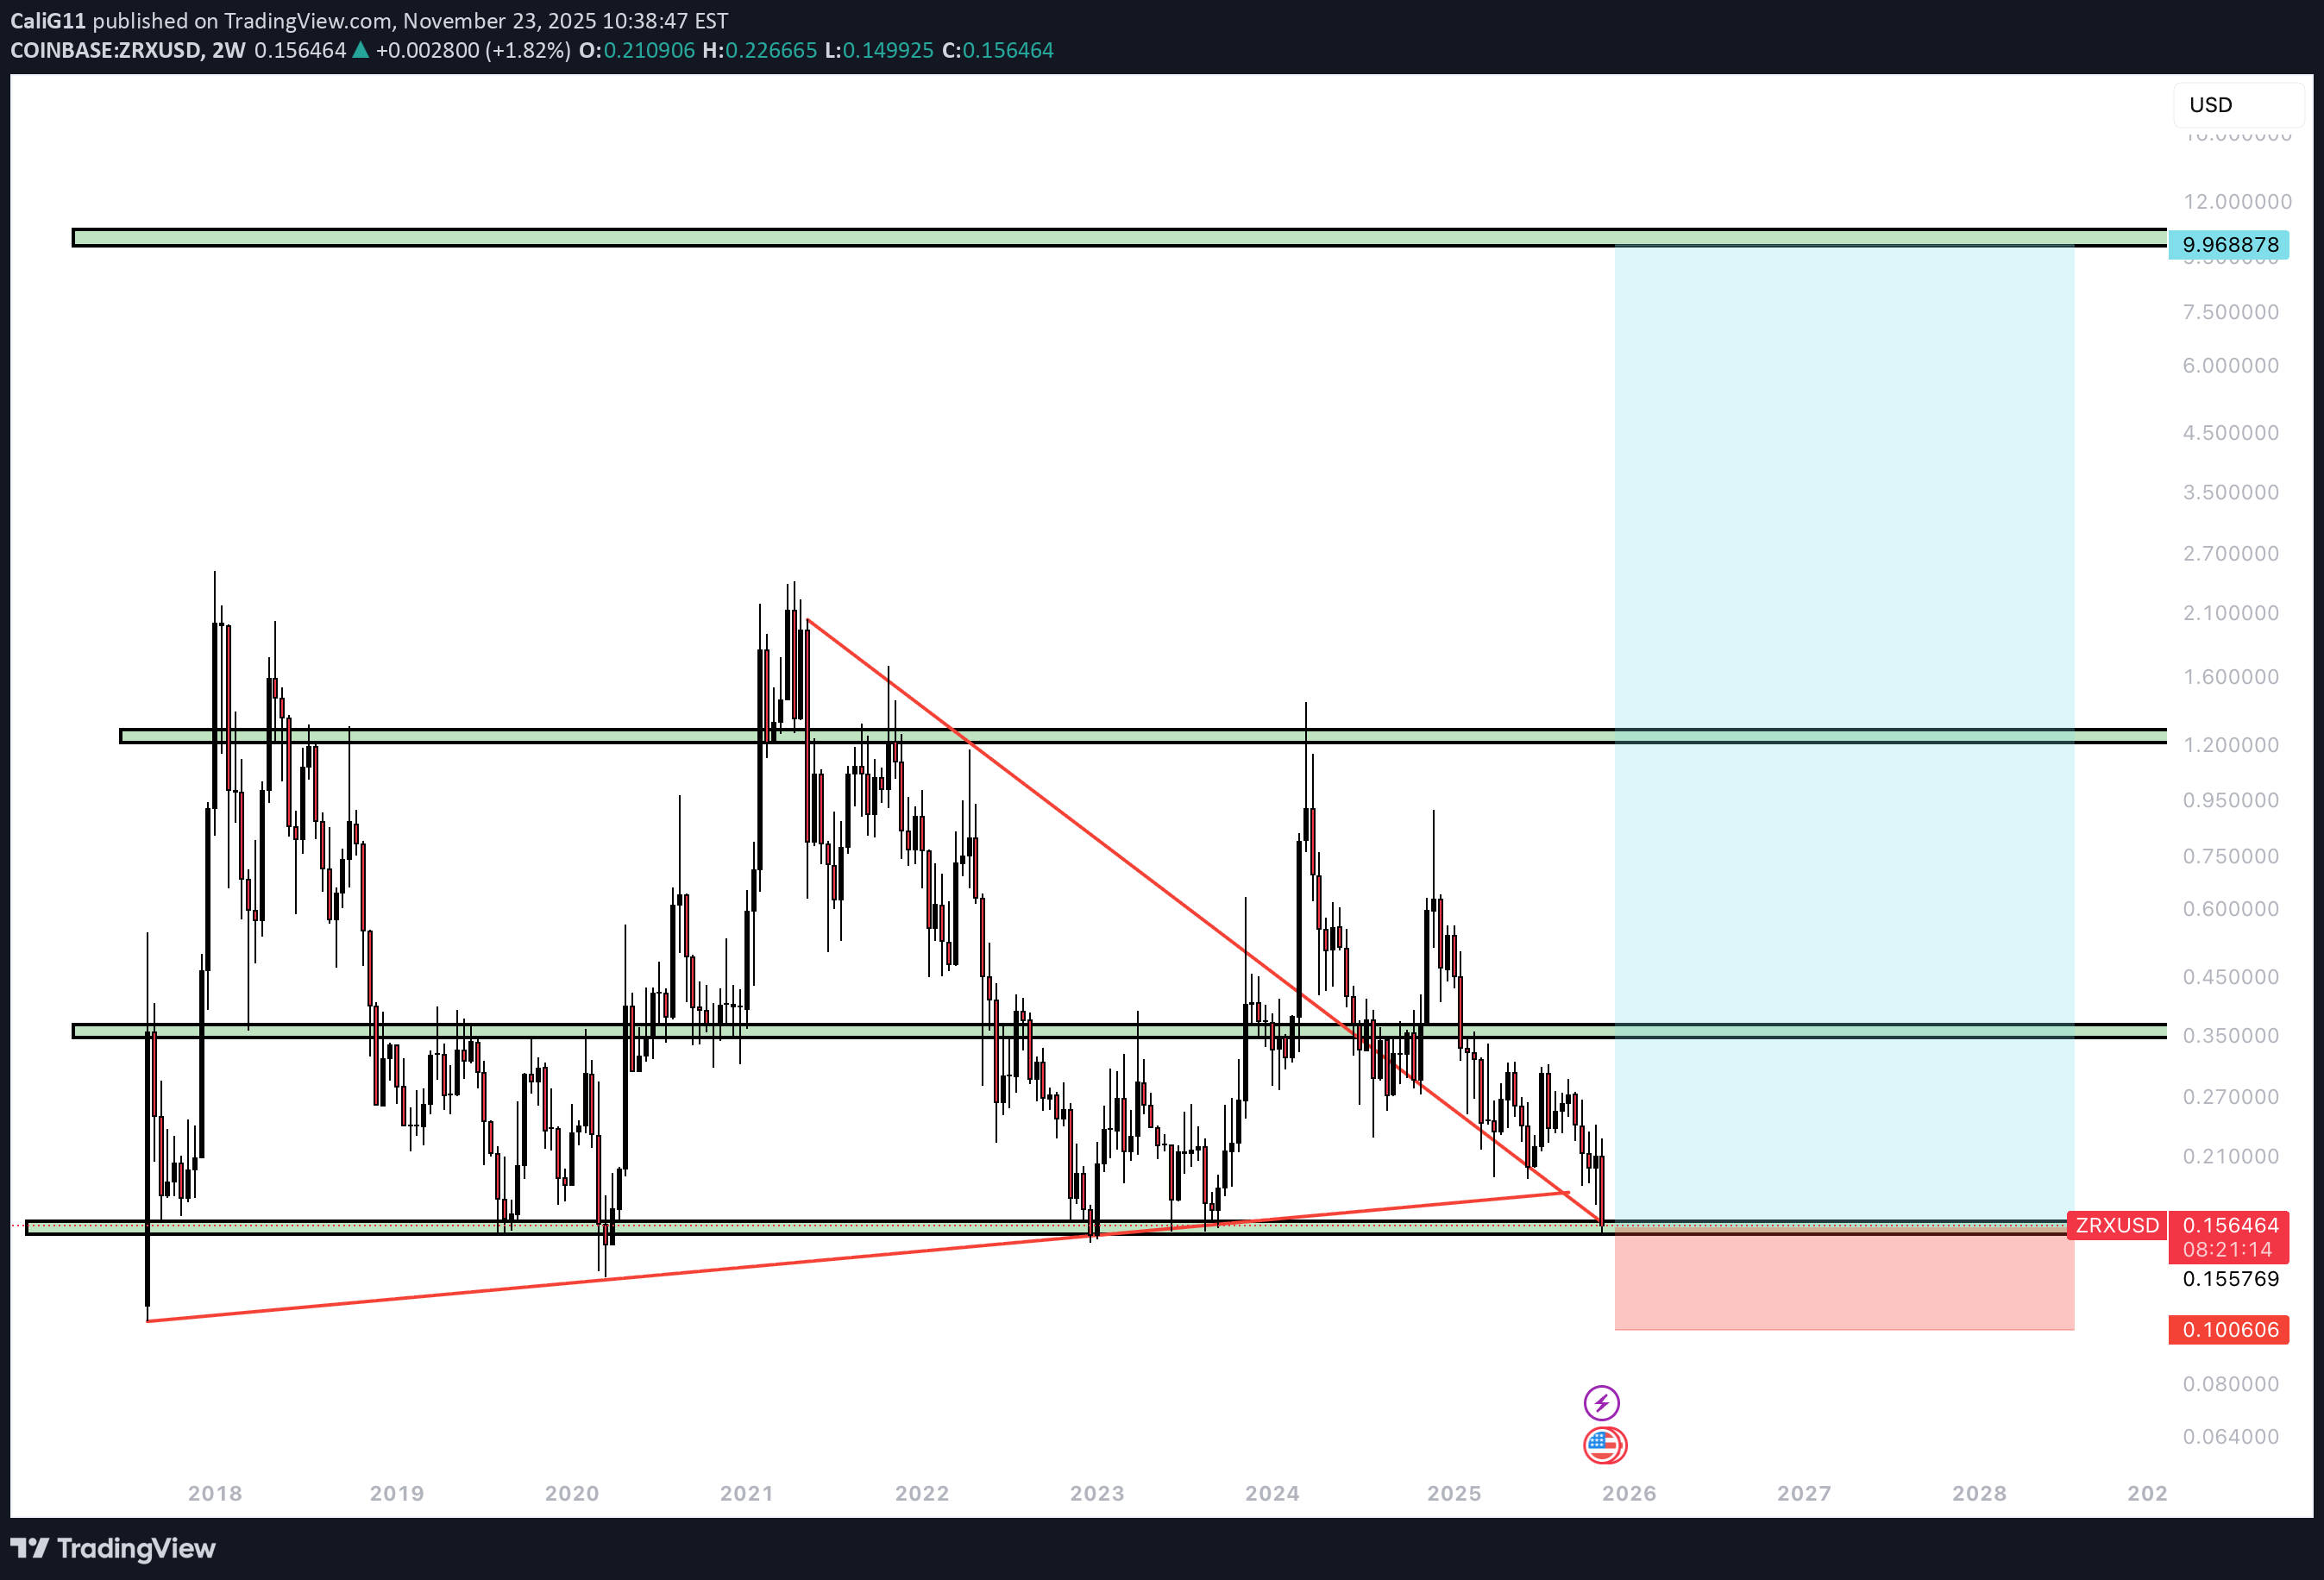
پروتکل 0x در کف تاریخی: آیا زمان ورود به بزرگترین جهش لایه 2 فرا رسیده است؟

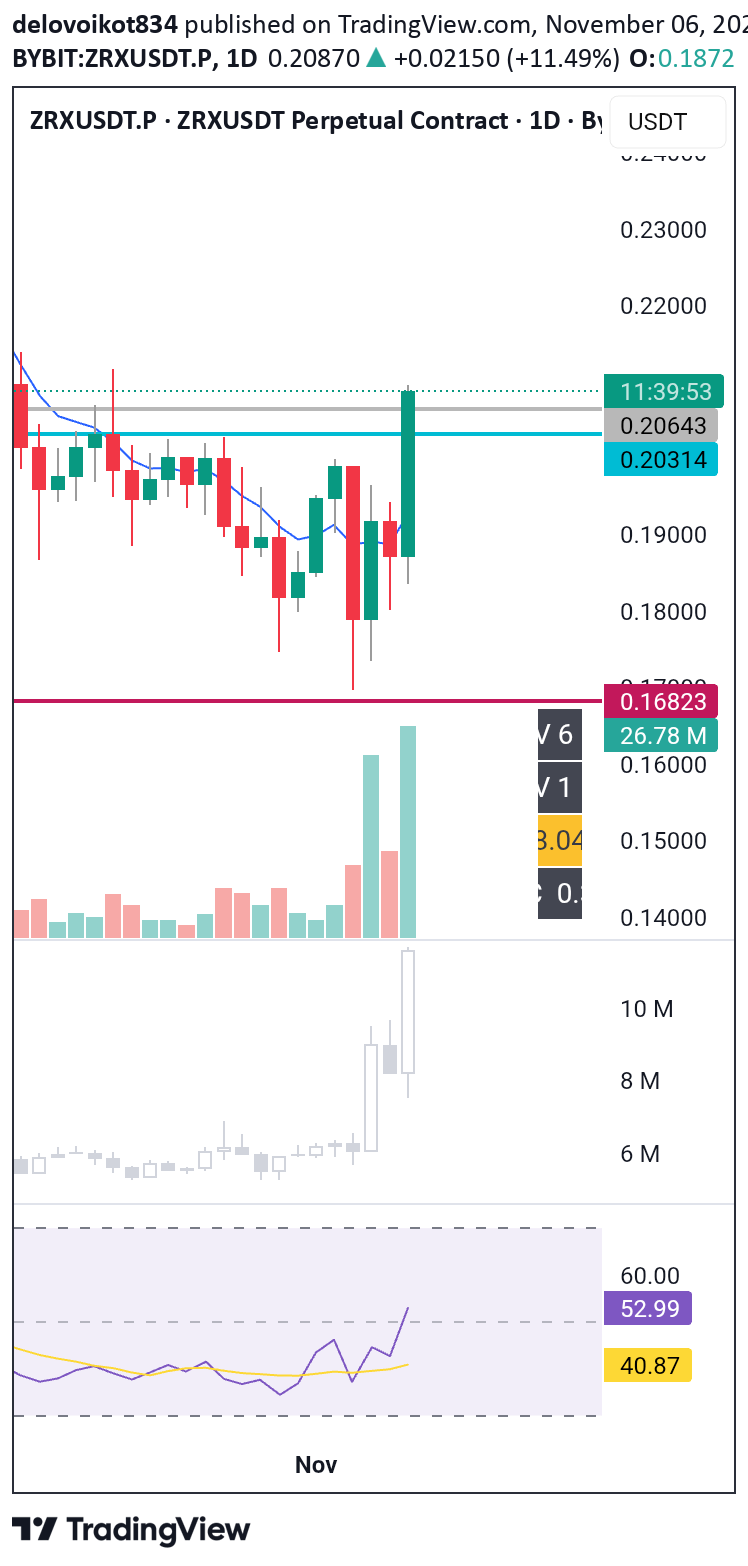
delovoikot834
شکست در رسیدن به هدف؛ درسهایی از ZRX که نباید فراموش کنید!
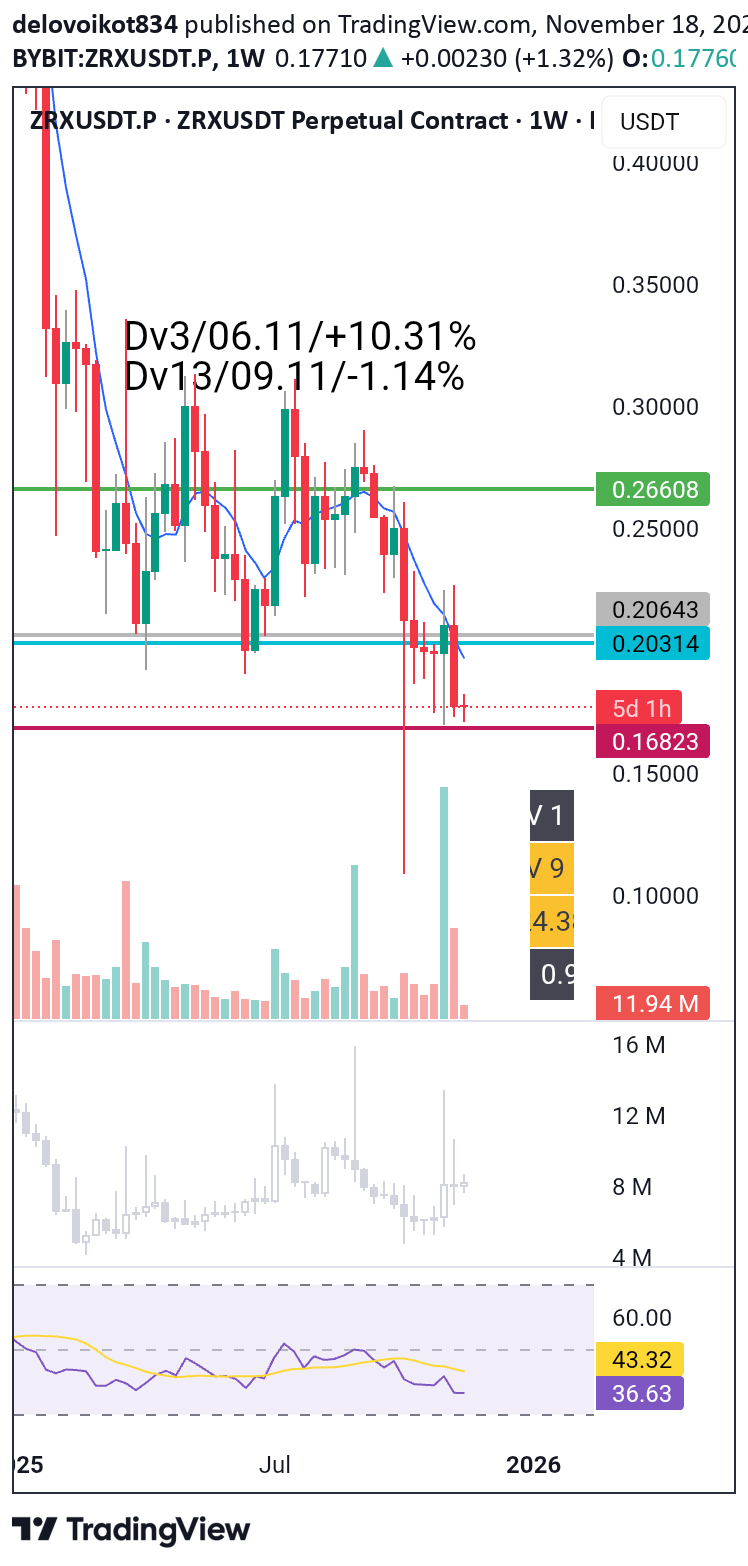
The goal that I had previously planned, unfortunately, did not reach its goal.

BandForBands
سرمایهگذاری انفجاری ZRX: پتانسیل سود 600 درصدی با شکست مقاومت!
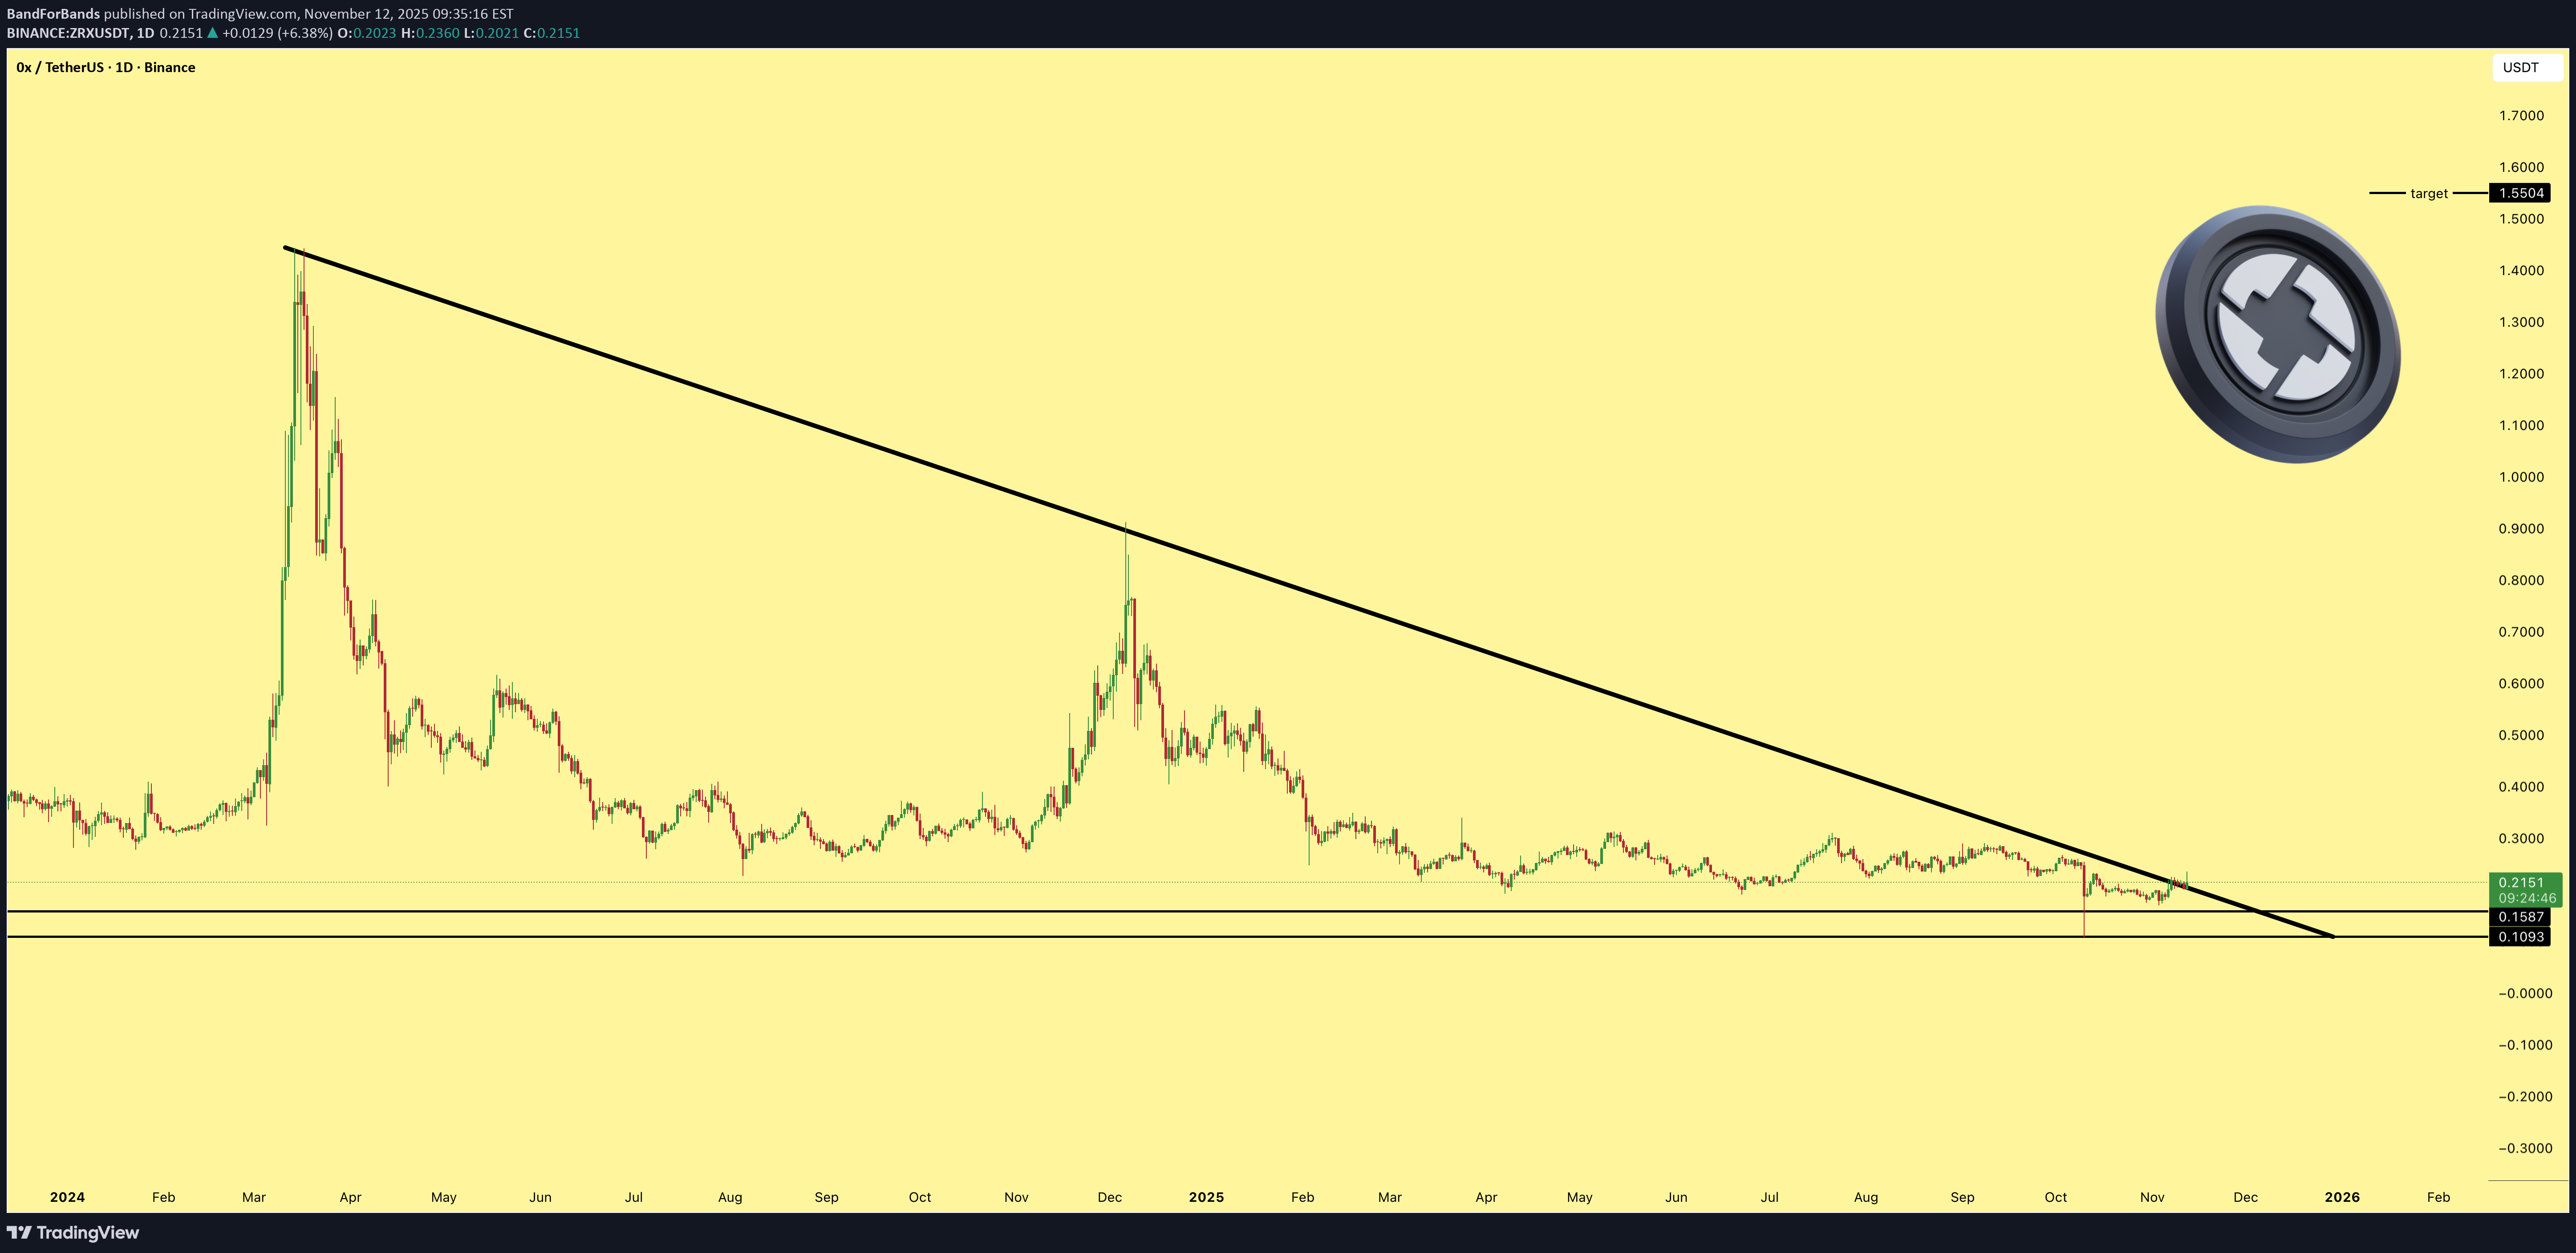
ZRX is breaking out from the resistance line, confirming the bullish structure. From current levels, there’s a potential 600% gain to be made as momentum builds and volume starts to rise. The breakout looks clean and the trend is shifting in favor of the bulls.

Arishtattarder
سیگنال لحظهای خرید ZRX: آیا آلت کوینهای قدیمی دوباره اوج میگیرند؟
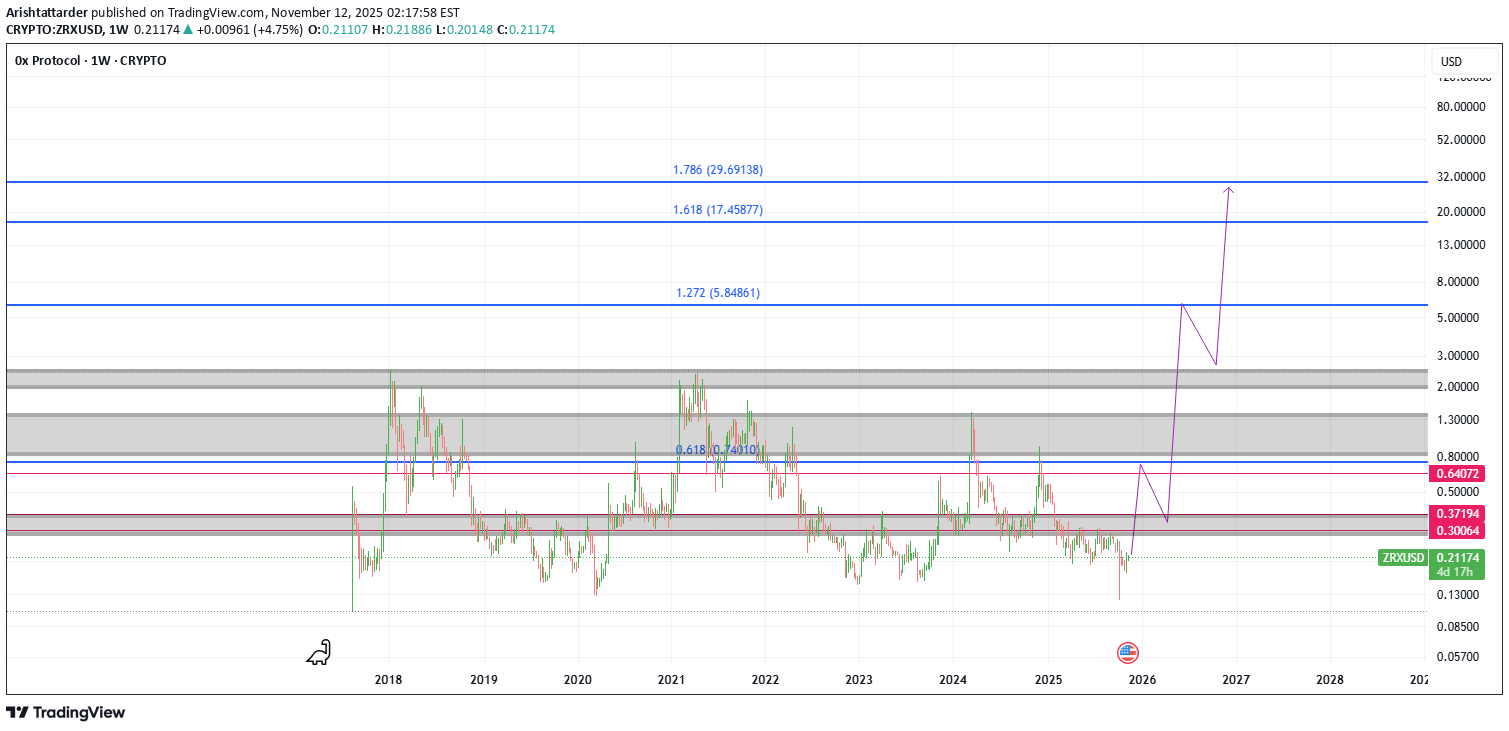
i think the old coins start their way, do your own research before buying any coins.
delovoikot834
Disclaimer
Any content and materials included in Sahmeto's website and official communication channels are a compilation of personal opinions and analyses and are not binding. They do not constitute any recommendation for buying, selling, entering or exiting the stock market and cryptocurrency market. Also, all news and analyses included in the website and channels are merely republished information from official and unofficial domestic and foreign sources, and it is obvious that users of the said content are responsible for following up and ensuring the authenticity and accuracy of the materials. Therefore, while disclaiming responsibility, it is declared that the responsibility for any decision-making, action, and potential profit and loss in the capital market and cryptocurrency market lies with the trader.