
ZETA
ZetaChain
| تریدر | نوع سیگنال | حد سود/ضرر | زمان انتشار | مشاهده پیام |
|---|---|---|---|---|
 CryptoAnalystSignalRank: 30996 | خرید | حد سود: تعیین نشده حد ضرر: تعیین نشده | 12/24/2025 |
Price Chart of ZetaChain
سود 3 Months :
سیگنالهای ZetaChain
Filter
Sort messages by
Trader Type
Time Frame
CryptoAnalystSignal
#ZETA/USDT Critical Support
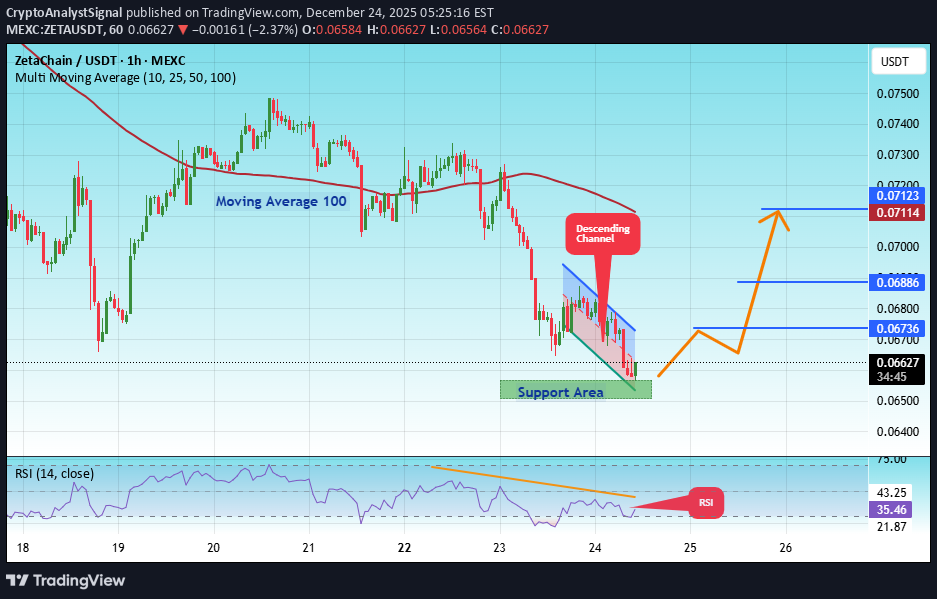
#ZETA The price is moving in a descending channel on the 1-hour timeframe. It has reached the lower boundary and is heading towards breaking above it, with a retest of the upper boundary expected. We have a downtrend on the RSI indicator, which has reached near the lower boundary, and an upward rebound is expected. There is a key support zone in green at 0.06230. The price has bounced from this level multiple times and is expected to bounce again. We have a trend towards consolidation above the 100-period moving average, as we are moving close to it, which supports the upward movement. Entry price: 0.06624 First target: 0.06737 Second target: 0.06886 Third target: 0.07123 Don't forget a simple principle: money management. Place your stop-loss order below the support zone in green. For any questions, please leave a comment. Thank you.#ZETA First target: 0.06737 Reached Second target: 0.06886 Reached#ZETA First target: 0.06737 Reached Second target: 0.06886 Reached Third target: 0.07123 Reached

behdark
تحلیل ZETA: پایان اصلاح و آغاز صعود هیجانانگیز (الگوی الماسی)
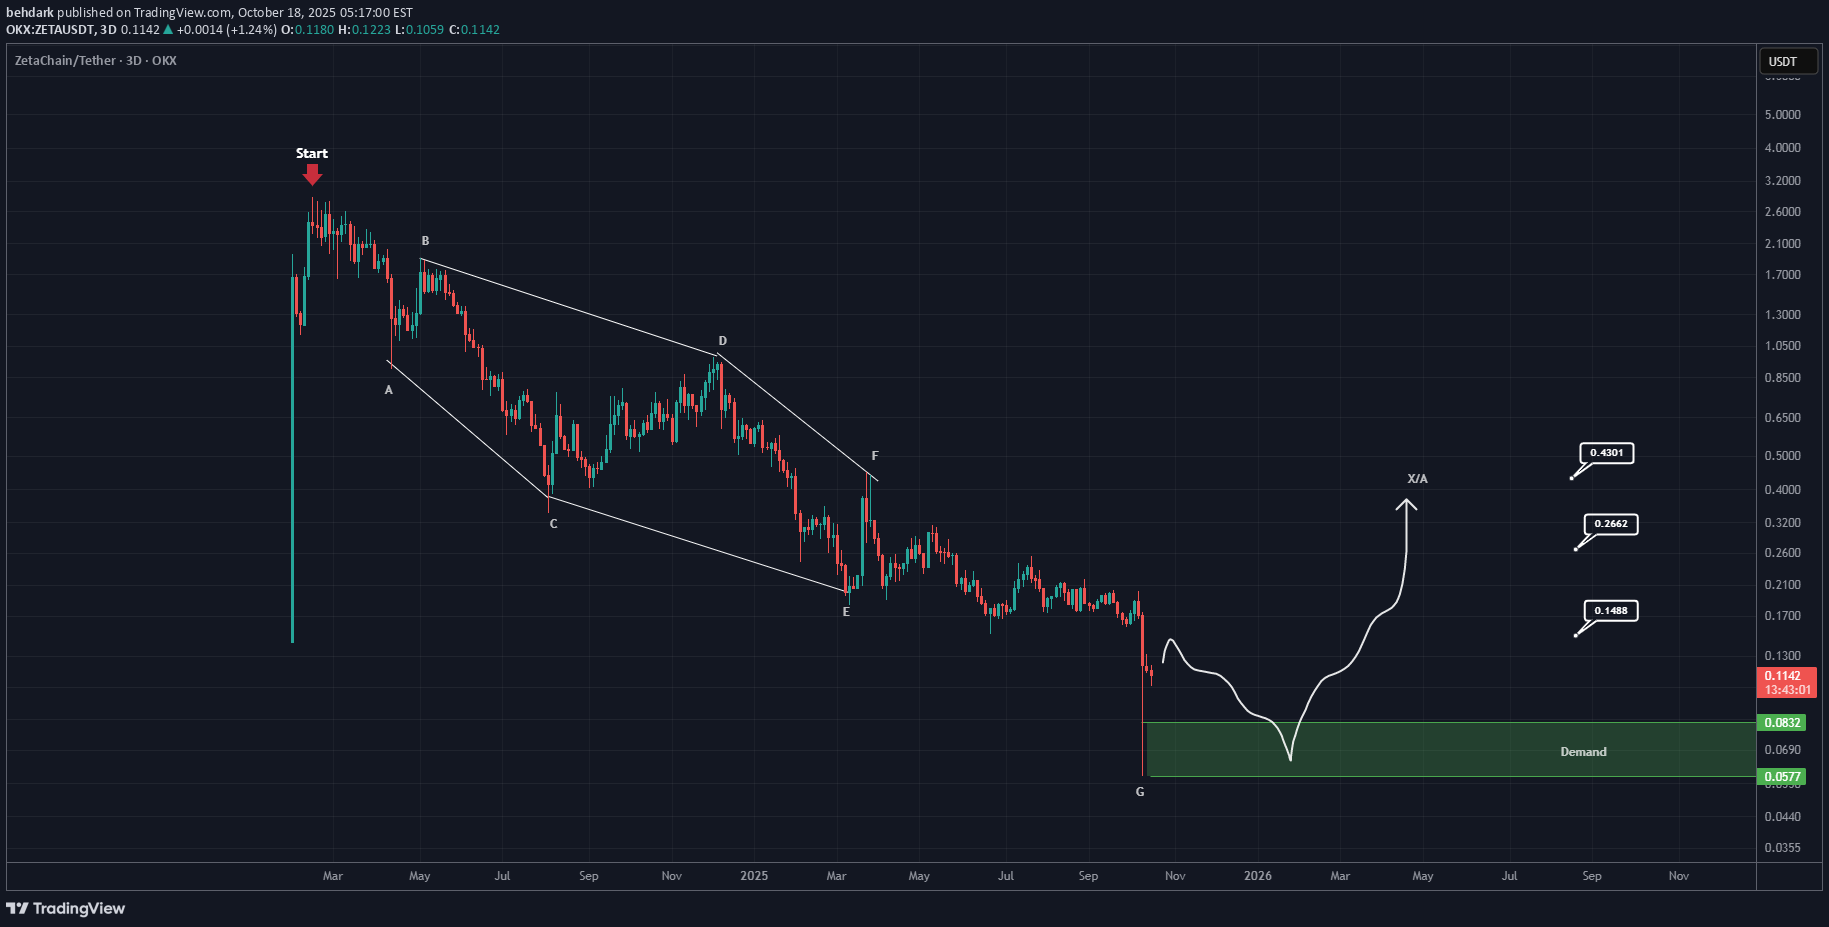
From the point where the red arrow is placed on the chart, it seems that ZETA’s correction has begun, and a diamond-shaped diametric pattern is nearing completion. It is expected that the correction will end around the green zone, after which the price may enter a bullish phase — this phase could either be an X-wave or a multi-legged upward pattern. Let’s wait and see how it unfolds. For risk management, please don't forget stop loss and capital management When we reach the first target, save some profit and then change the stop to entry Comment if you have any questions Thank You
CryptoAnalystSignal
#ZETA/USDT Critical Support
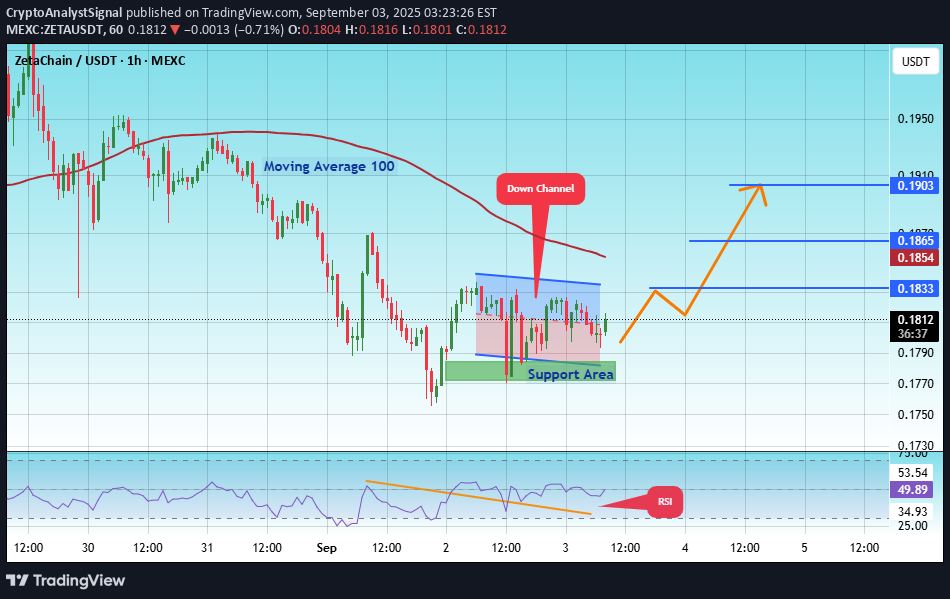
#ZETA The price is moving within a descending channel on the 1-hour frame, adhering well to it, and is heading for a strong breakout and retest. We have a bearish trend on the RSI indicator that is about to be broken and retested, which supports the upward breakout. There is a major support area in green at 0.1777, which represents a strong support point. For inquiries, please leave a comment. We are in a consolidation trend above the 100 Moving Average. Entry price: 0.1800 First target: 0.1833 Second target: 0.1865 Third target: 0.1900 Don't forget a simple matter: capital management. When you reach the first target, save some money and then change your stop-loss order to an entry order. For inquiries, please leave a comment. Thank you.#ZETA First target: 0.1833 Reached Second target: 0.1865 Reached Third target: 0.1900 Reached

shahmir1000
ZETAUSDT.P
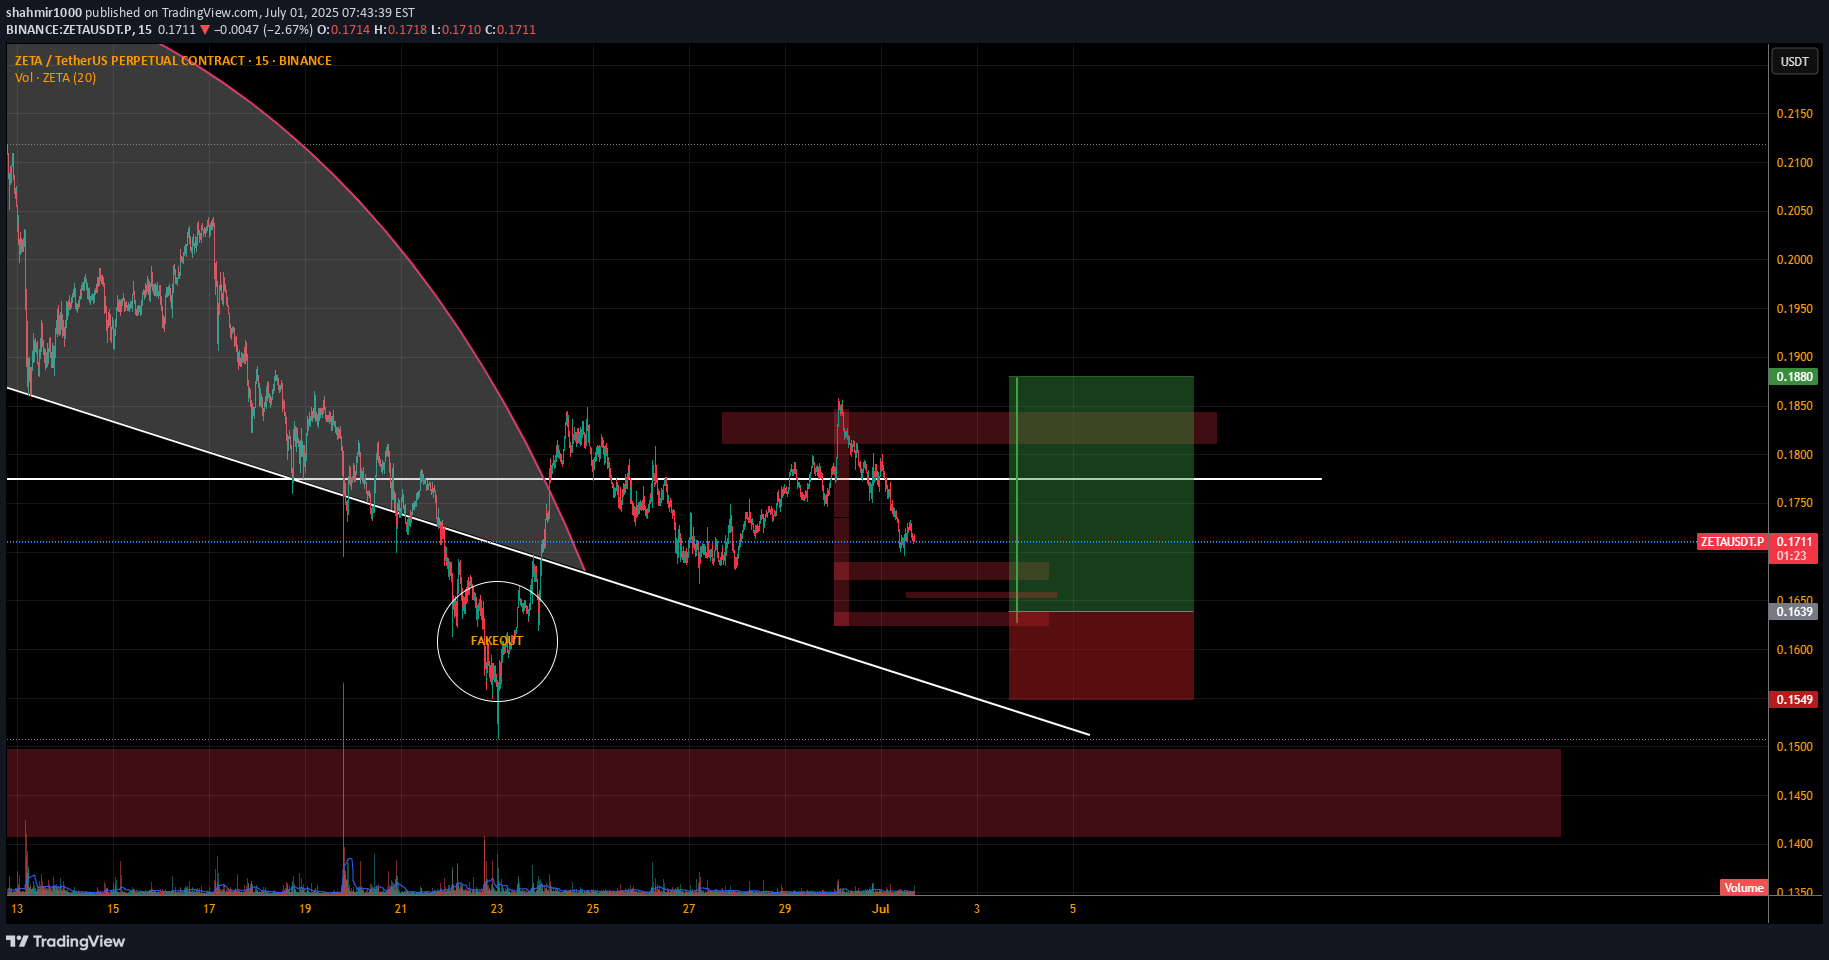
Waiting for the price to come at our level and only enter if we some bullish momentum. The setup has been marked. DYORThe entry was early as it should bullish momentum earlier.. sometimes it can happen.

M2it2M
ZetaChain
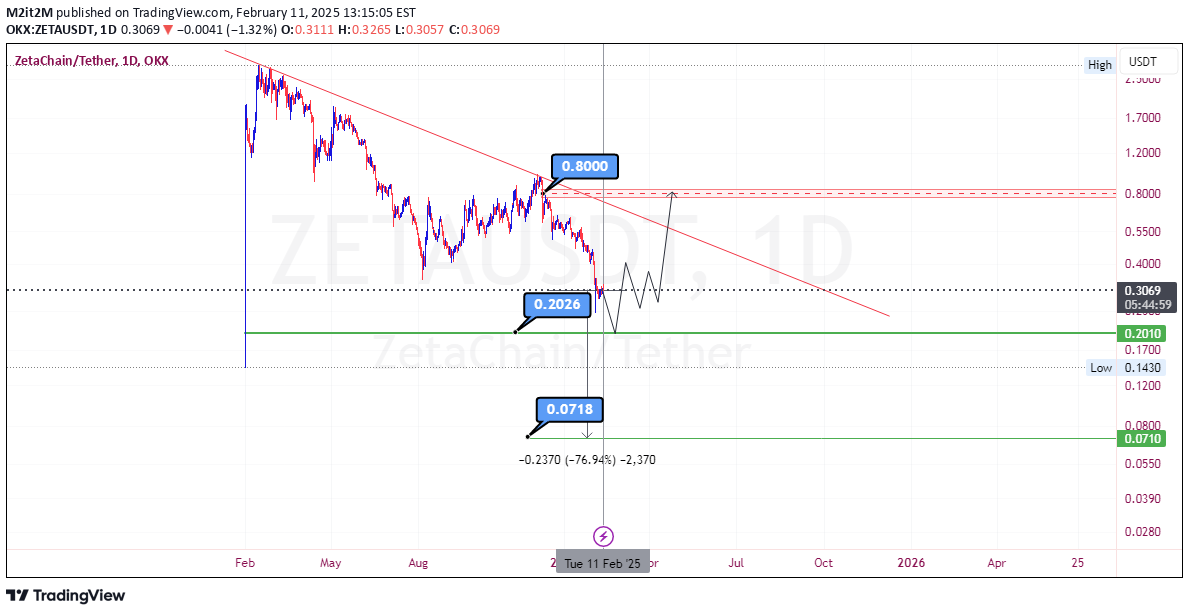
The price has currently corrected well. However, it is expected to correct another 20 to 30 percent. I see around $0.2026 as the bottom for this currency, and from there, it could start its move towards $0.8. If the bottom of $0.2026 is lost under any circumstances, there will be no barrier to holding the price, and it could drop to around $0.0718. Having this currency on your watchlist is not a bad idea.

bitcharger
$BYBIT:ZETAUSDT | Underrated ! Long way up.
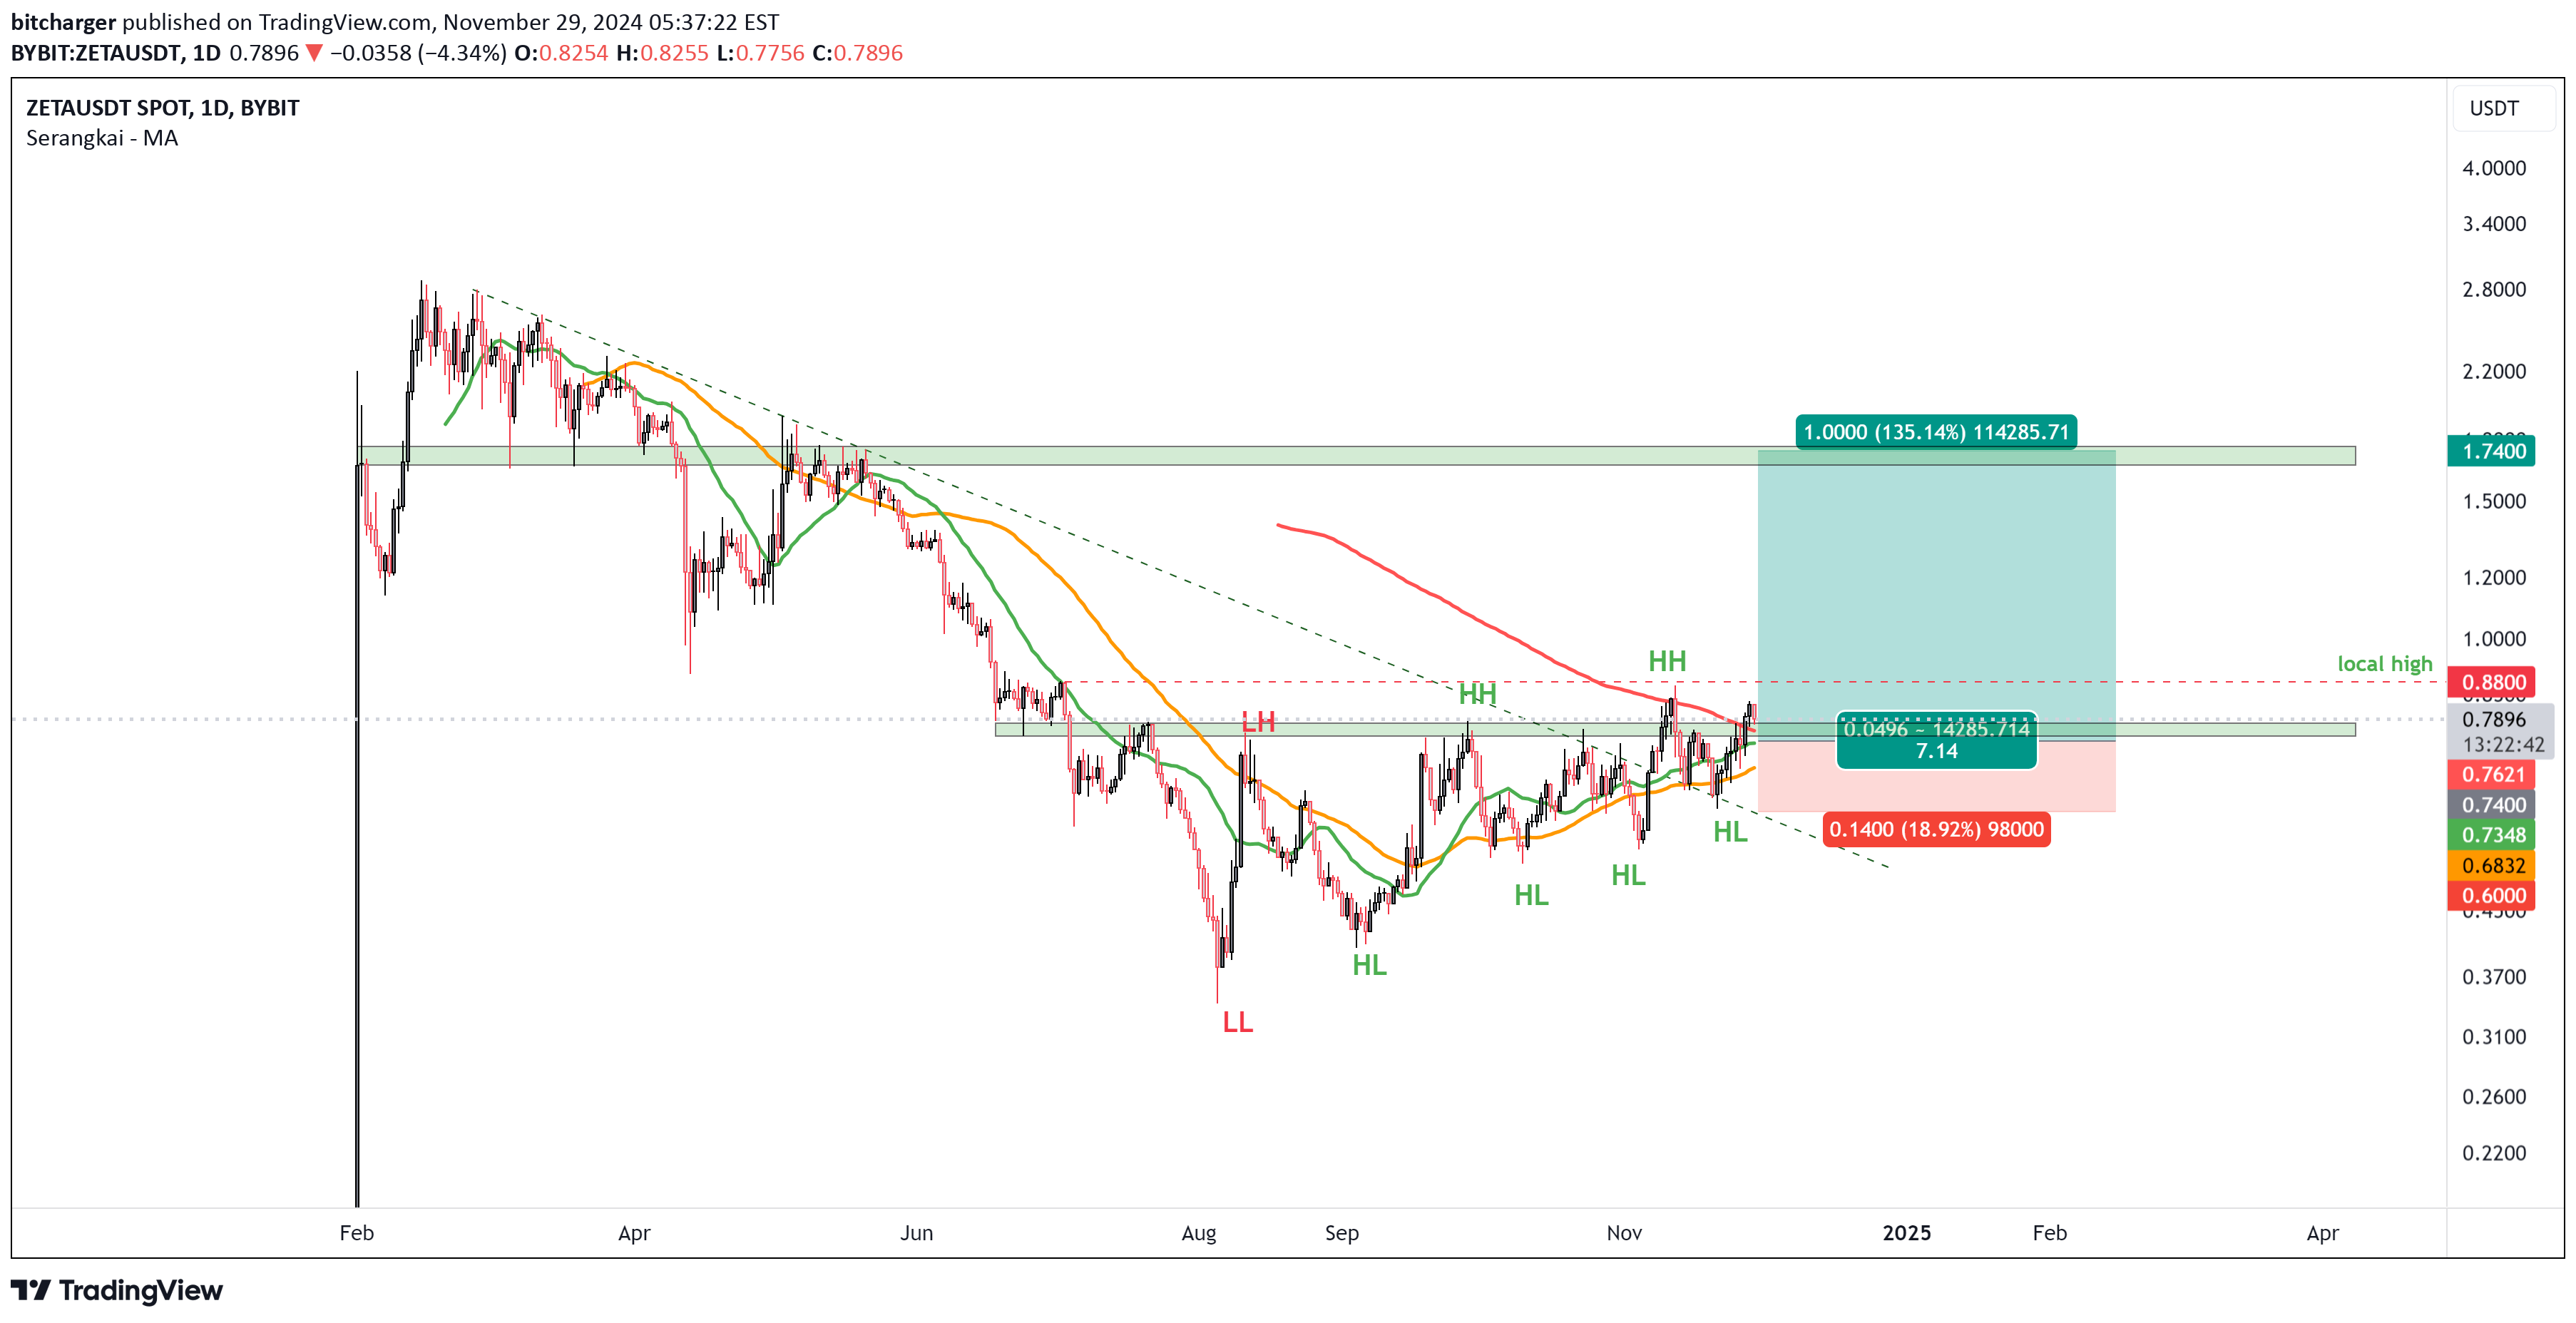
ZETAUSDT Here with another speculation about crypto assets. This time Zeta Chain with ZETA ticker. Let’s take a look at the project’s information: ZetaChain is the first Universal Blockchain with native access to Bitcoin, Ethereum, Solana, and more, offering seamless UX and unified liquidity to the next billions of users. ZetaChain is designed to be a decentralized cross-blockchain smart contract platform. The vision of ZetaChain is to be a public computer on all important blockchains, on top of which cross-blockchain decentralized applications can be easily built as public, trustless, and persistent smart contracts. Source: Zetachain.com, Zetachain “Whitepaper”. ZETA Market Cap: $ 383 m Market Cap Rank: 179 Market Price: 0.74 $ ATH: $ 2.7 (-72% now) ATL: $ 0.326 (+127% now) Technical highlights: - W1: Trend: Last LL created on Aug.2024 and since then price printed higher lows and higher highs (with a Bullish engulfing candle) indicating that trend is bullish. This pattern still valid till time of writing. There was a bearish trend line (series of LH and LL) that been broken by recent trend changes. Last week this trend line tested successfully as a support level. This is another positive vote for bullish trend alongside with other signs. (PS: it won’t be enough solely for change in trend) MA: The price managed to break above the MA 20 kept it self above it for the last 3 week with good volume to confirm its uptrend. RSI: Value is around 50 and is natural in weekly time frame. OBV: as you may know on balance volume is a momentum indicator that tries to show possible smart money movements but it can be inaccurate sometimes and it’s better to combine it with other indicators like MA or BB. Current OBV value and Bollinger bonds value votes for possible smart money flowing in. OBV with MA broken out and gives the same bullish signal. Volume: in last 4 months we can easily see the volume surge. The volume increase at the end of rallies signs for possible trend reversal. This must be checked with OBV, RSI and other indicators for clearer result. In my point of view volume matched current bullish trend and they are in the same direction. - D1: Trend: The major barrier at $ 0.75 to $ 0.78 has been removed and absorbed by buy orders. This level been a major resistance level for more than 4 months. Just like what we’ve seen in W1 chart bearish trend line broken and tested as support with solid move. MA: price moves above all key Mas like 10,20,50,200 in daily time frame. 2 days ago last critical MA (MA200) broken successfully. This move comes into my attention because this level was a horizontal resistance level too (above mentioned). So this break out shows strength in this move and signals green candles ahead. RSI: RSI is 57 and has more room to get more strength. I expect to see RSI to follow uptrend soon. As long as it values more than 53.5, I remain bullish for the trend direction. Like most other altcoins, there is a golden cross in the MAs about to happen. That signals more uptrend in the coming days. Supports: $ 0.76 Ma200 in D1 $ 0.68 MA50 in D1 Resistances: $ 0.88 D1 Local high $ 1.12 - $ 1.35 $ 1.65 to $ 1.75 supply zone Conclusion: All these opinions are mine and can be wrong, so please DYOR. According to its use cases and small market cap I think this project has a great potential to grow more and ascend in market cap ranking, and I will buy in steps and after confirmation of a successful S/R test on MA200 in daily time frame. If price managed to absorb/break $ 1.75 supply level I will update this chart. My strategy goes as below: 🛒 Pair: ZETA/ USDT 🛒 👑 Bitcharge 👑 🕰 29/11/2024 🕰 POSITION: 🟢"Buy"🟢 2 % of capital 🛒 Buy1: $ 0.73 – $ 0.77 🛒 🛒 Buy2: $ 0.65 – $ 0.68 🛒 DCA 👉Sell Targets👈 🎯TP1: $ 0.88 🥉 🎯TP2: $ 0.98 🥈 🎯TP3: $ 1.12 🥇 🎯TP4: $ 1.22 🚁 🎯TP5: $ 1.35 ✈️ 🎯TP6: $ 1.49 🚀 🎯TP7: $ 1.65 🛰 🎯TP8: $ 1.74 🛰 ⛔️ SL: $ 0.60 ⛔️ by closing D1 Below Your support gives me more energy to carry on...Moving

s0ckchanhkute
#ZETA CHAINNN 4H LUCK GOOD FOR TAGERT
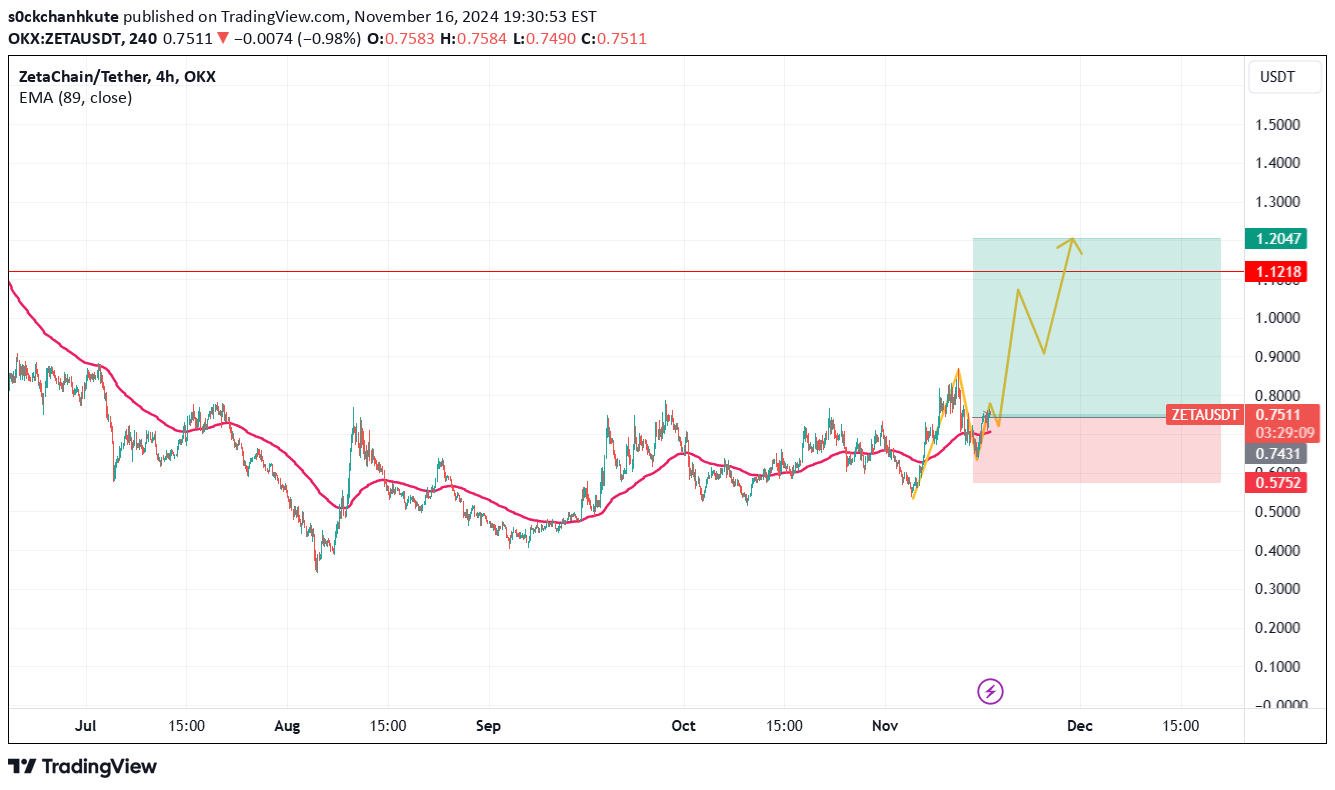
Today, I will review several Layer 1 projects that have the potential for significant short-term growth. Please check my chart. Zeta Chain is a high-performance, decentralized blockchain platform designed to address the scalability and security challenges faced by traditional blockchains. It aims to provide a robust infrastructure for decentralized applications (dApps) and smart contracts, enabling faster transaction speeds and lower feeswe have a lower entry point than expected, buy at this point tagert unchanged

TheAlchemist888
Z for ZETA - Breakout - Reversal
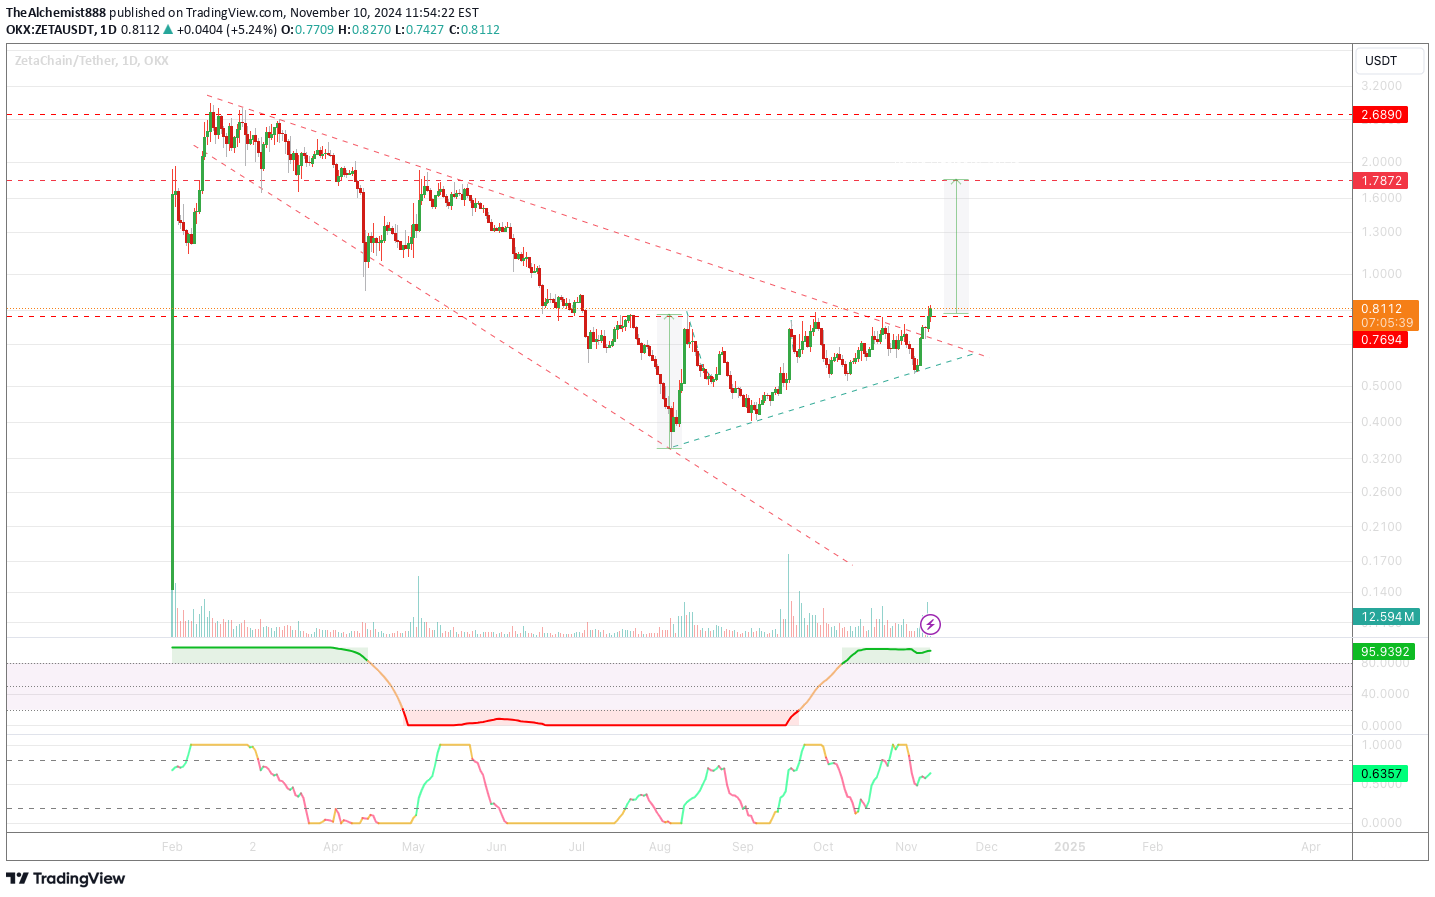
Ascending Triangle, bottomed out and reversal in motion of downtrend breakout. The chart is pretty self explanatory. Careful with risk management.After the breakout, the price retested the triangle and found support 2 times. Now there is only the major horizontal resistance left to start its move towards the target.Zeta keeps on disappointing. I am guessing this is something to do with the unlock schedule of the token vesting. I probably wont be buying anymore vested coins as they tend the get heavy selling pressure as we experienced here with Zeta. Narrative is good, brand is great, chart looks great, did its retest even after breakout but kept on getting sold. Not a good look.

ZETAUSDT.P TECHNICALS - 18AUG2024
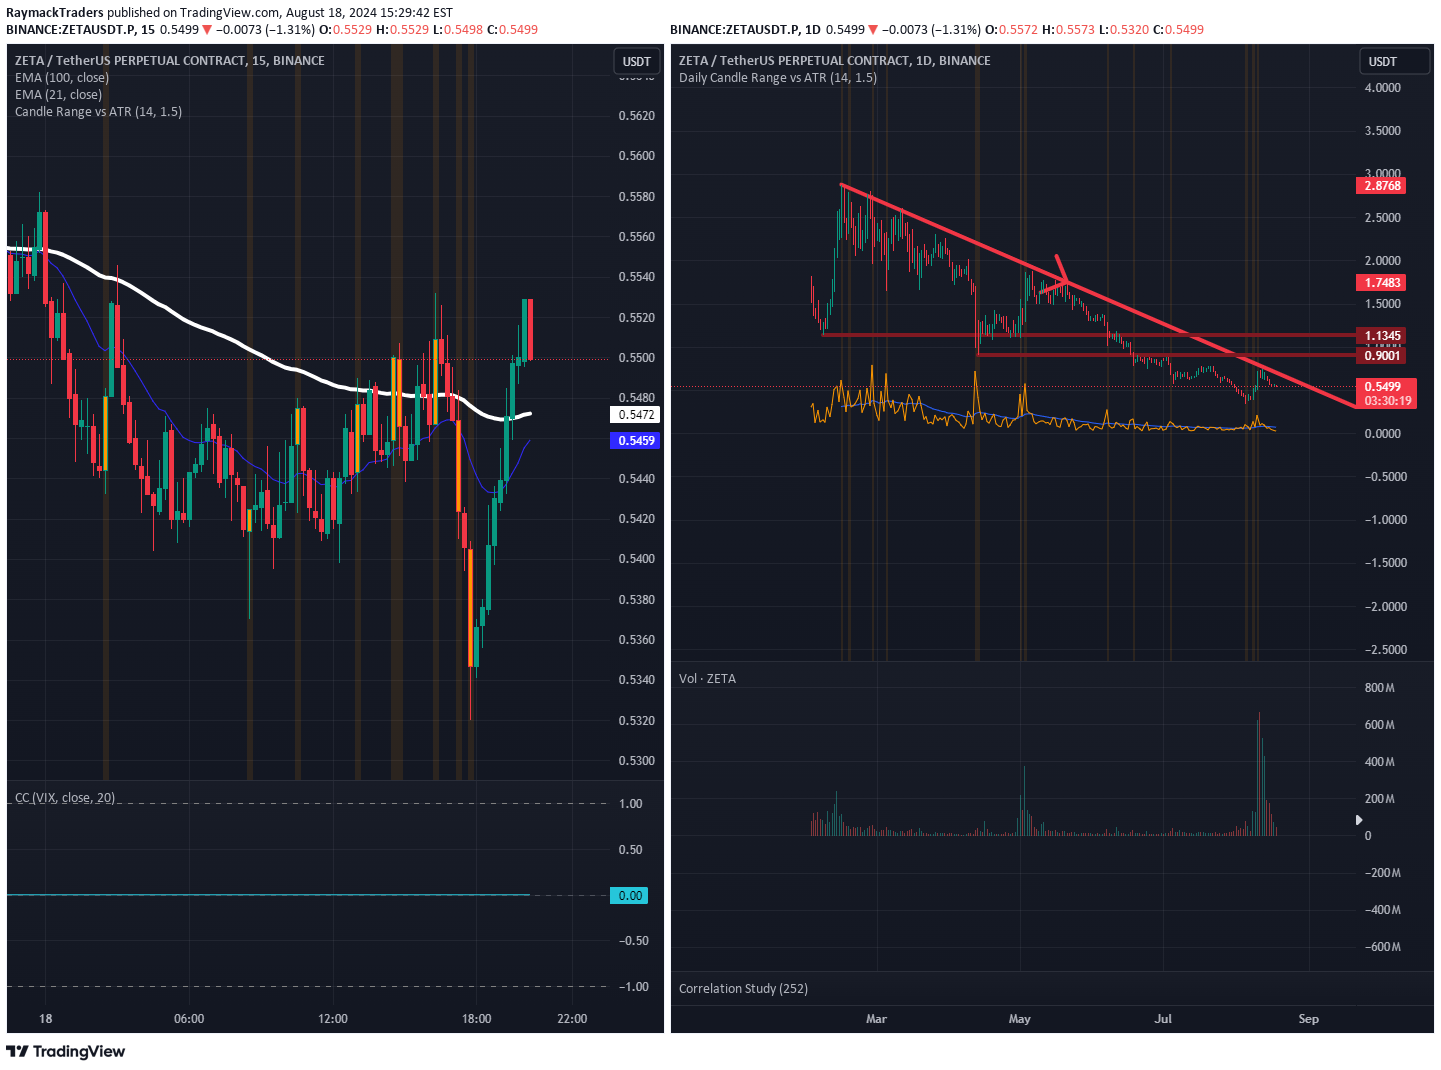
ZETAUSDT.P TECHNICALS - 18AUG2024 - waiting to see what price action and volume decides

nkryan
Zeta Long Idea
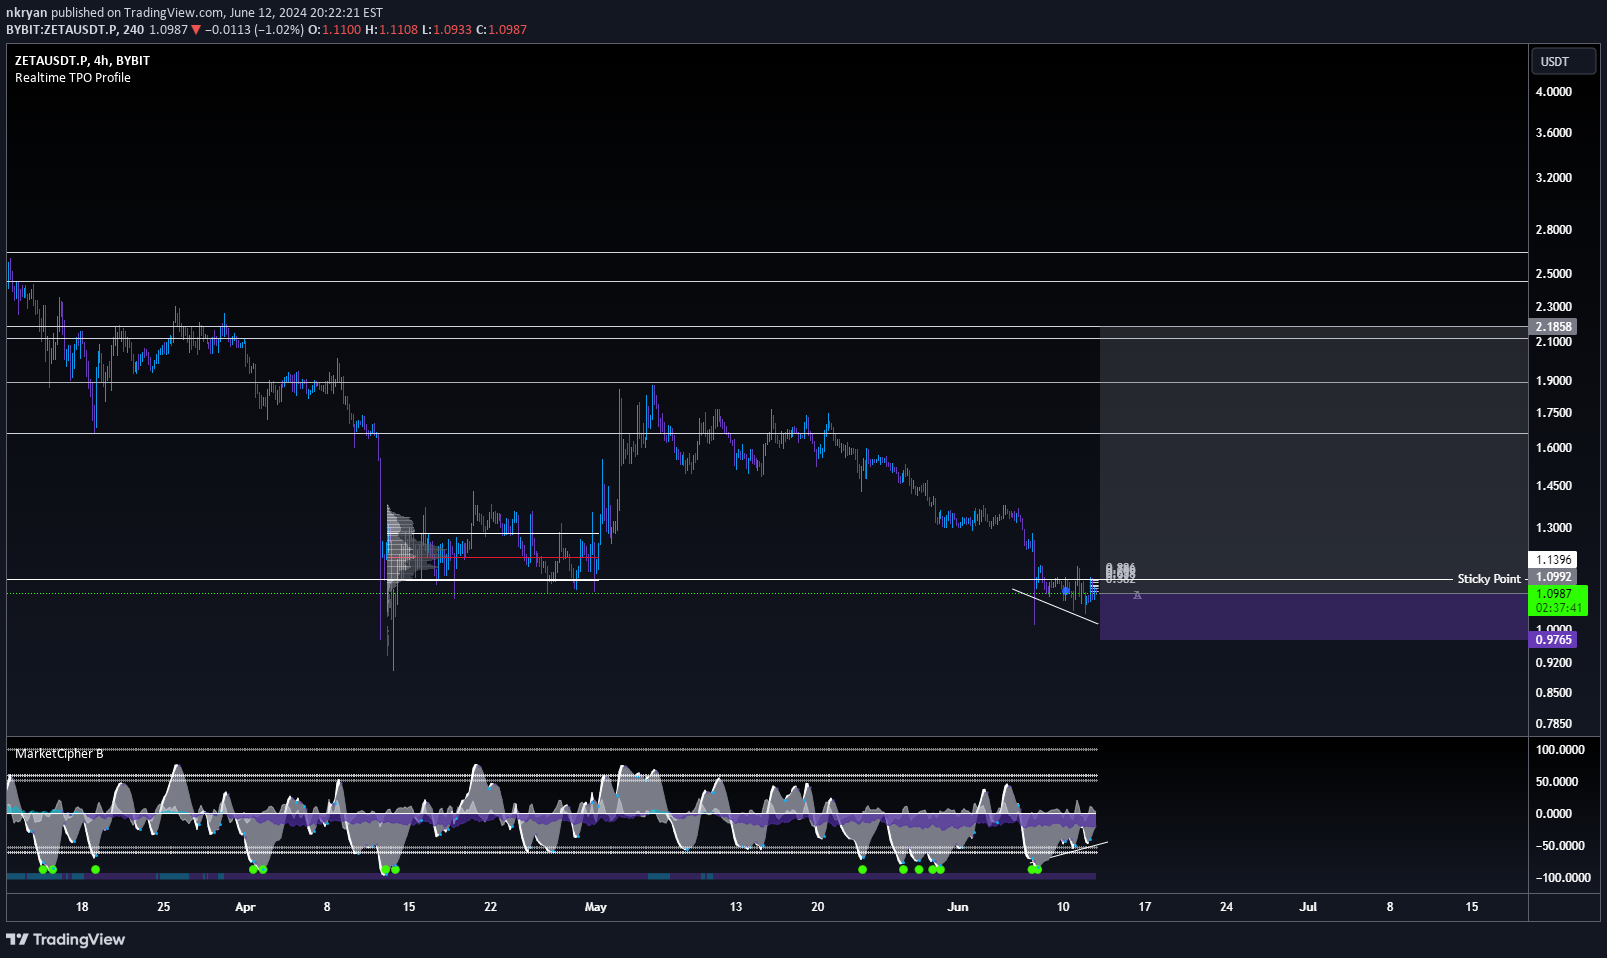
Hello Traders, I've identified a compelling long opportunity on ZETA cryptocurrency. We've hit a sticky point and are currently seeing a 4-hour bullish divergence on Market Cipher B. This setup suggests that a long position could be favorable. Key Points: Sticky Point Hit: ZETA has reached a significant support/resistance level, indicating a potential pivot. 4H Bullish Divergence on Market Cipher B: This divergence is a strong indicator of a possible upward move, making it an ideal entry point for a long position. Target: Golden Pocket Zone: Our target for this long trade is the golden pocket zone, a crucial Fibonacci retracement level known for its high probability of price reversal.
Disclaimer
Any content and materials included in Sahmeto's website and official communication channels are a compilation of personal opinions and analyses and are not binding. They do not constitute any recommendation for buying, selling, entering or exiting the stock market and cryptocurrency market. Also, all news and analyses included in the website and channels are merely republished information from official and unofficial domestic and foreign sources, and it is obvious that users of the said content are responsible for following up and ensuring the authenticity and accuracy of the materials. Therefore, while disclaiming responsibility, it is declared that the responsibility for any decision-making, action, and potential profit and loss in the capital market and cryptocurrency market lies with the trader.