
WLD
Worldcoin
| تریدر | نوع سیگنال | حد سود/ضرر | زمان انتشار | مشاهده پیام |
|---|---|---|---|---|
No results found. | ||||
Price Chart of Worldcoin
سود 3 Months :
خلاصه سیگنالهای Worldcoin
سیگنالهای Worldcoin
Filter
Sort messages by
Trader Type
Time Frame

CryptoAnalystSignal
پیشبینی پامپ بزرگ WLD/USDT: زمان ورود، اهداف قیمتی و استراتژی مدیریت ریسک!
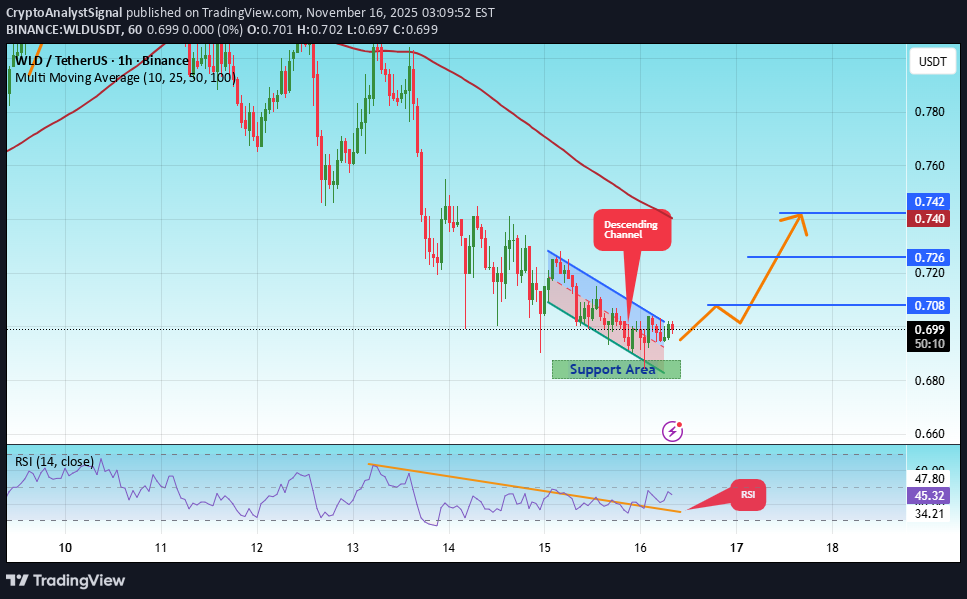
#WLD The price is moving within an ascending channel on the 1-hour timeframe and is adhering to it well. It is poised to break out strongly and retest the channel. We have a downtrend line on the RSI indicator that is about to break and retest, which supports the upward move. There is a key support zone in green at the price of 0.683, representing a strong support point. We have a trend of consolidation above the 100-period moving average. Entry price: 0.698 First target: 0.708 Second target: 0.726 Third target: 0.740 Don't forget a simple money management rule: Place your stop-loss order below the support zone in green. Once the first target is reached, save some money and then change your stop-loss order to an entry order. For any questions, please leave a comment. Thank you.

BandForBands

Literaryflavus
حمایت حیاتی WLD: آیا منتظر صعود بزرگ هستیم؟ (به شرط عدم خبر بد)
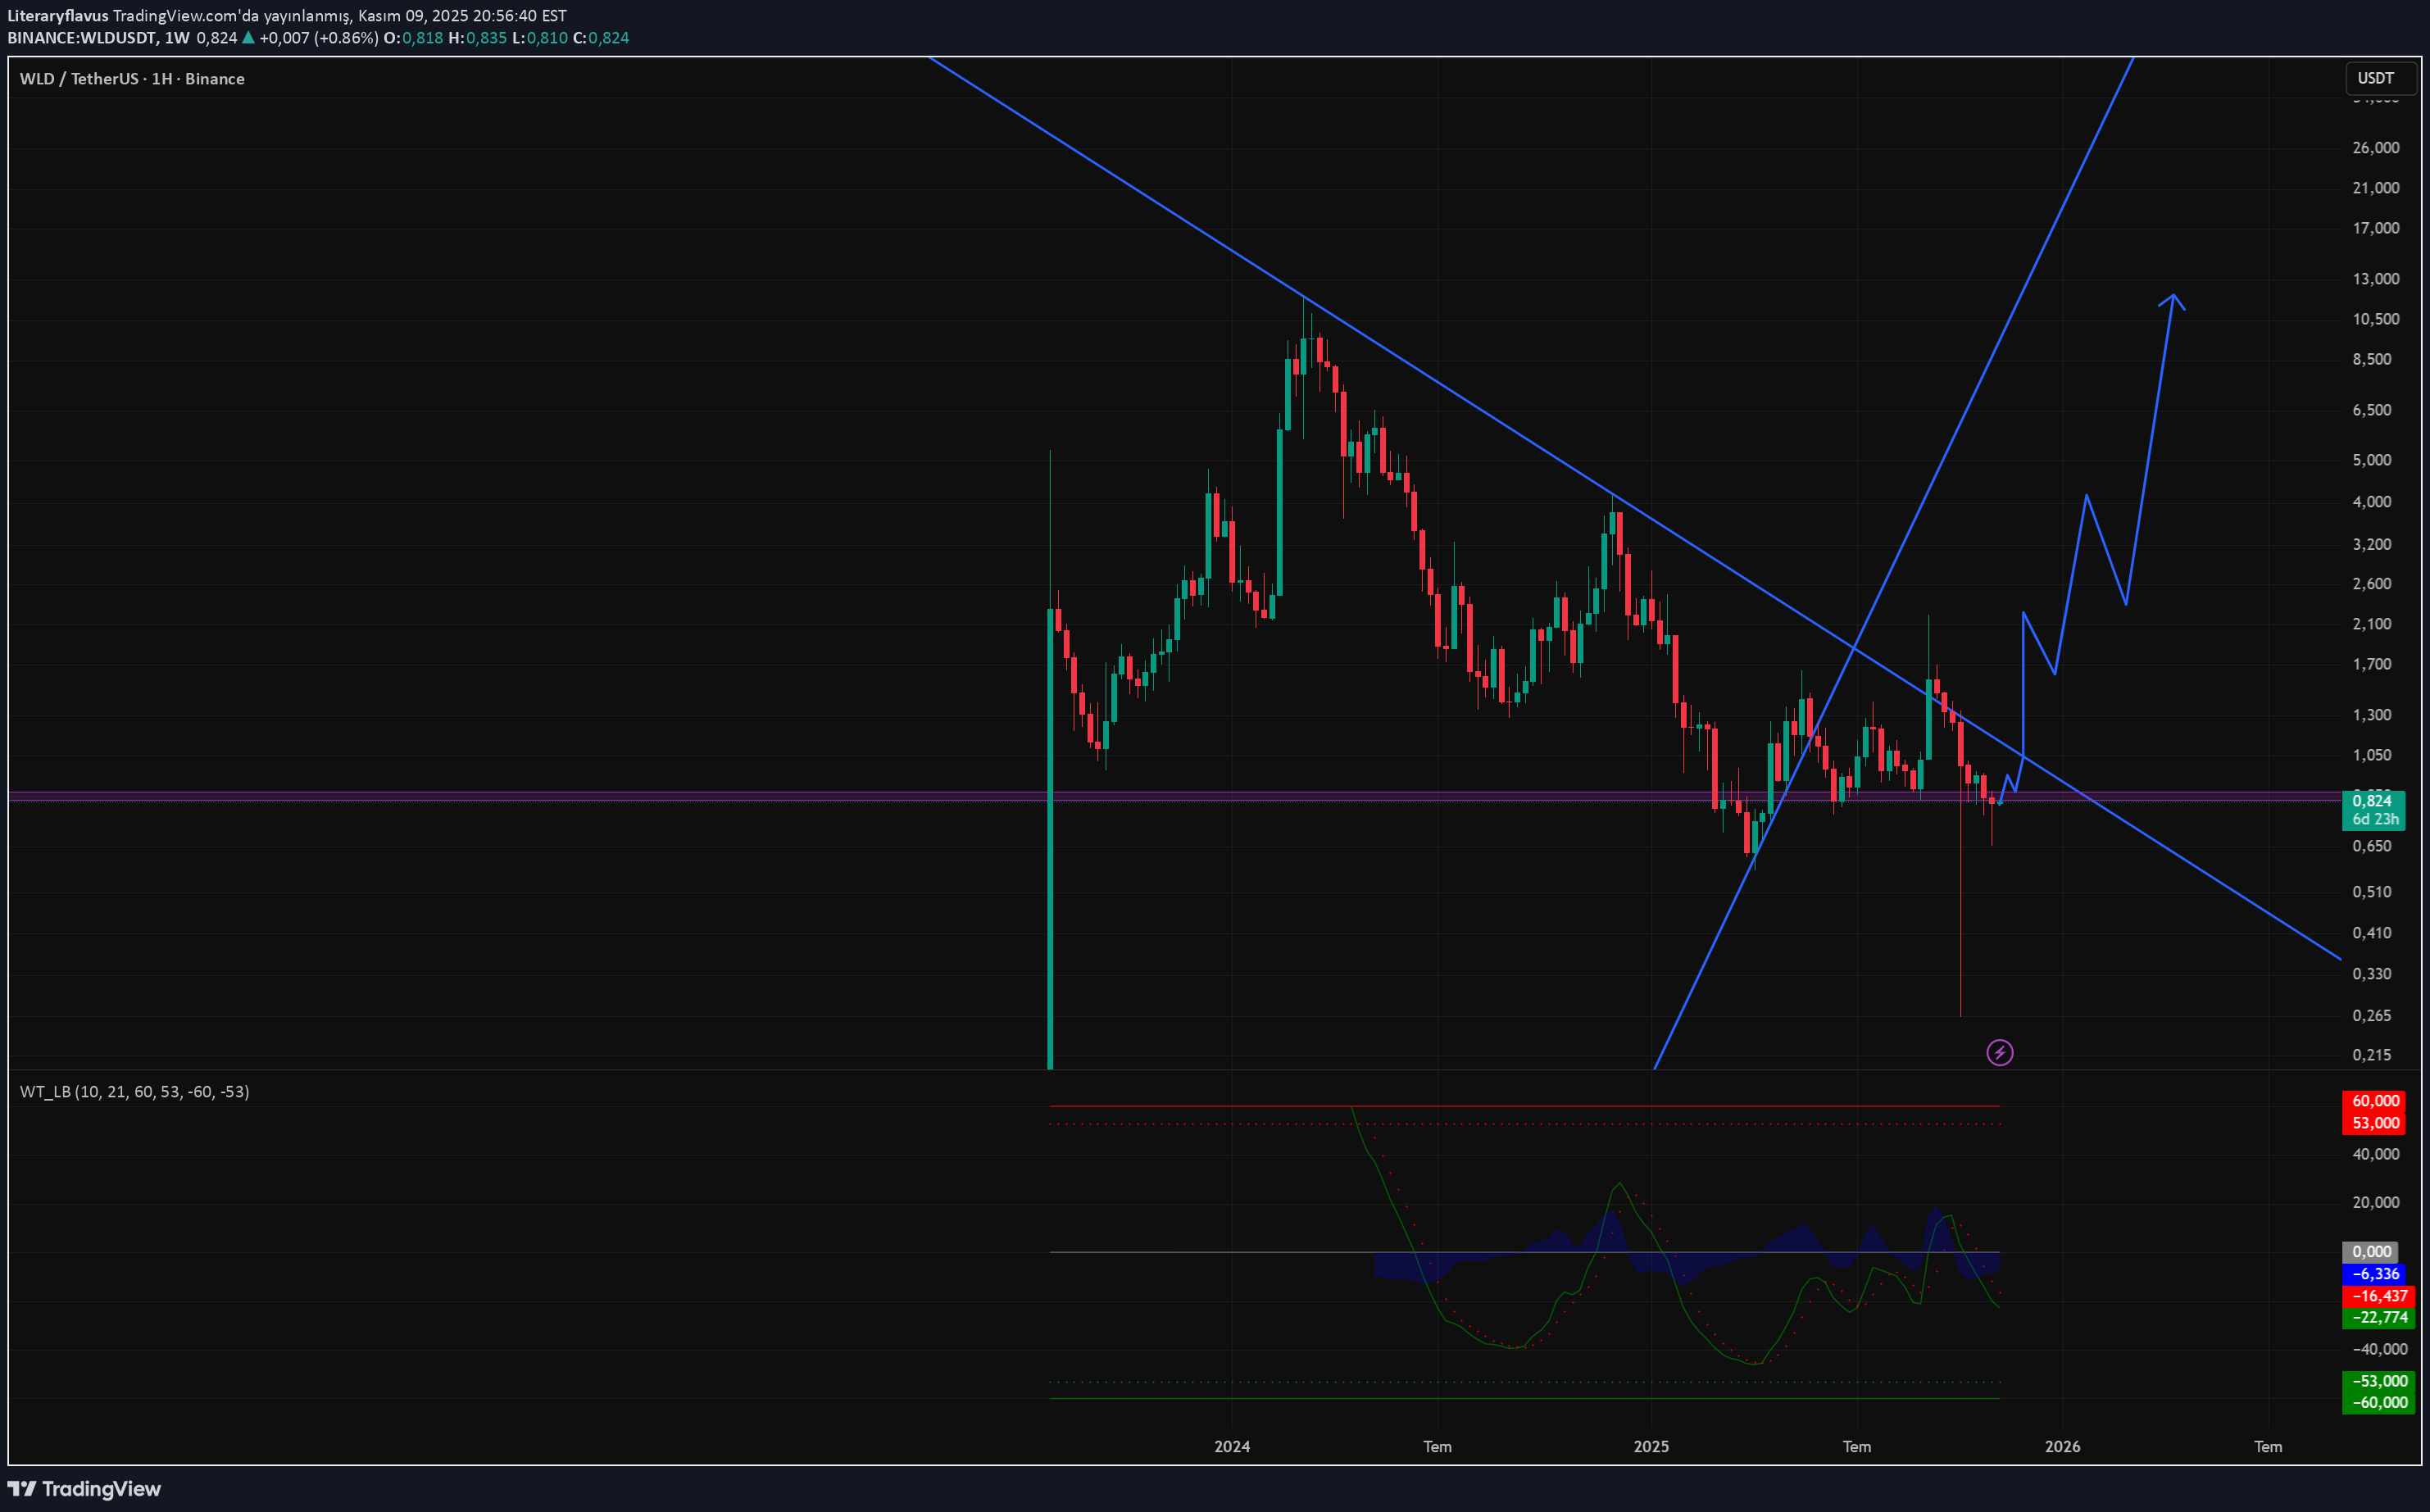
I expect it to rise from here. If there is no negative news. YTD SAYS
CryptoAnalystSignal
پیشبینی انفجار قیمت WLD/USDT: کانال صعودی، شکست RSI و اهداف بزرگ!
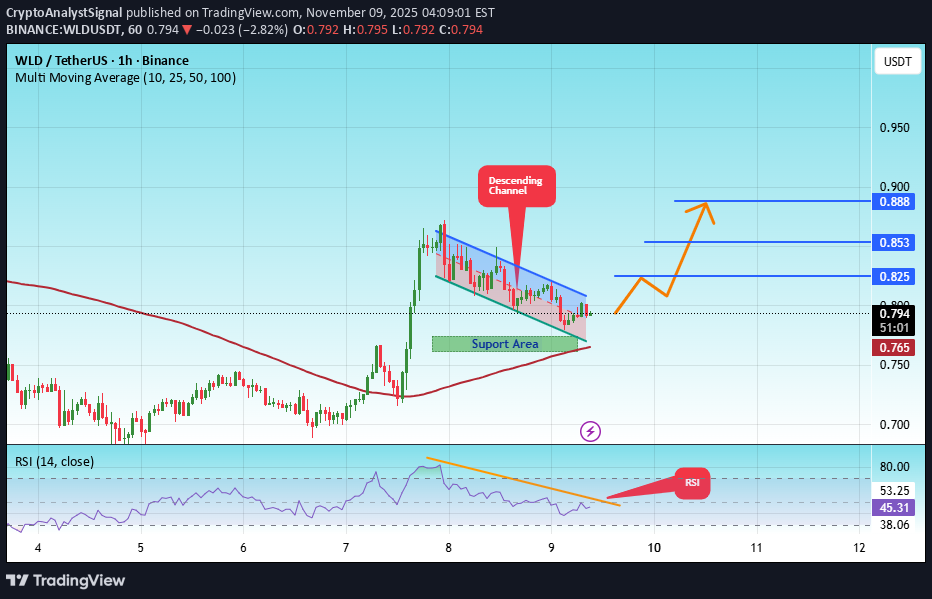
#WLD The price is moving within an ascending channel on the 1-hour timeframe and is adhering to it well. It is poised to break out strongly and retest the channel. We have a downtrend line on the RSI indicator that is about to break and retest, which supports the upward move. There is a key support zone in green at the 0.770 price level, representing a strong support point. We have a trend of consolidation above the 100-period moving average. Entry price: 0.790 First target: 0.825 Second target: 0.853 Third target: 0.888 Don't forget a simple money management rule: Place your stop-loss order below the green support zone. Once the first target is reached, save some money and then change your stop-loss order to an entry order. For any questions, please leave a comment. Thank you.

Bithereum_io
تحلیل فنی WLD: فرصت خرید در حمایتها و اهداف صعودی بزرگ پس از شکست مقاومت کلیدی
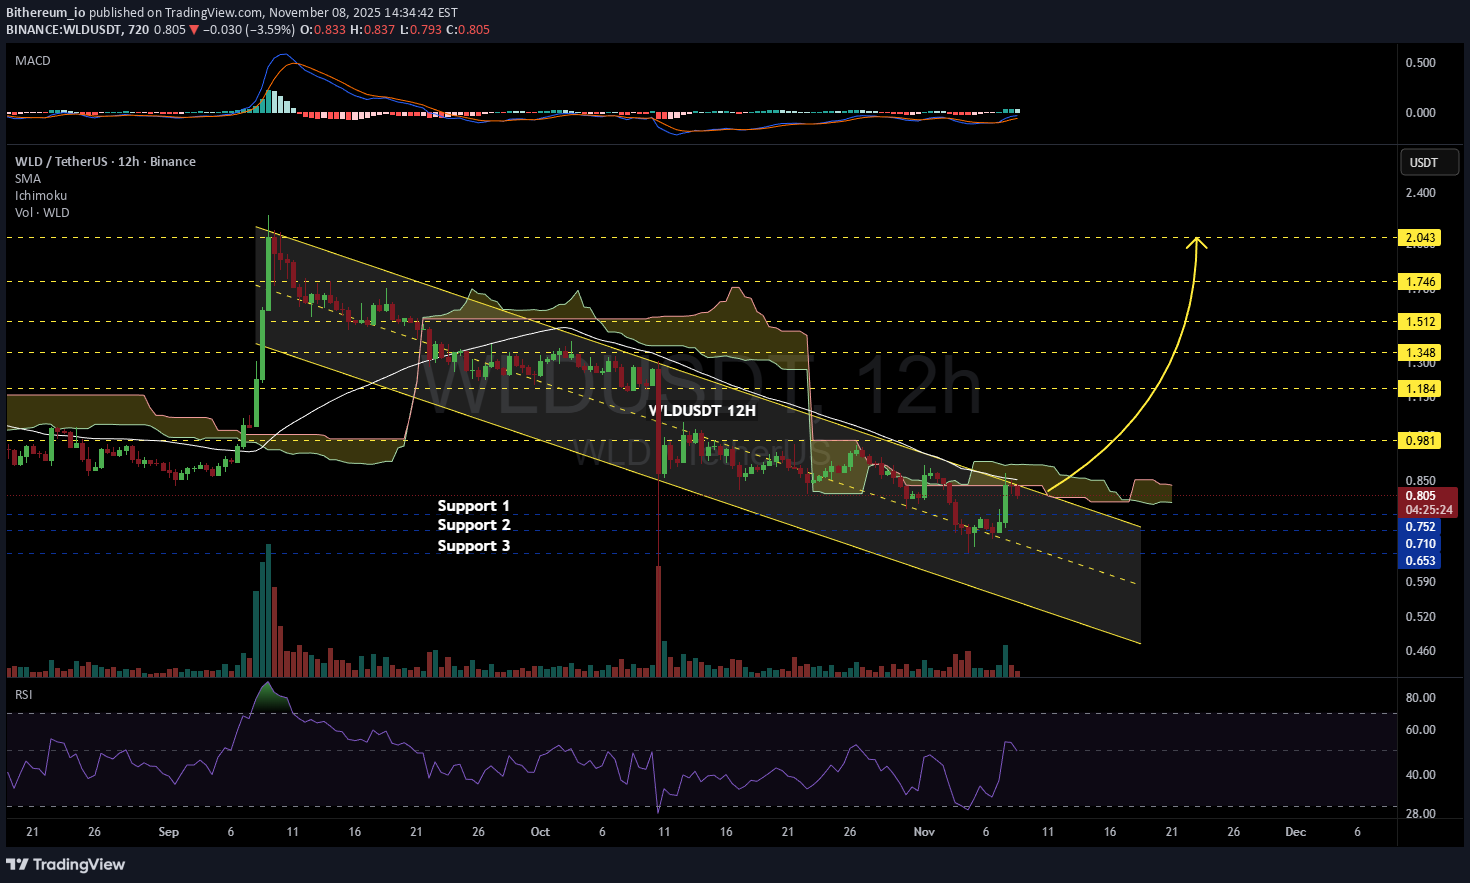
#WLD is currently trading within a descending channel on the 12H timeframe. It’s now facing a resistance cluster that includes the channel resistance, the 12H SMA50, and the Ichimoku cloud. You may consider buying a small position around the current level and near the support zones at: 💰 $0.752 💰 $0.710 💰 $0.653 In case of a breakout above the resistance cluster, the potential upside targets are: 🎯 $0.981 🎯 $1.184 🎯 $1.348 🎯 $1.512 🎯 $1.746 🎯 $2.043 ⚠️ Always remember to use a tight stop-loss and maintain proper risk management.

CobraVanguard
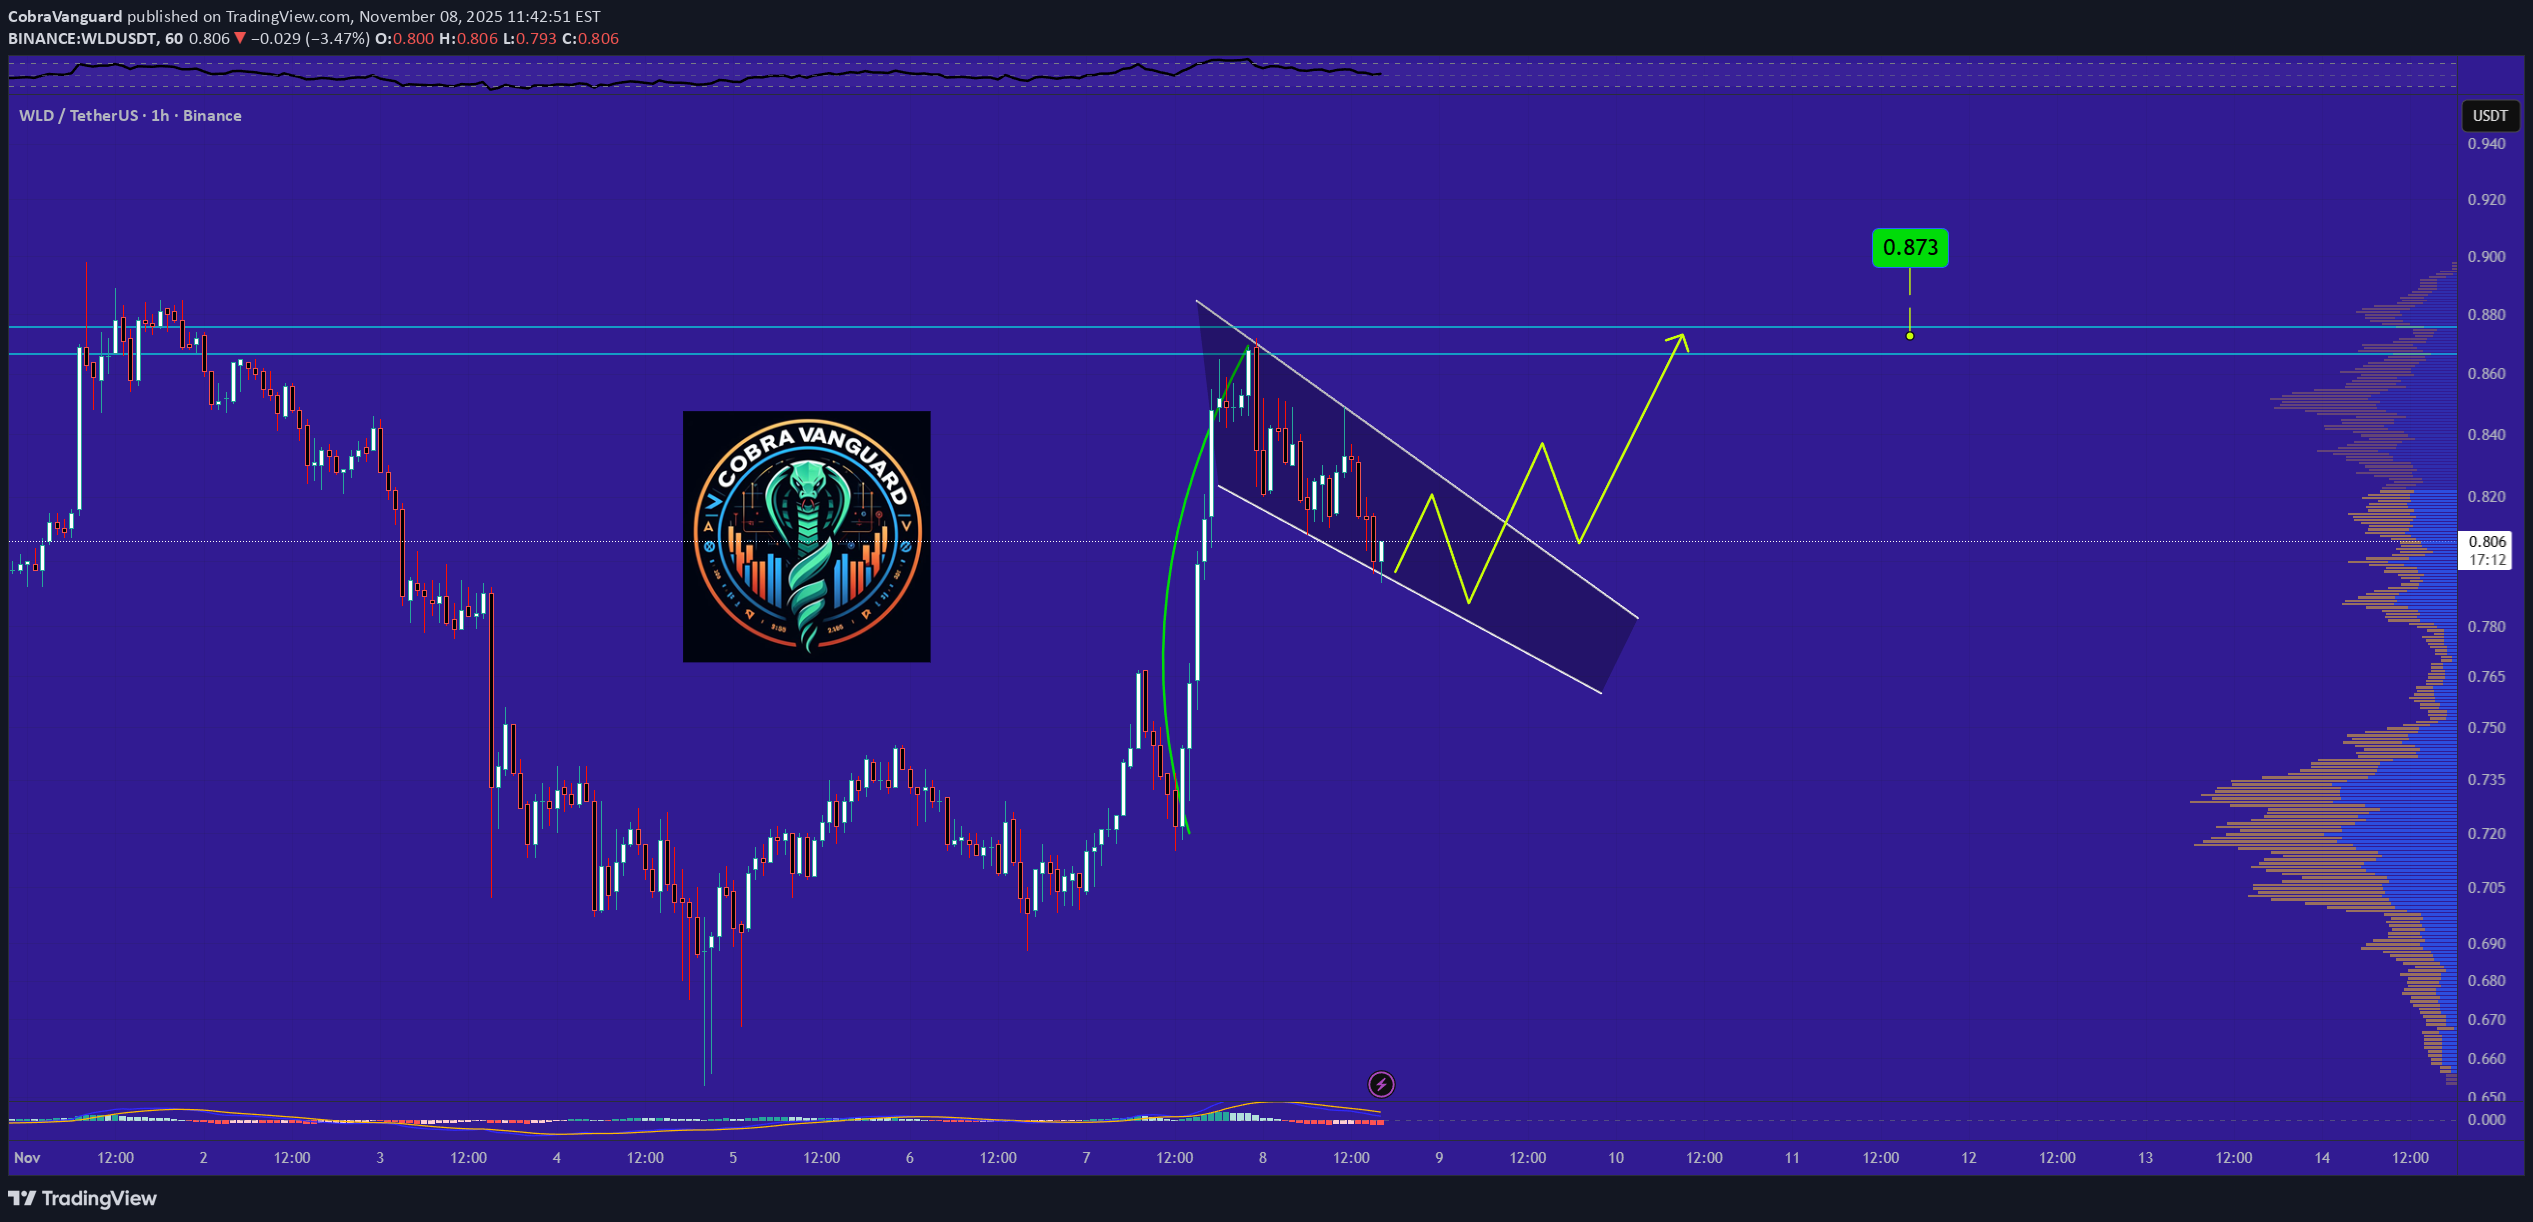
تحلیل فنی و پیشبینی قیمت WLD/USDT: راز الگوی پرچم صعودی و حرکت بعدی قیمت!

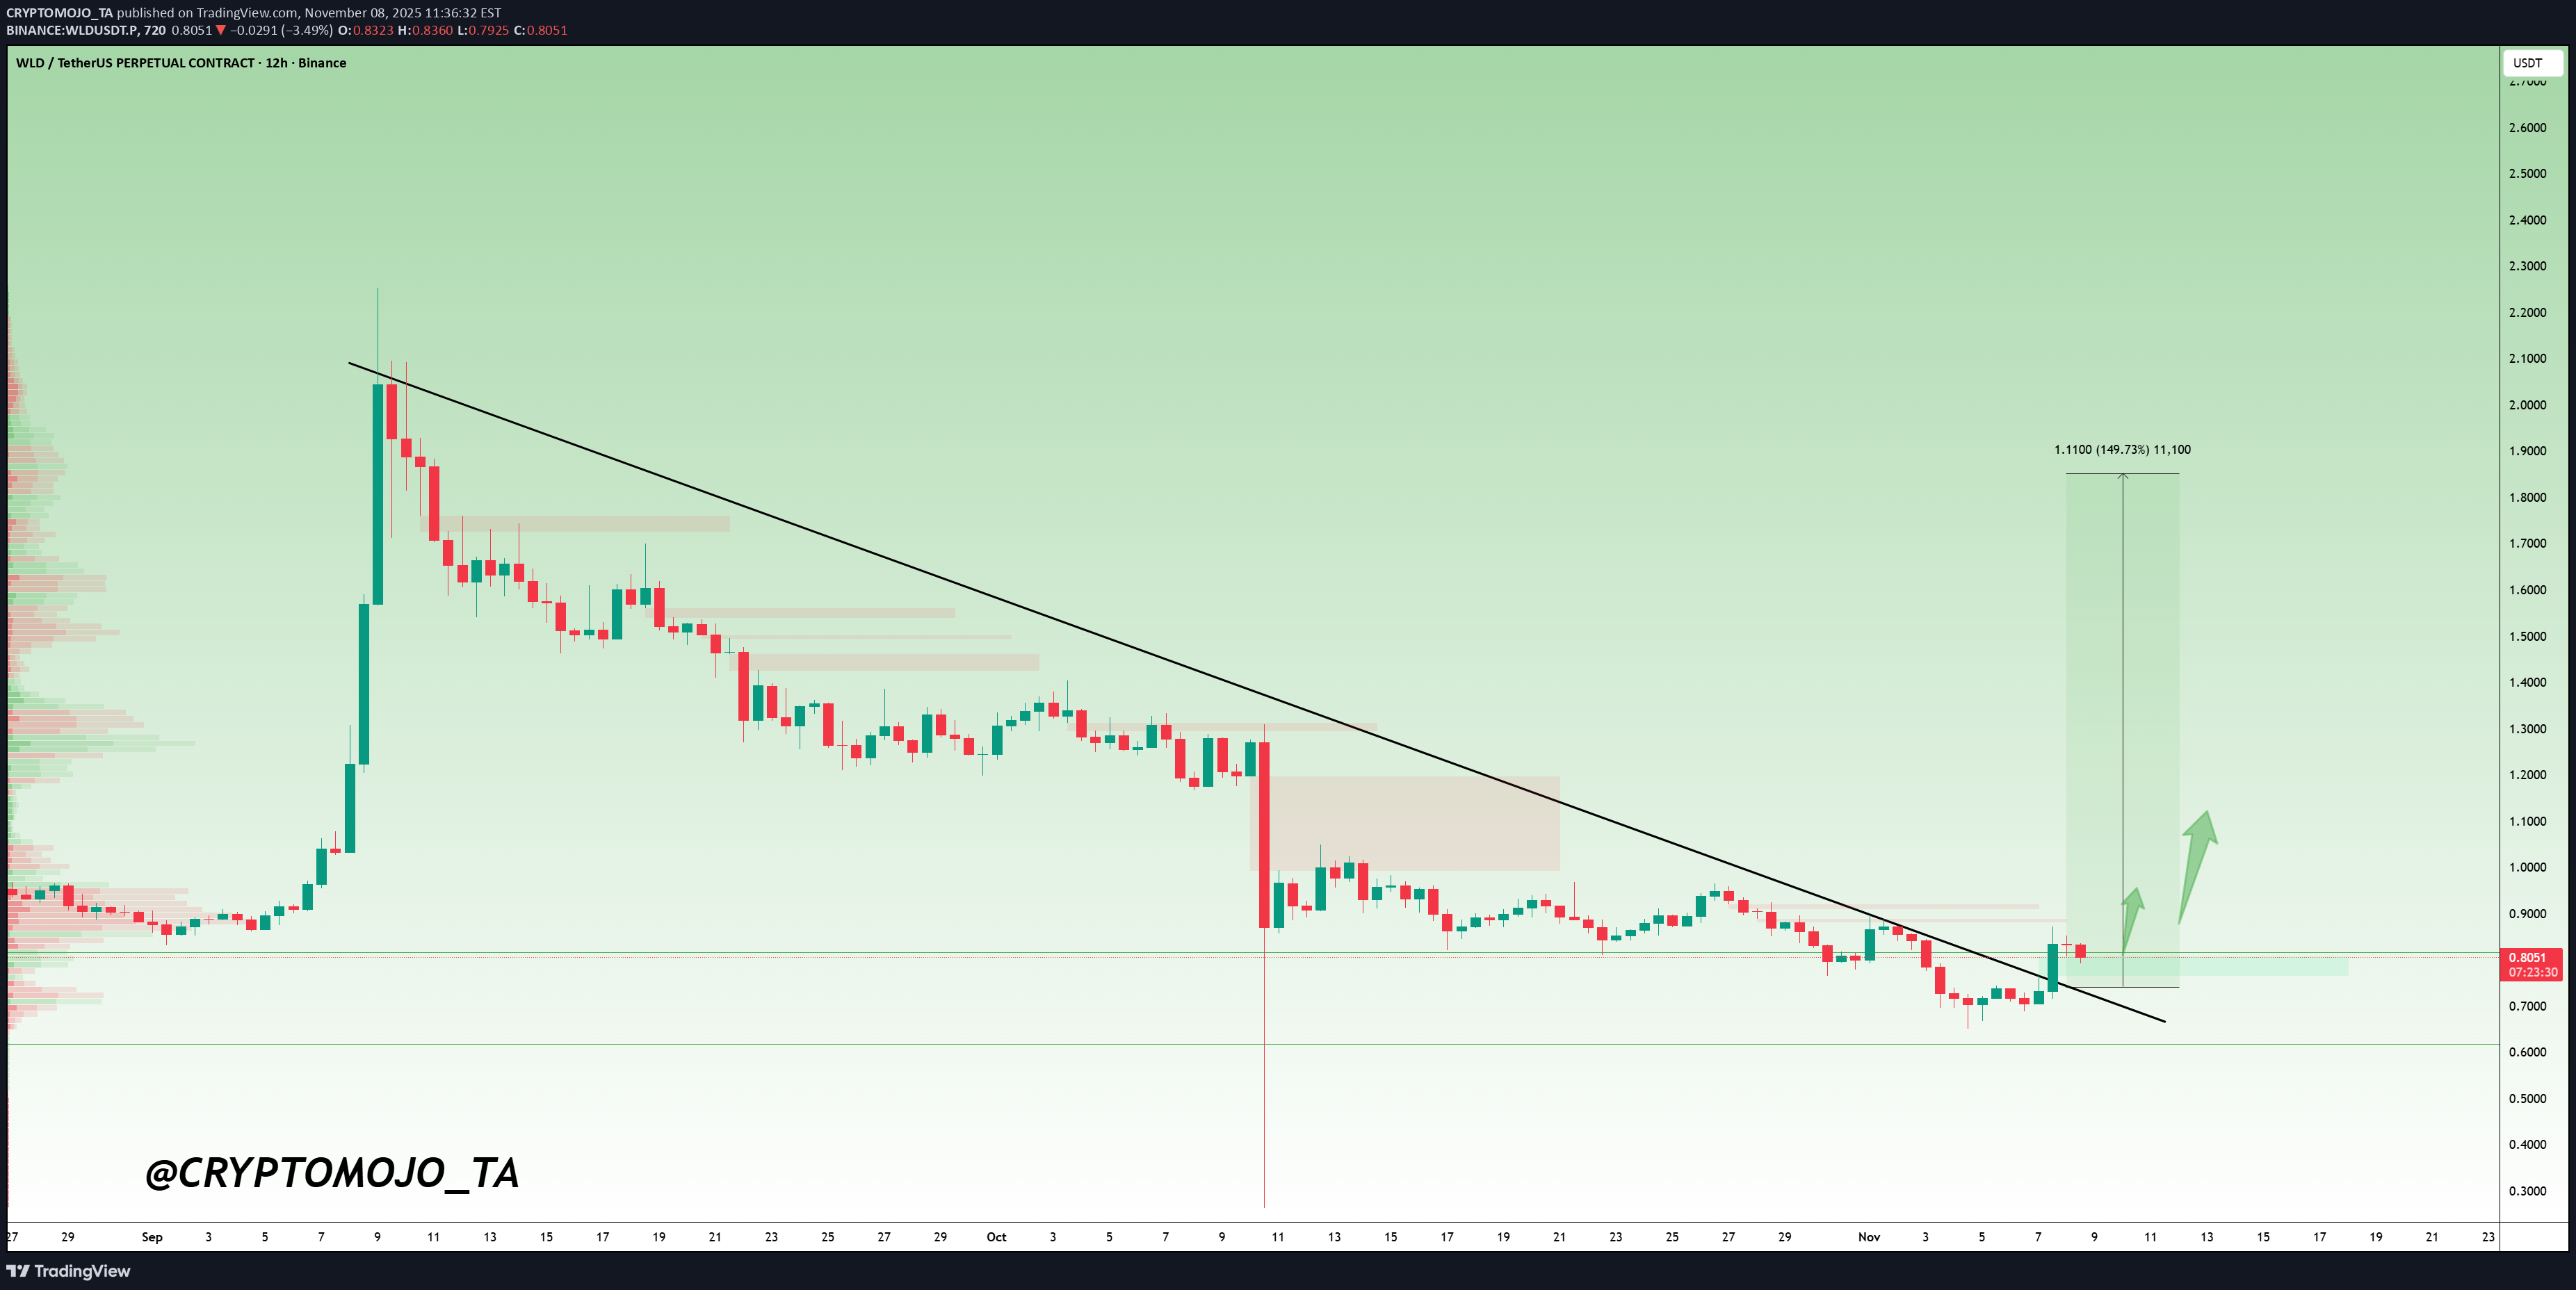
CRYPTOMOJO_TA

CryptoNuclear
نقطه عطف WLD/USDT: آیا شاهد بازگشت بزرگ خواهیم بود یا ادامه سقوط؟
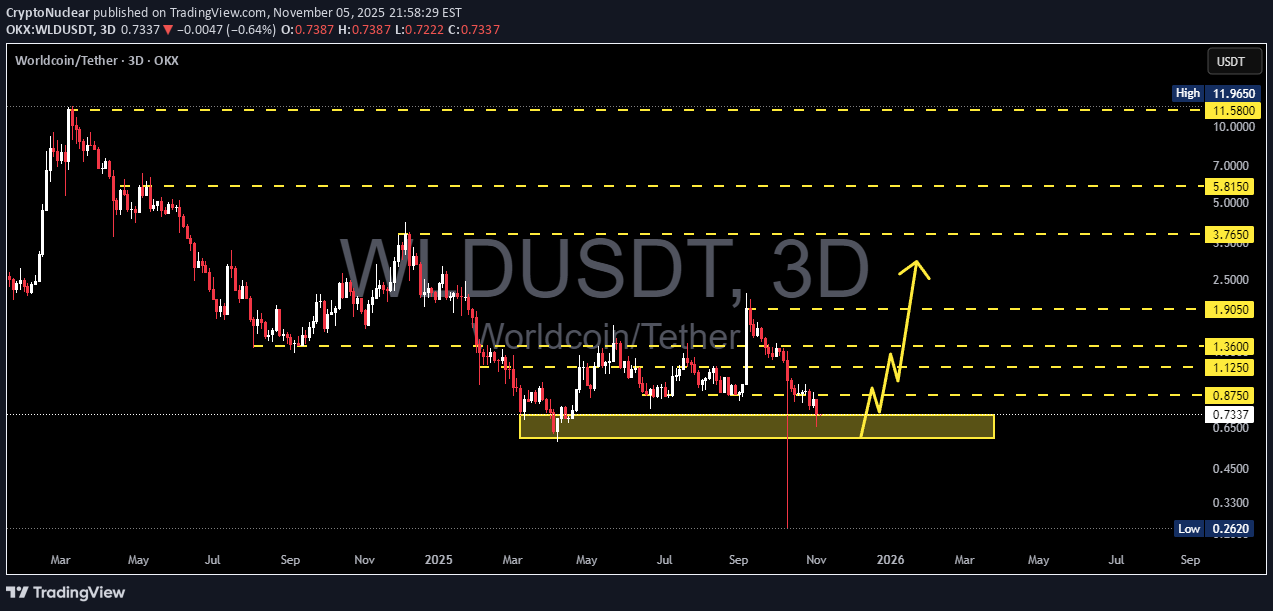
WLD/USDT is now sitting right at one of the most critical accumulation zones of the year, between 0.73–0.595 — the same area that previously triggered two significant rallies. However, this time the setup looks different. The price structure remains in a clear downtrend, and the recent long lower wick signals a liquidity sweep — a battle zone between smart money accumulation and panic selling. This yellow zone is the make-or-break level for WLD’s broader trend. If it holds, we could witness the early stages of a major trend reversal. But if it breaks cleanly below, the market may enter a distribution and continuation phase toward the historical lows near 0.33–0.26. --- Bullish Scenario – Reversal from Demand Zone A strong reaction from 0.62–0.73, followed by a confirmed 3D/weekly close above 0.875, could mark the first sign of bullish control returning. A successful retest of 0.73 as new support would offer an ideal confirmation entry. Upside targets: → 1.125 – 1.36 (first reaction zone) → 1.905 (major resistance and key pivot) → If momentum extends, next zone around 3.76 becomes reachable. Bullish Narrative: “If this accumulation base holds once again, WLD could be setting up one of the most interesting bottom reversal structures of Q4 2025.” --- Bearish Scenario – Breakdown and Capitulation A confirmed 3D/weekly close below 0.595 would invalidate the accumulation zone. A failed retest afterward could accelerate the decline toward 0.33, and potentially retest 0.262 as a historical support level. Such a move could mark a final capitulation phase before long-term accumulation resumes. Bearish Narrative: “If 0.595 gives way, it’s not just a technical breakdown — it’s a loss of short-term structural confidence. The market could seek deeper liquidity before finding stability again.” --- Technical Structure & Pattern Primary trend: Medium-term downtrend with a descending price structure. Yellow zone: Key demand/accumulation area repeatedly tested, reflecting an institutional tug-of-war. Liquidity sweep: The deep lower wick beneath the zone indicates a stop-hunt event — typical before major reversals or continuation breakdowns. --- Strategic Notes Watch higher timeframes (3D/weekly) for confirmation; avoid reacting to intraday noise. Conservative entries: wait for a confirmed close and retest above 0.875 (bullish) or below 0.595 (bearish). Stop-loss strategy: place it outside the accumulation zone boundaries to avoid being swept by volatility. Volume confirmation is crucial — breakouts without volume risk turning into false moves. --- Conclusion WLD is currently balancing between accumulation and distribution — a tipping point where market direction for the coming quarter will be decided. If buyers defend 0.73–0.595, a strong reversal structure could form. If not, sellers will likely regain control and drive price into new low territories. Either way, this zone defines the next major trend for WLD. --- #WLDUSDT #Worldcoin #CryptoAnalysis #TechnicalAnalysis #PriceAction #SupportResistance #DemandZone #BreakoutOrBreakdown #ReversalZone #CryptoMarket #SmartMoney #TrendAnalysis
BandForBands
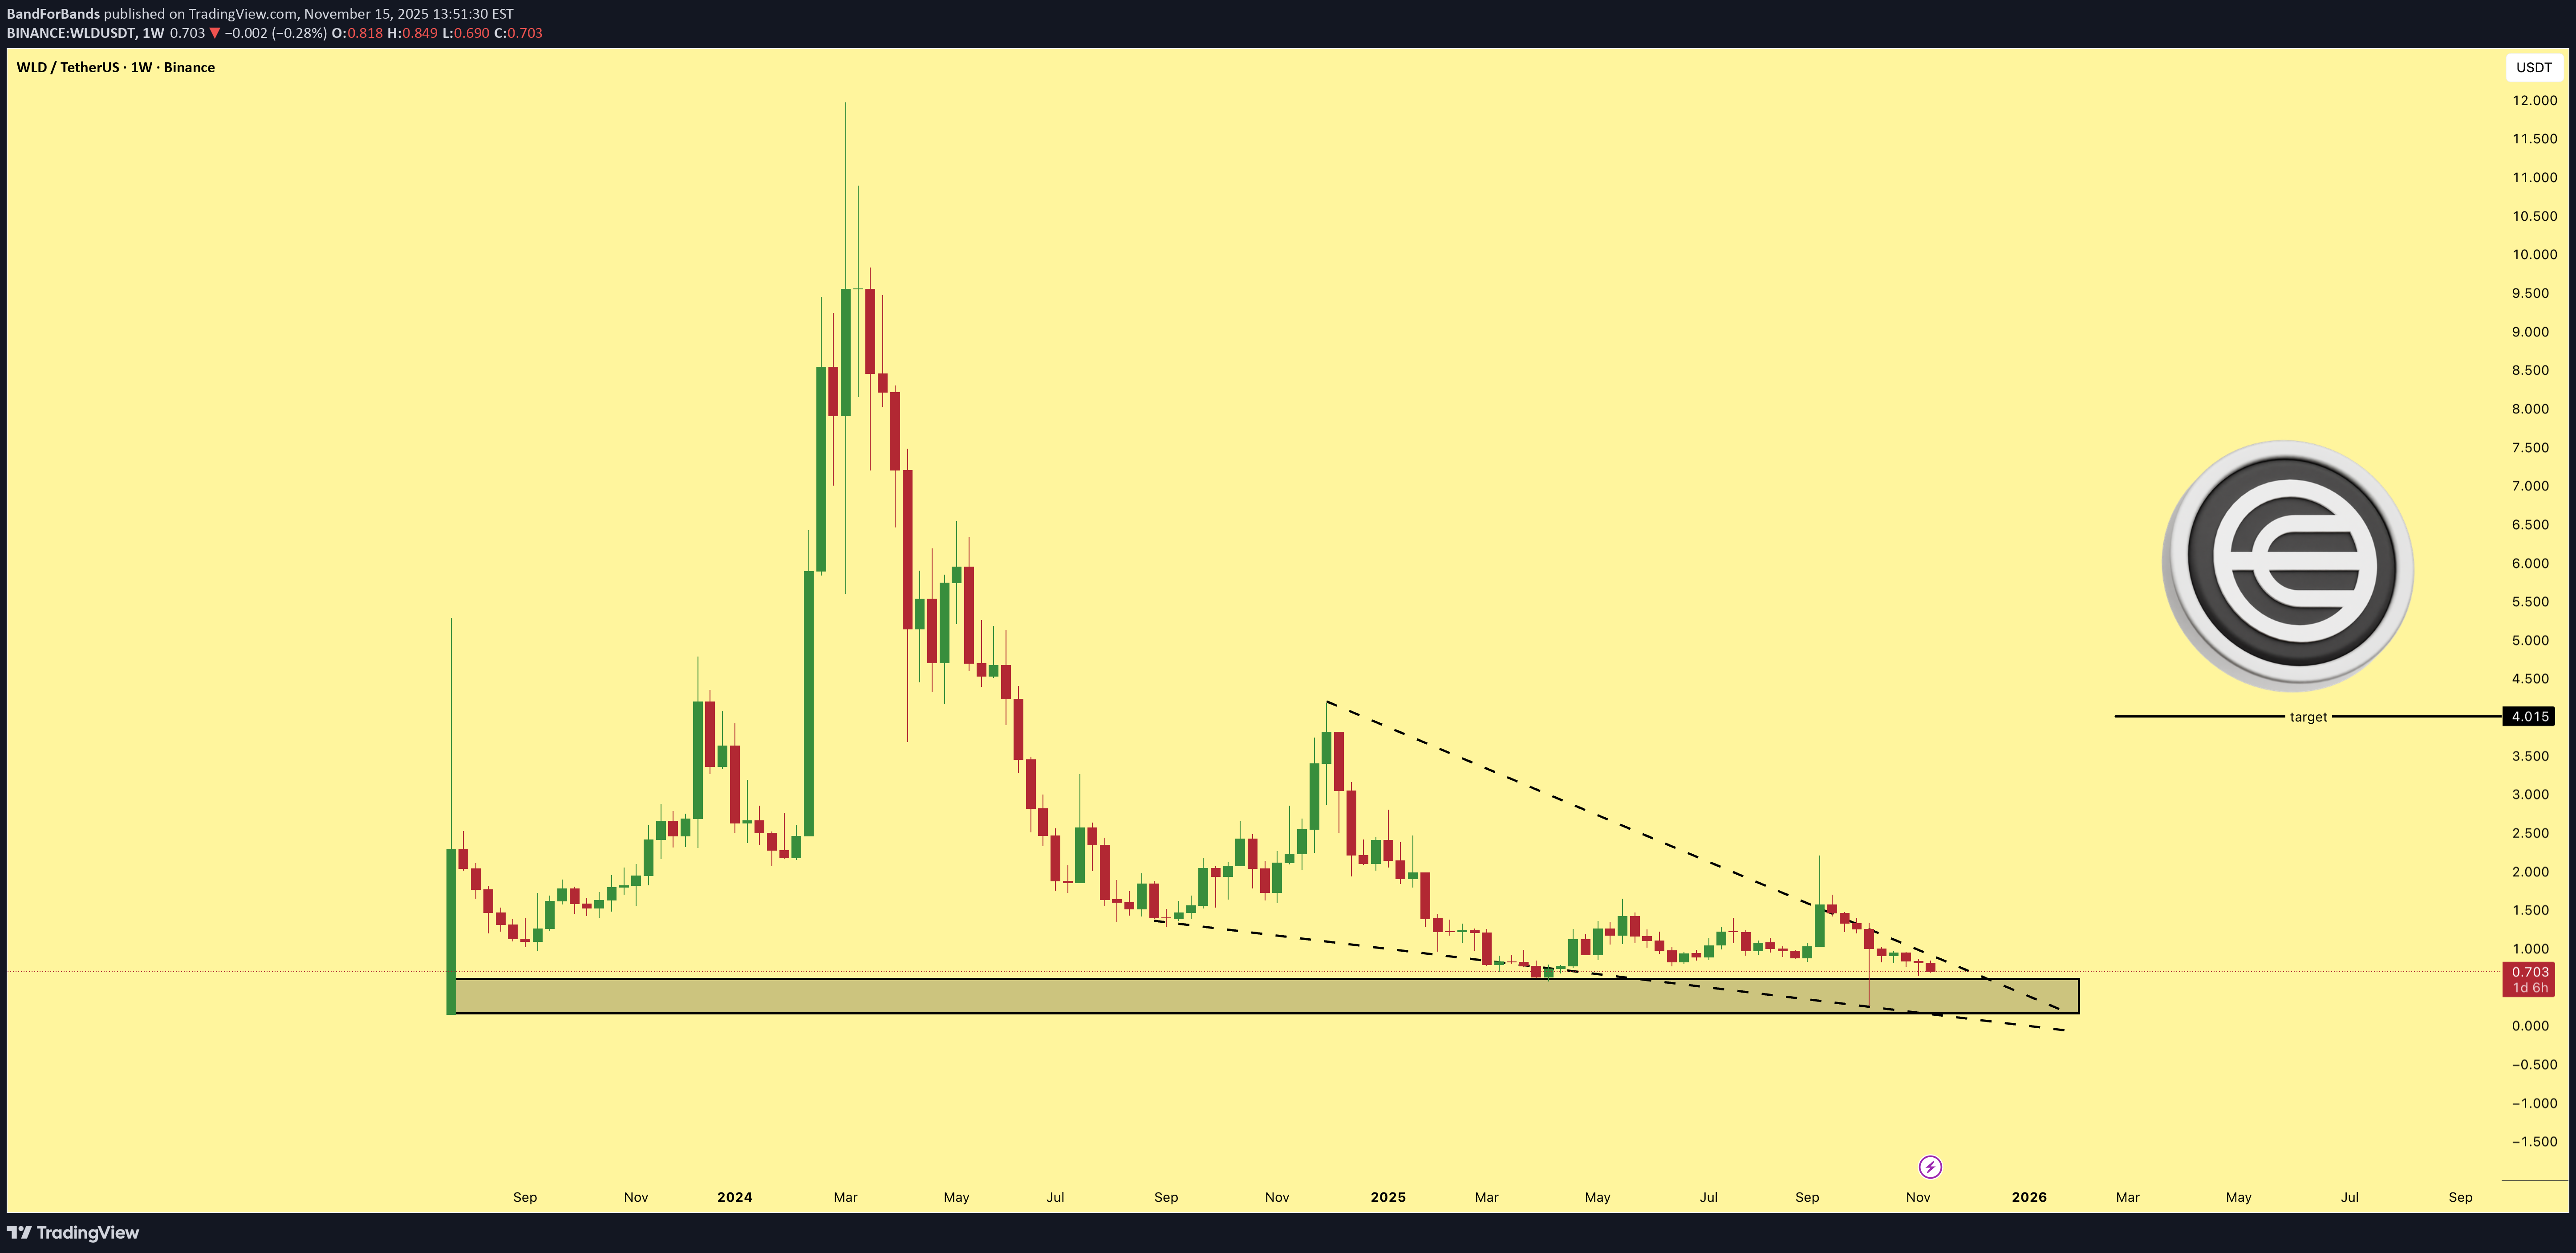
پیشبینی انفجاری WLD: سود ۵۰۰ درصدی در ۸۰ روز با ریسک فوقالعاده پایین!
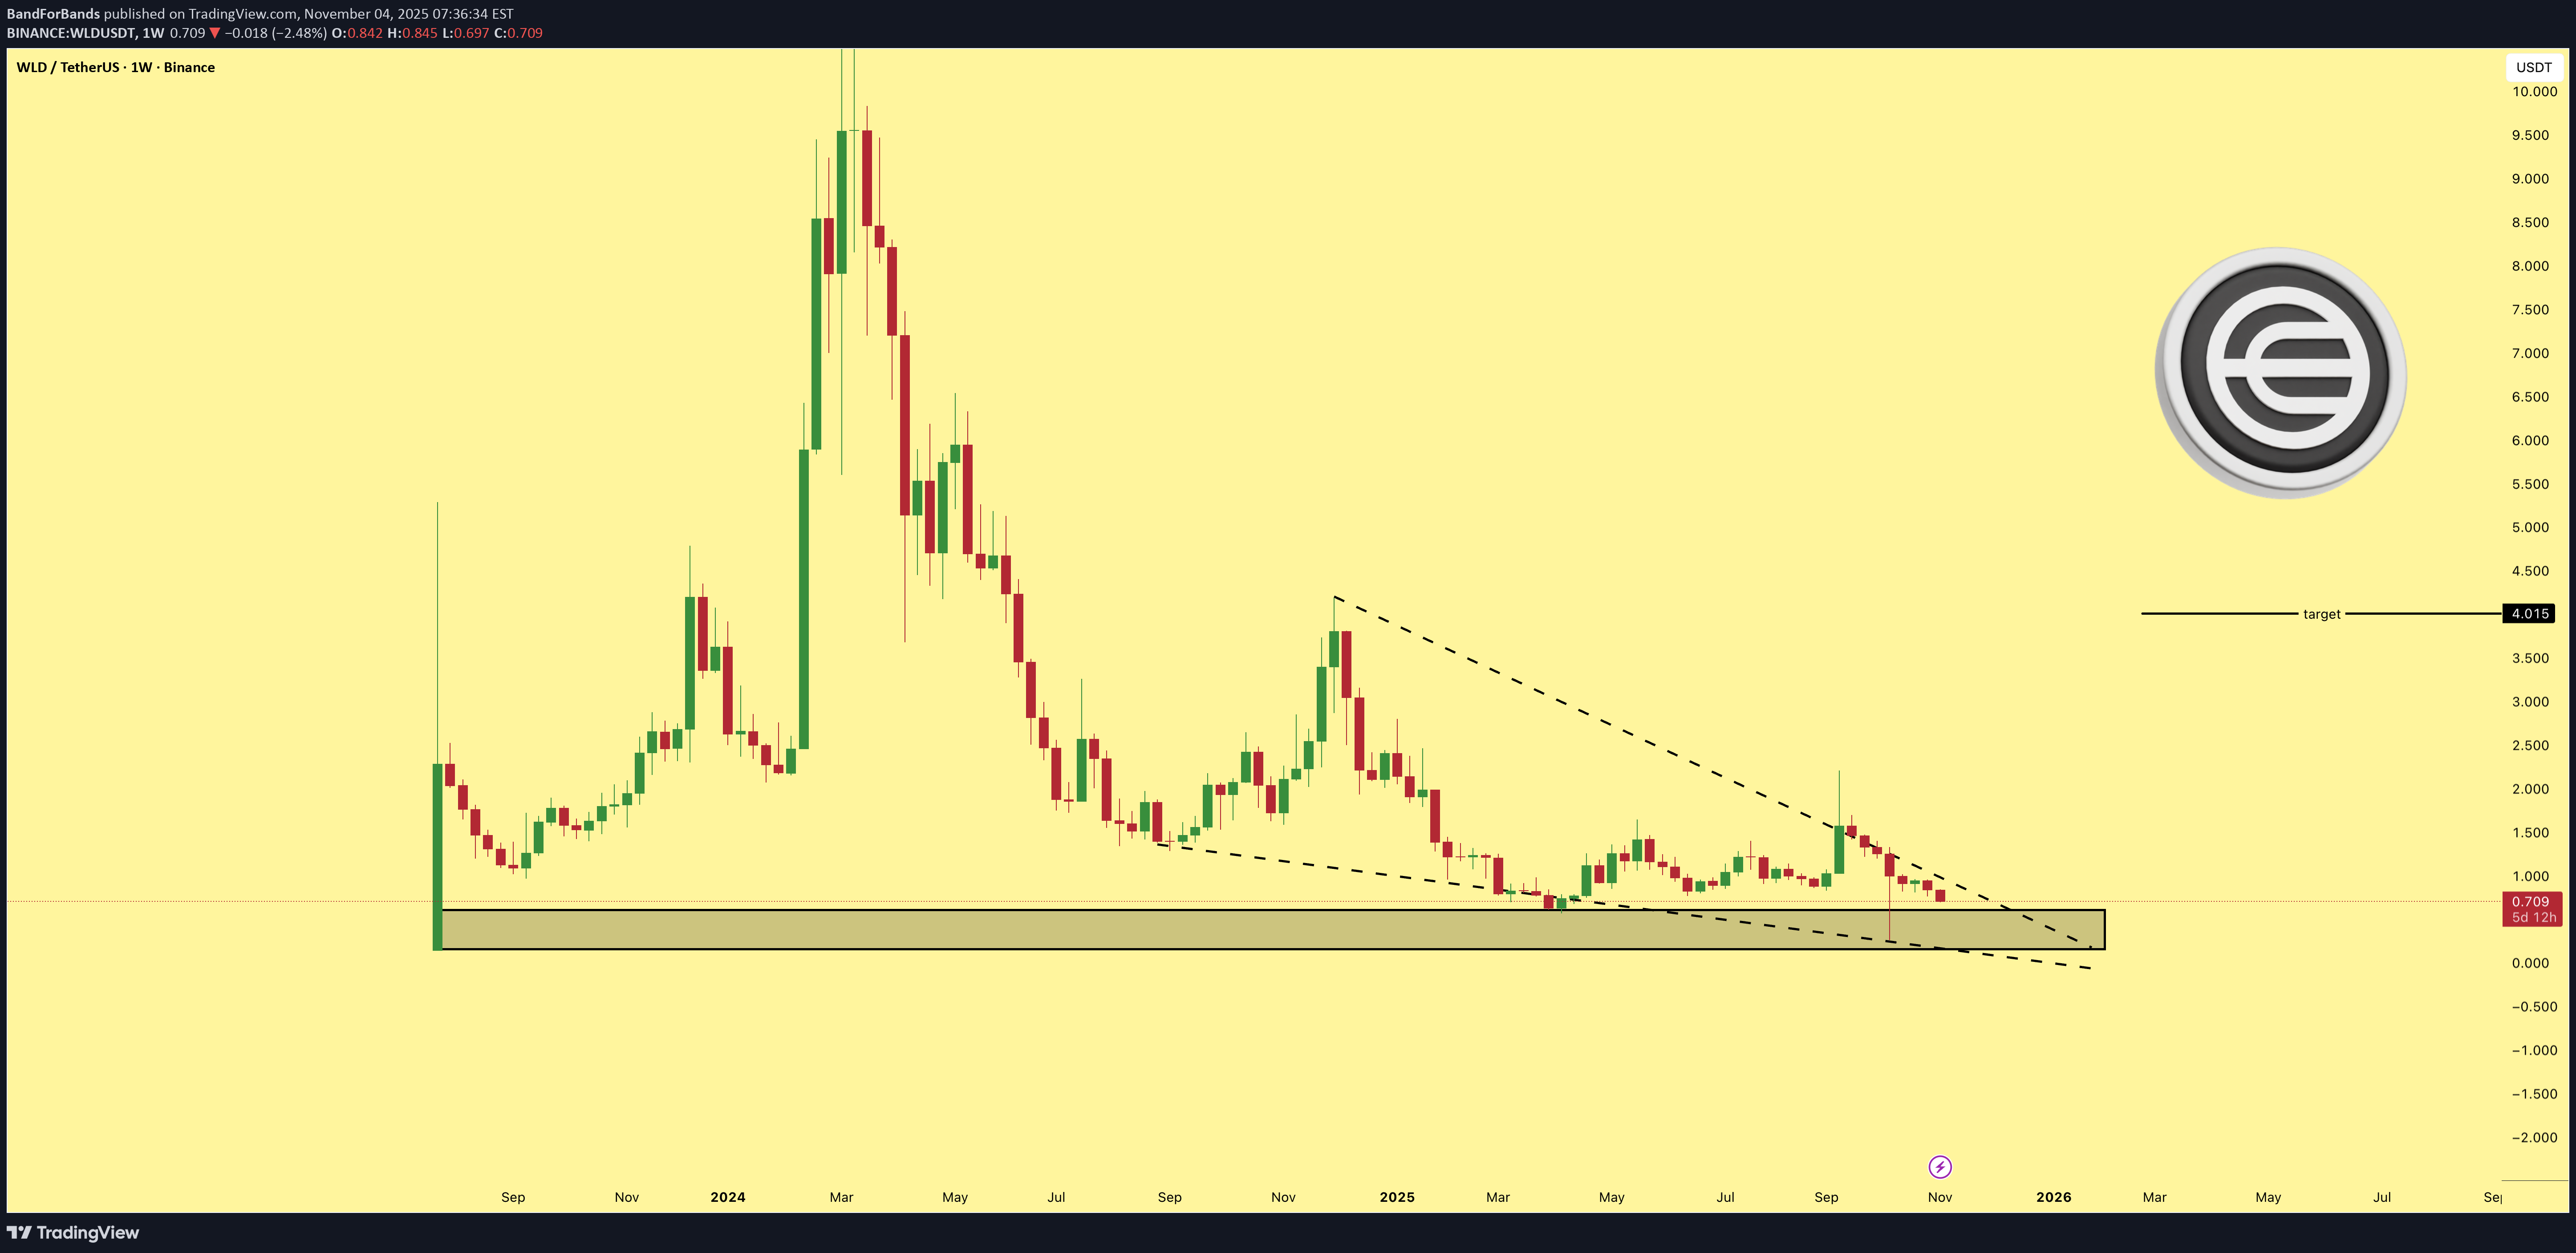
I’m expecting WLD to break out within the next 80 days, offering a potential 500% profit from current levels. It’s trading near its open price, which makes the risk-to-reward setup even more attractive. This is a strong accumulation zone for early entries.

Ulrich_NeverDMfirst
آینده WLD در چند سال آینده: نگاهی به فاکتورهای کلیدی و پیشبینیها
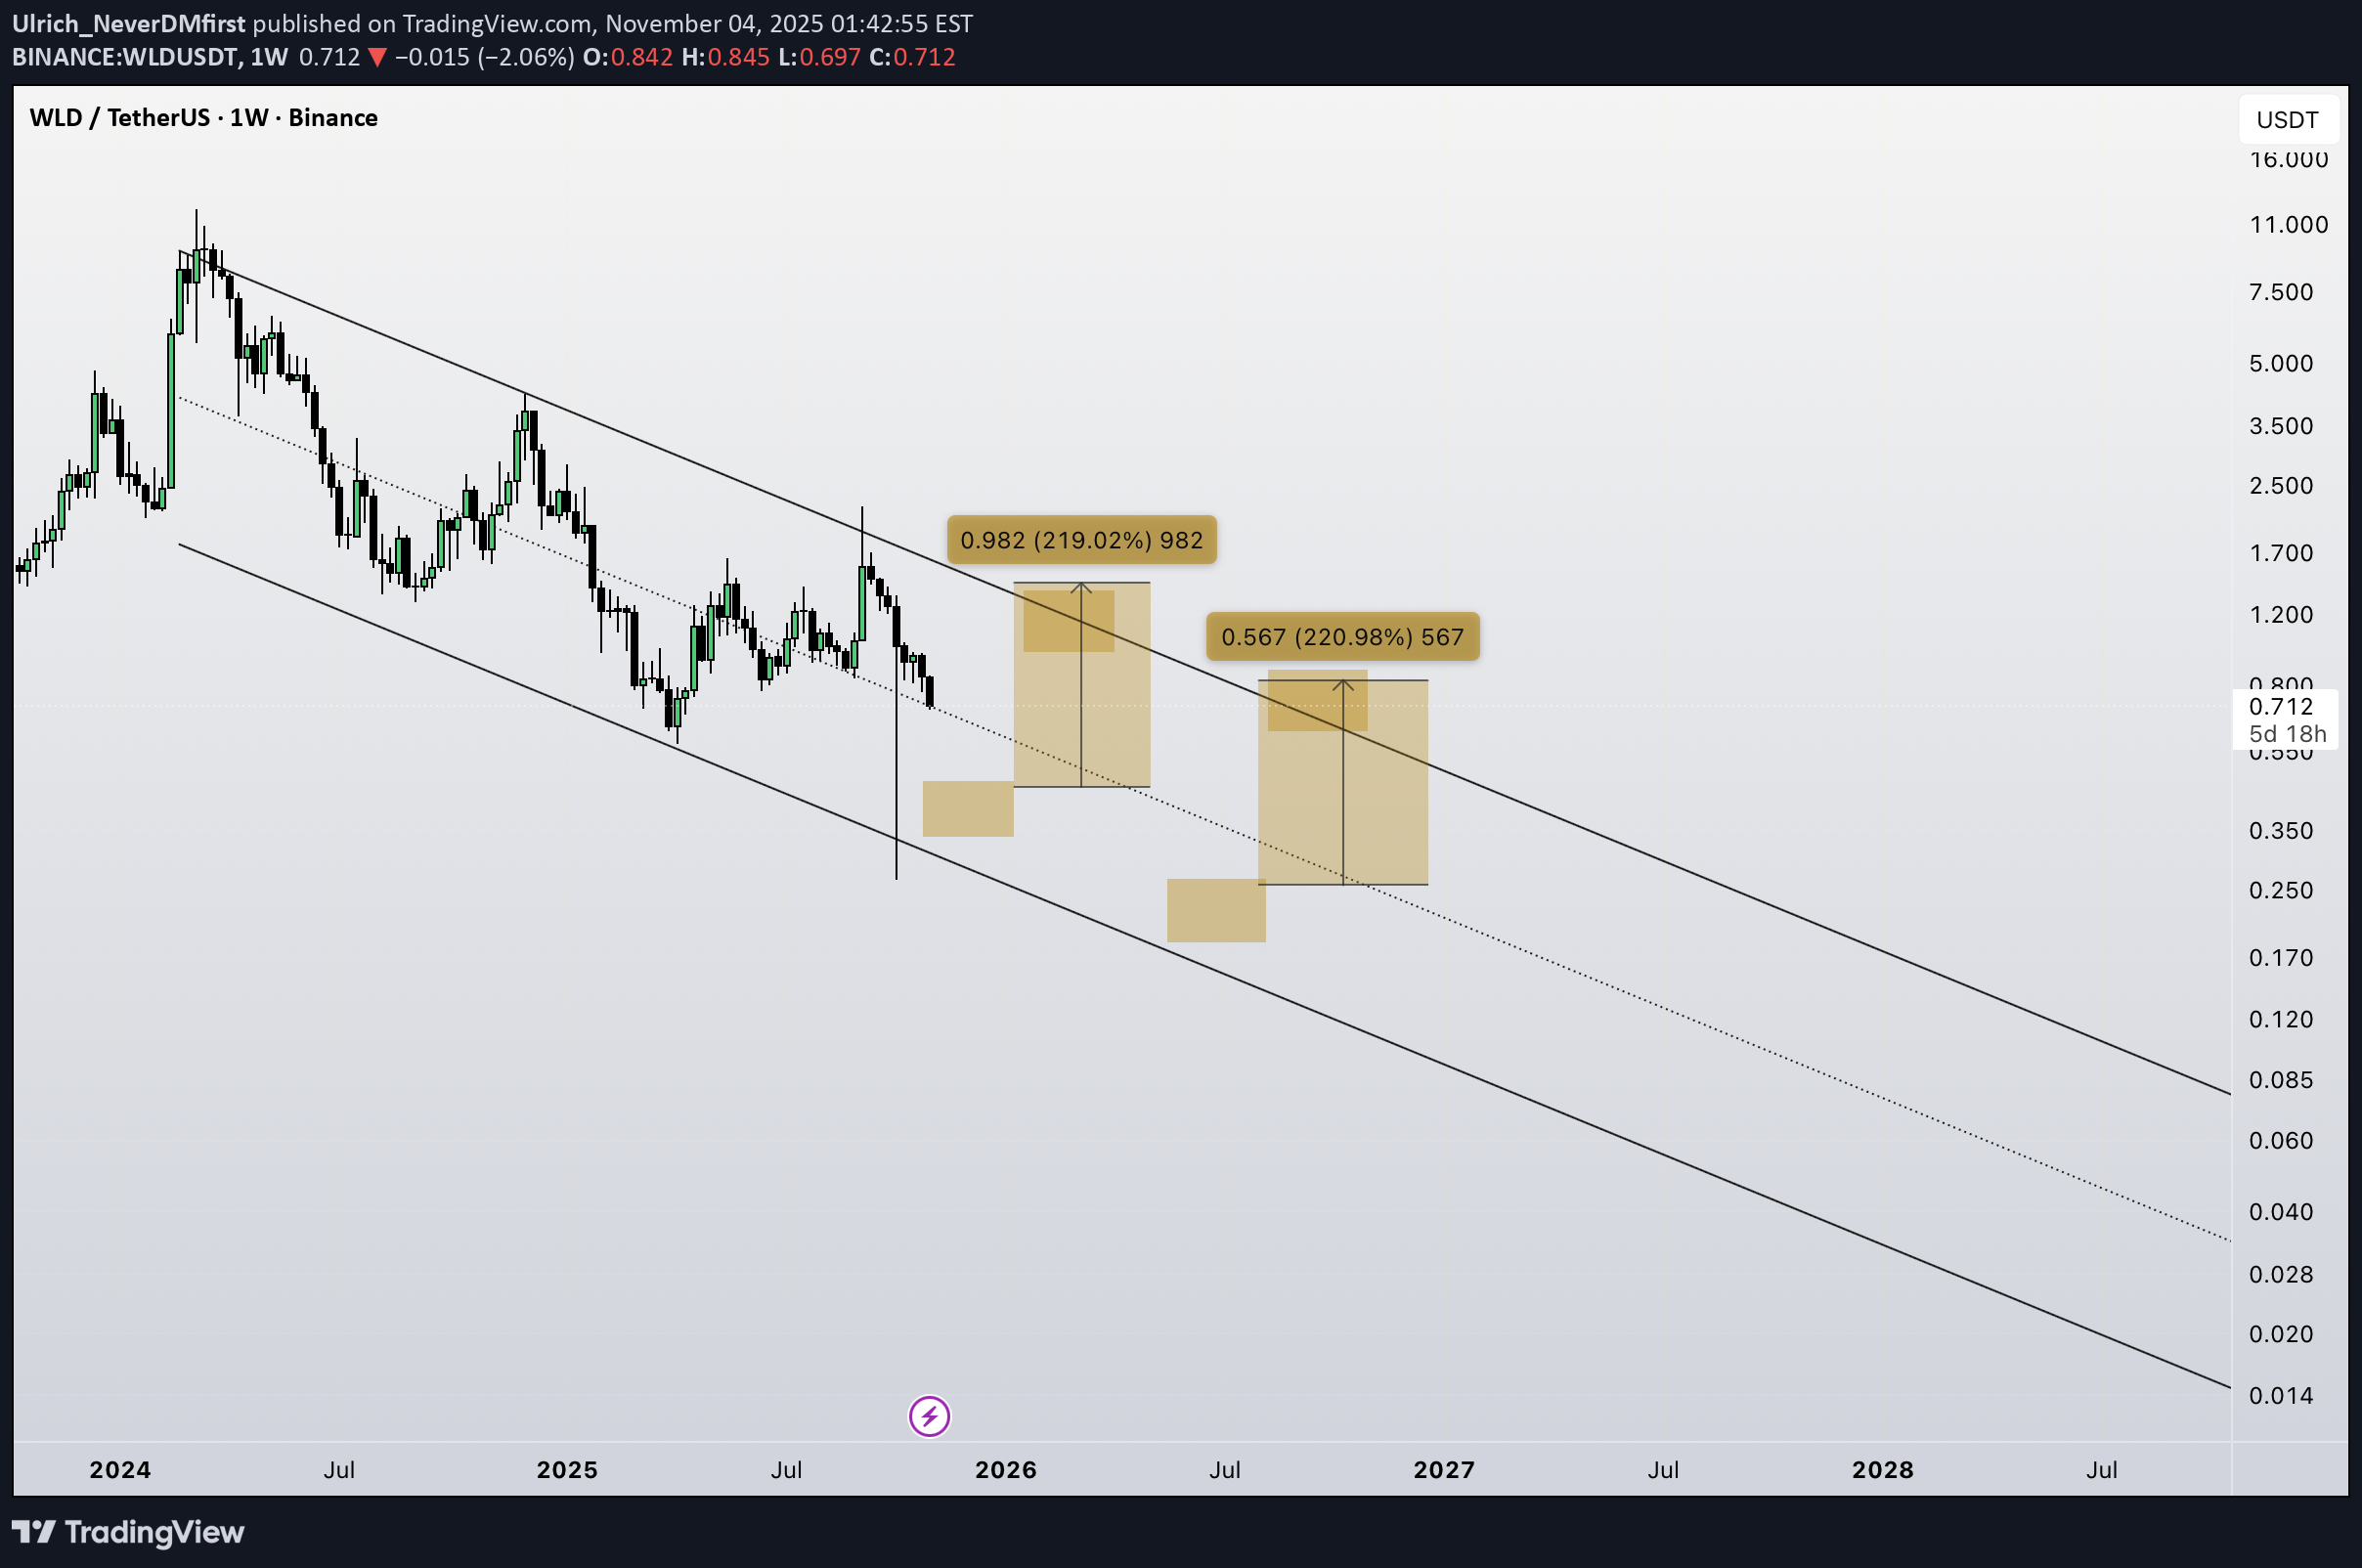
Just for the Record. So I can say I told y’all ! Depends on many factors and technical aspects and the political and nature of the alts market
Disclaimer
Any content and materials included in Sahmeto's website and official communication channels are a compilation of personal opinions and analyses and are not binding. They do not constitute any recommendation for buying, selling, entering or exiting the stock market and cryptocurrency market. Also, all news and analyses included in the website and channels are merely republished information from official and unofficial domestic and foreign sources, and it is obvious that users of the said content are responsible for following up and ensuring the authenticity and accuracy of the materials. Therefore, while disclaiming responsibility, it is declared that the responsibility for any decision-making, action, and potential profit and loss in the capital market and cryptocurrency market lies with the trader.