
W
Wormhole
| تریدر | نوع سیگنال | حد سود/ضرر | زمان انتشار | مشاهده پیام |
|---|---|---|---|---|
No results found. | ||||
Price Chart of Wormhole
سود 3 Months :
سیگنالهای Wormhole
Filter
Sort messages by
Trader Type
Time Frame

St_Gex
Wormhole: غول پلهای بلاکچین با ۲ میلیارد دلار قفل شده (همکاری با بلکراک)

Hi Wormhole has 2B+ in TVL and leads bridging and crosschains transactions for BlackRock and some other big institutions. This is not a trading advice. Thanks Gex

OpenYourMind1318
شکاف کرمچاله و USD: راز خروج از کانال نزولی بلندمدت!
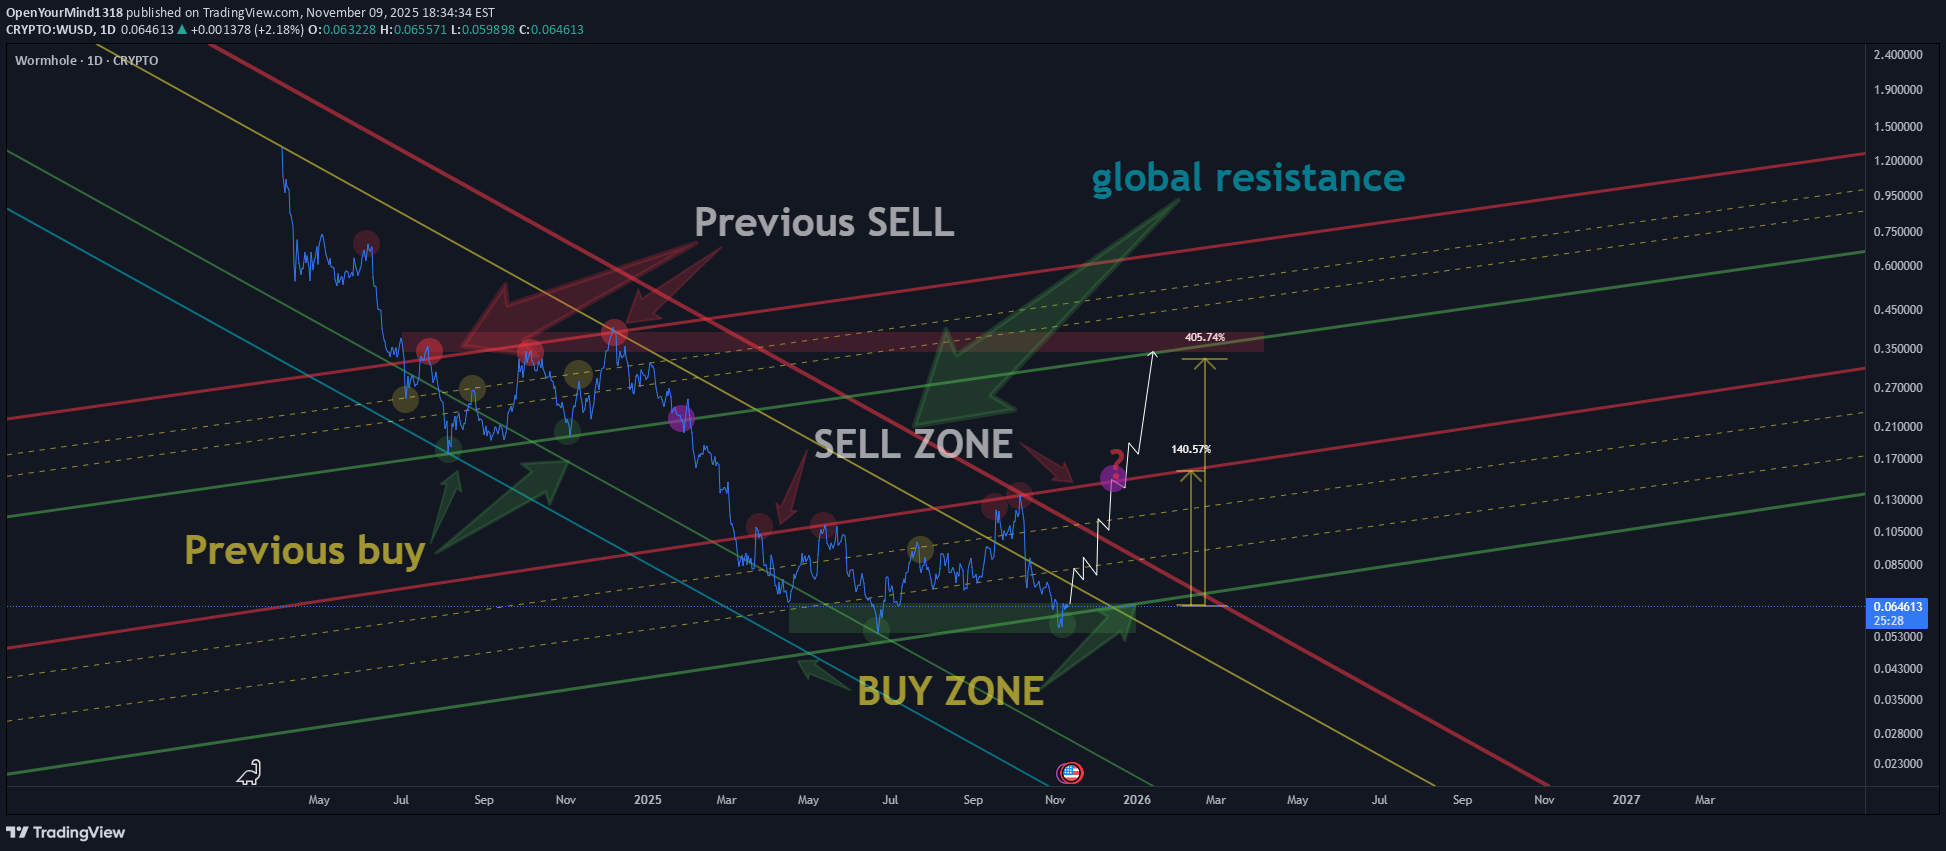
On the chart, we can see two channels : one reflects the reaction to previous movement and the other shows the potential current setup. Inside of each channel, there is a zone of uncertainty (marked with dashed lines) — within this range the price may shake out weak hands and accumulate positions. After a breakout and confident candle close above this zone, we can expect a strong upward move. The key point is to wait for a candle body to close above the zone boundary to confirm the impulse. Additionally, the price is still moving within a global descending channel. To reach higher targets it’s crucial for the market to break out and hold above the upper boundary of this long-term downtrend channel.

Bithereum_io
آینده WUSDT: انتظار جهش بزرگ پس از شکست مقاومت! (اهداف تا ۰.۲۵ دلار)
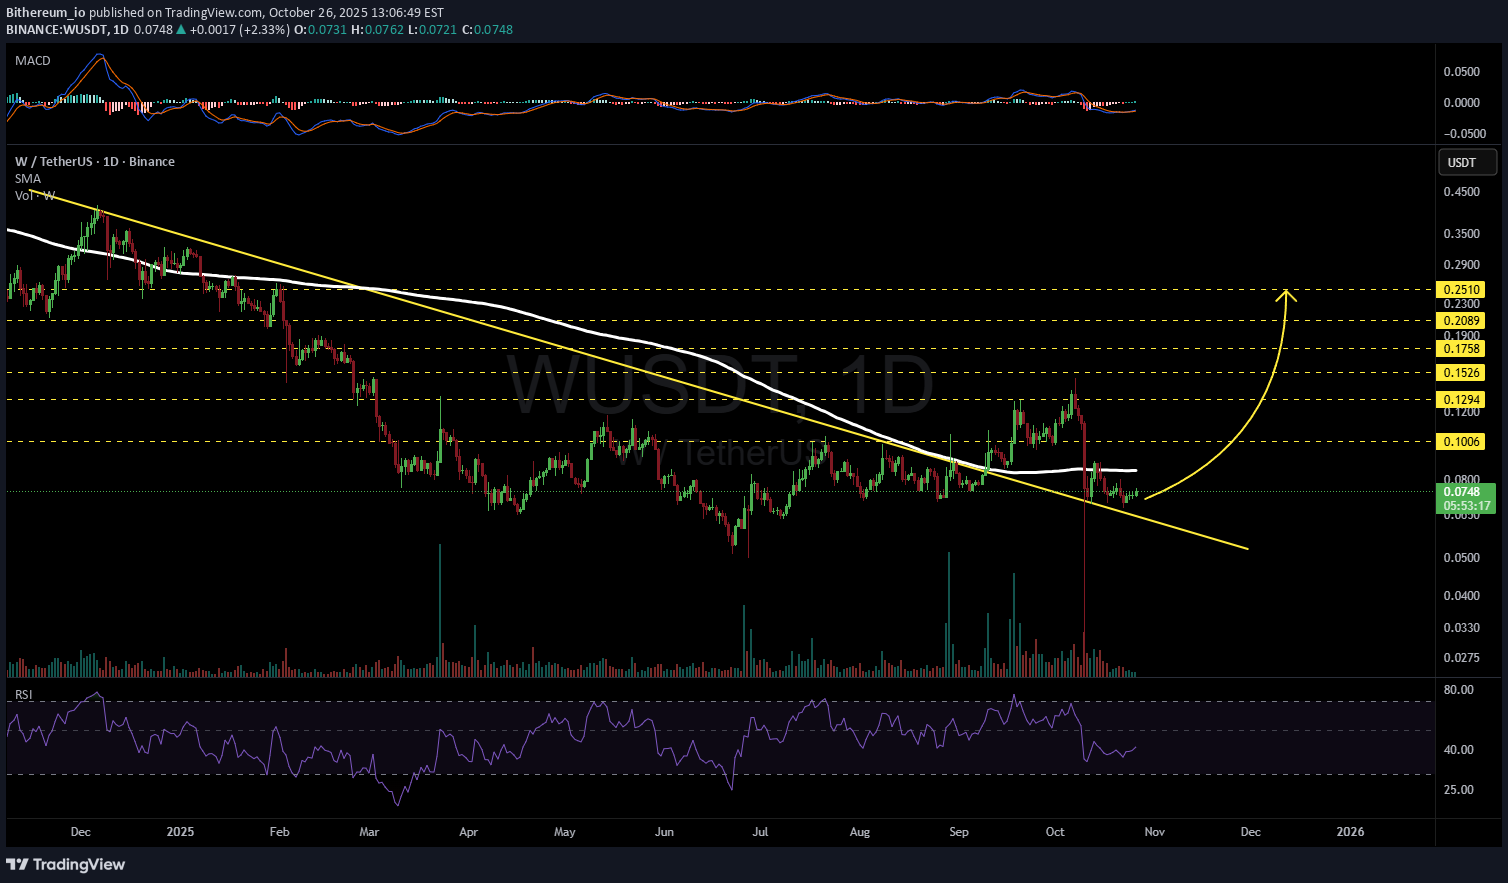
#W is holding above the broken descending resistance on the daily chart, and a bounce is expected from here. For the bullish scenario to be confirmed, it needs to reclaim the daily SMA200. If that happens, the potential targets are: 🎯 $0.1006 🎯 $0.1294 🎯 $0.1526 🎯 $0.1758 🎯 $0.2089 🎯 $0.2510 ⚠️ Always remember to use a tight stop-loss and maintain proper risk management.

Teddybear_inc
احتمال بازگشت بزرگ: قیمت Wormhole تا 2026 چه خواهد شد؟

We have seen the first half of the reversal diamond pattern play out and will be looking at this filling the second part with in the first 4 months of 2026 if not sooner..

mbaberhanif
صعود انفجاری W/USDT: الگو «سر و شانه معکوس» نویدبخش چه قیمتی است؟

W/USDT is showing strong signs of reversal momentum. A clear Inverse Head & Shoulders pattern has been completed, with the neckline breakout suggesting a potential bullish trend shift. Price is consolidating near the neckline, which is now acting as support, adding strength to the breakout. If momentum sustains, the next upside targets open toward $0.19 – $0.29, with an extended bullish potential toward $1.85 in the long run. On the downside, support is seen around $0.061 – $0.049, keeping risk-to-reward highly attractive for medium to long-term investors.

megafuture
W (Warmhole): سیگنال خرید قوی و آماده برای جهش بزرگ!

W ( WARMHOLE) Beautiful accumulation pattern forming. Price has been coiling in a tight range ($0.0.09 –$0.12) since late September, with higher lows indicating buyer support. Institutional volume is pouring in, suggesting smart money positioning for a rally. A GOOD SETUP with minimum Risk you can buy for mid term profit. BUY ZONE- $0.12- 0.10 SL- $0.085 TP-1 $0.15 TP-2 $0.20 TP-3 $0.25 TP-4 $0.40 Many More setup to come I am Starting a Telegram Channel for Frequent Updates PLZ join and share will share my knowledge there as this channel is for discussion t.me/TradetheTrending

Vanlife1
Testing new Strategy

1. Broke above descending pennant and confirmed support. 2. Created a symmetrical triangle. Entering on support. 3. Predict that price will break above the symmetrical triangle- and use parallel channel as next resistance. Theory: Price action goes from bearish, to neutral to bullish. If price ends up doing this and breaks above parallel channel, even better! Otherwise stop loss below symmetrical triangle.

wolf_king888
#W Bullish Head and Shoulders
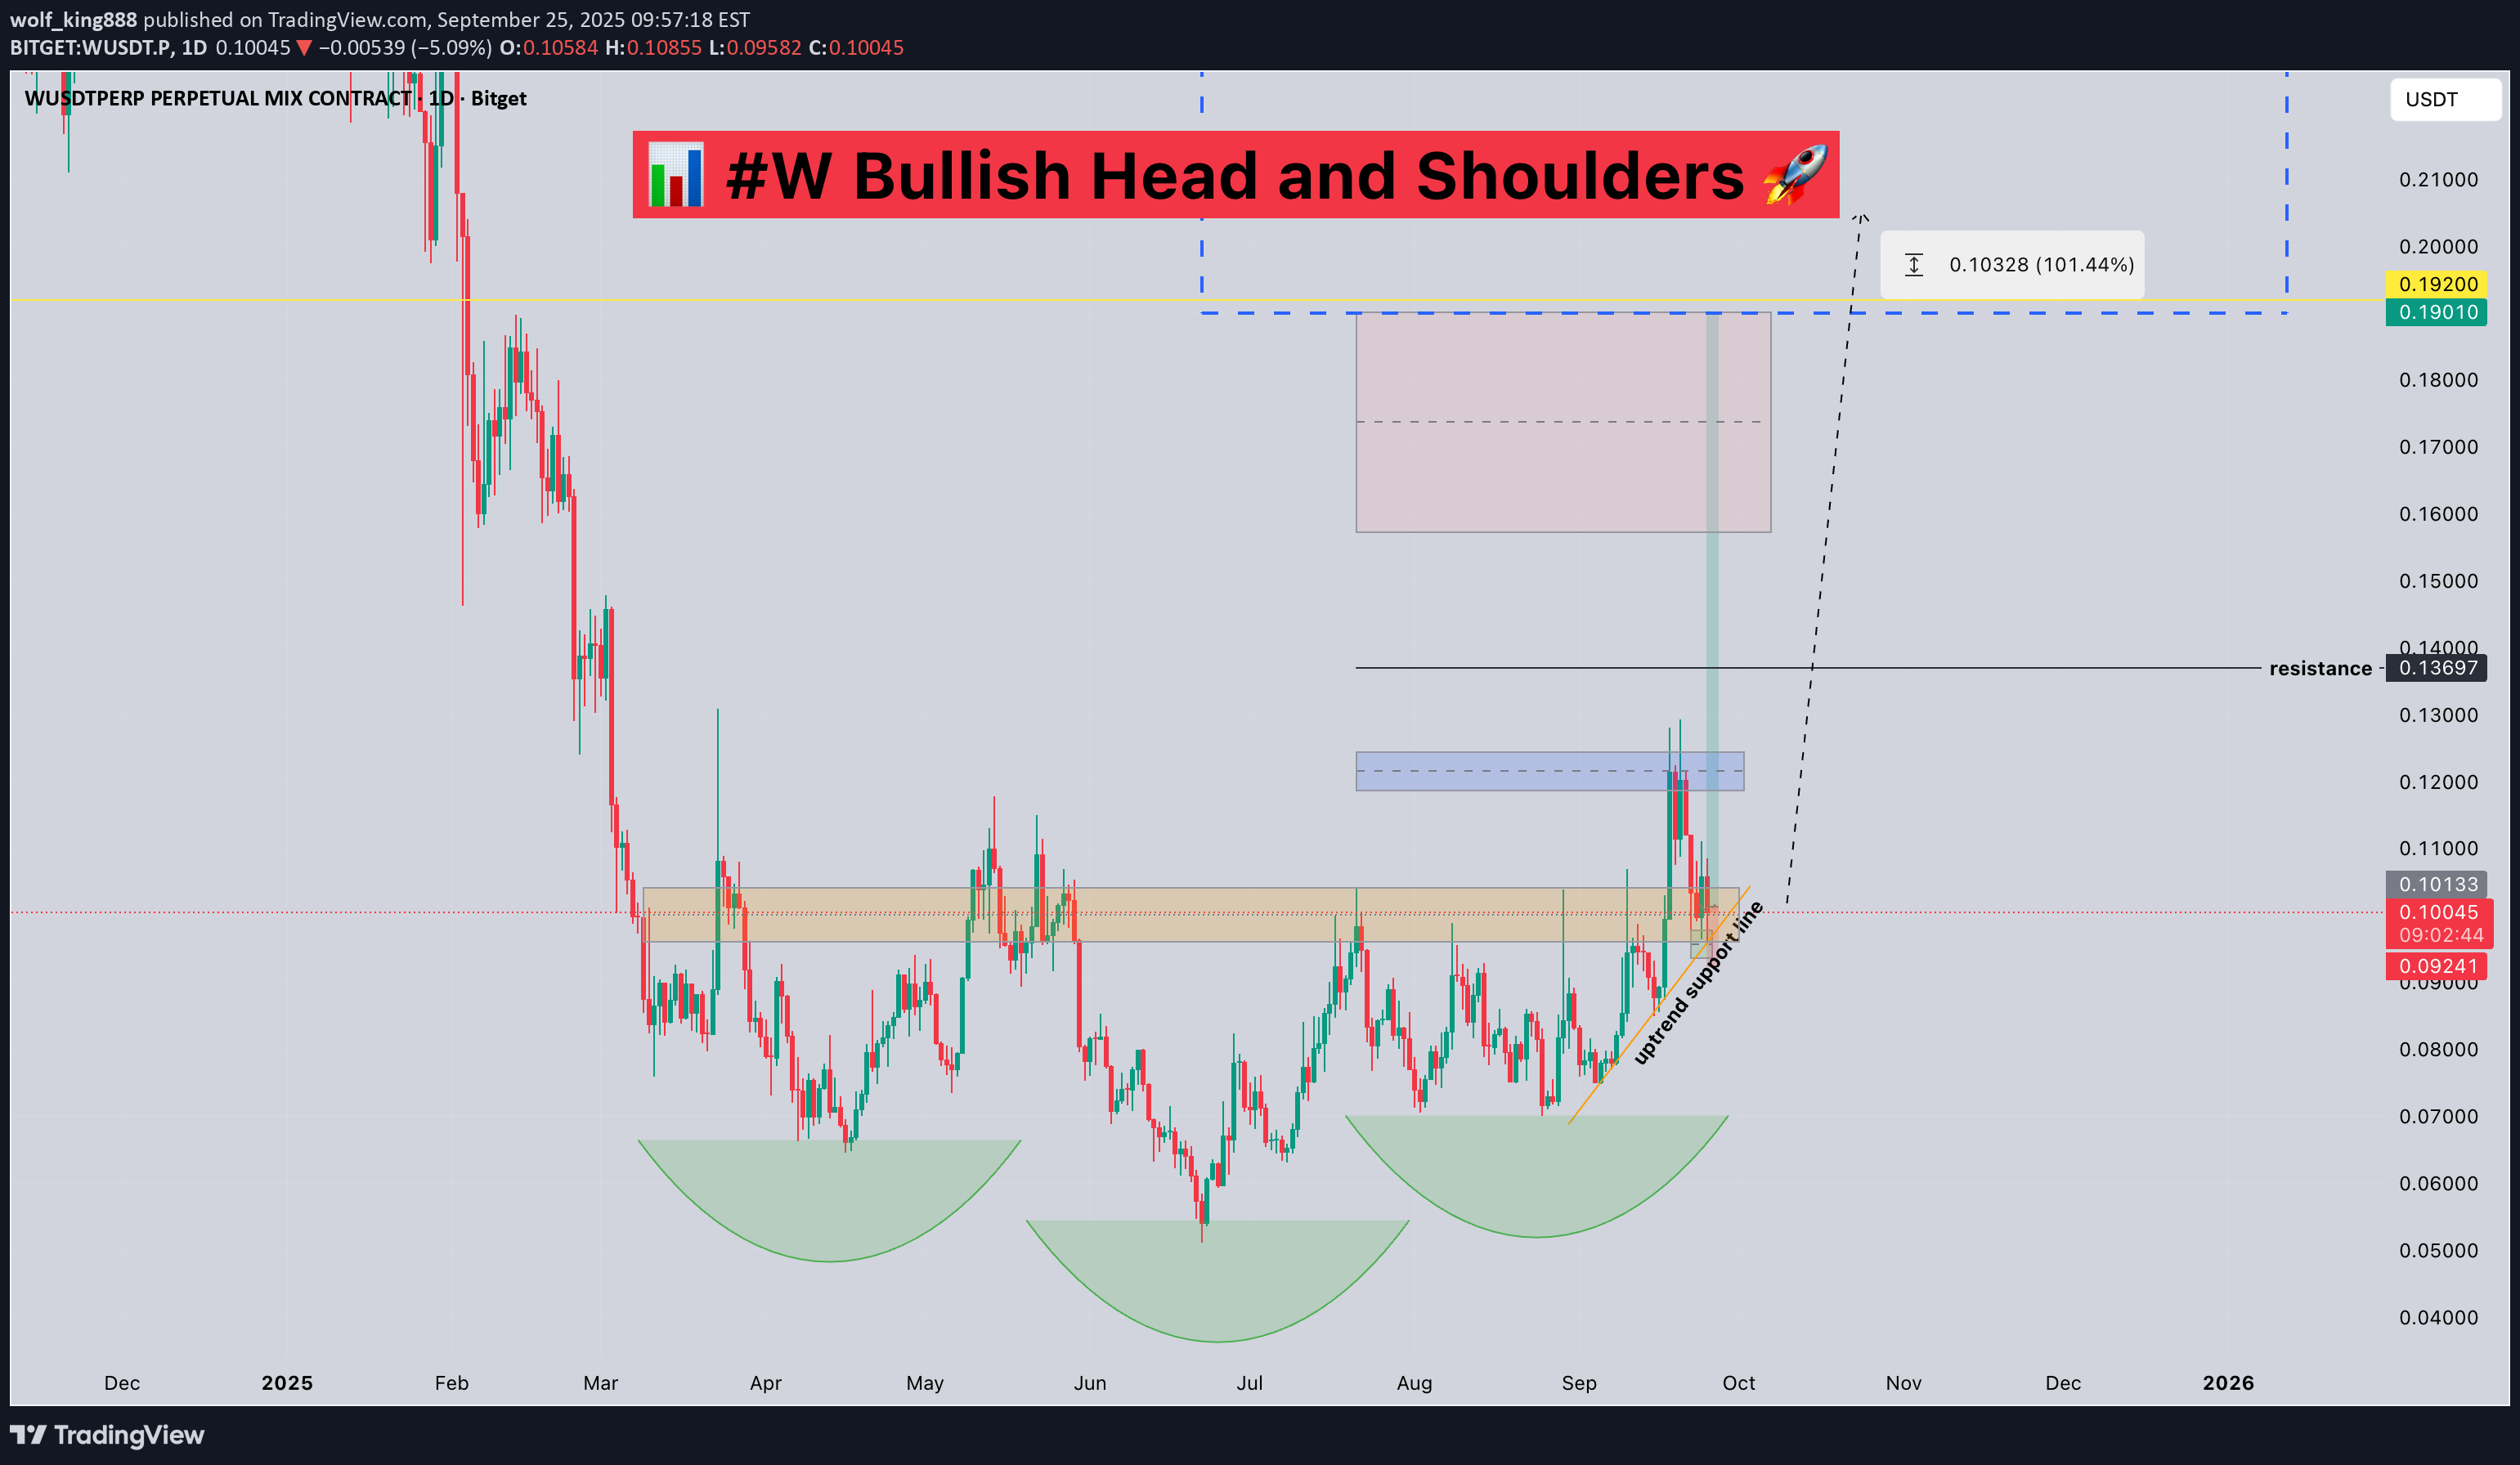
📊 #W Bullish Head and Shoulders 🚀 🧠From a structural perspective, we've formed a bullish head and shoulders pattern at the bottom, currently testing the neckline support area and the uptrend support line. If we can hold here, there's a high probability of a further breakout from here. Let's see 👀 🤜If you like my analysis, please like 💖 and share 💬 WUSDT.P#W 🎯TP1✔️ 🔒Lock in 50% profit💰 ➡️SL moves to breakeven⚖️#W We attempted to break through the blue resistance zone three times but failed each time. Therefore, we manually reduced our holdings by another 30%, bringing our total to 80%, leaving the remaining 20% open. If we get stuck at the blue resistance zone and continue to decline, we can buy back the reduced holdings within the neckline and green buy zone.

SpartaBTC
W Secondary. Reversed Head and Shoulders Key Area. 18 09 25
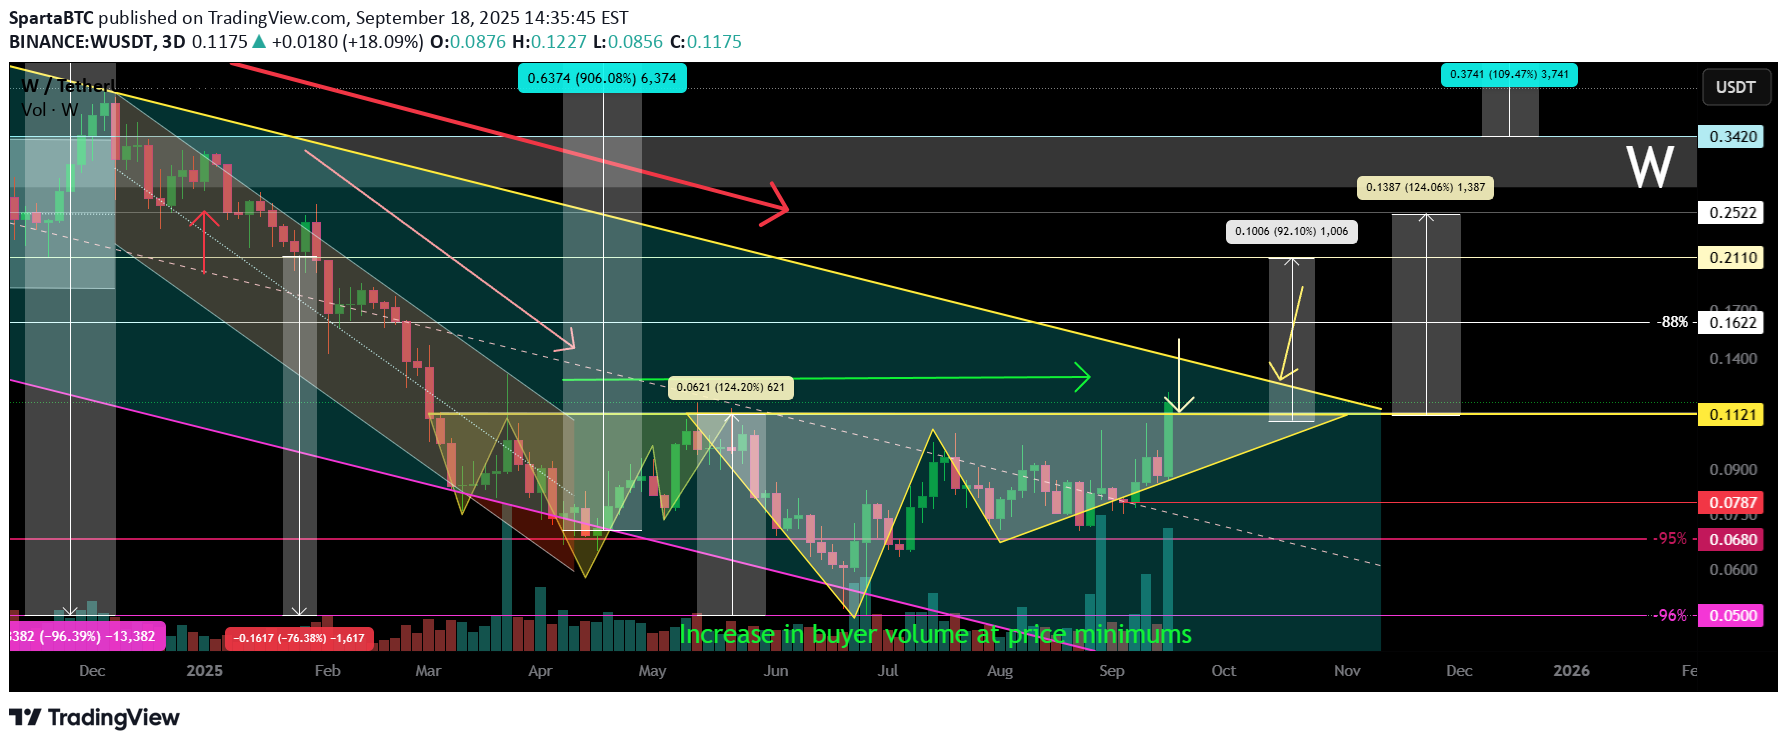
Logarithm. 3 days. Main trend 23 03 2025 A breakout of the previously mentioned key resistance (pair to USD) occurs on huge buying volume and an exit from the sideways trend (inverse head and shoulders). Local targets, in case the inverse head and shoulders pattern is realized and a bowl forms at the next resistance level (previous consolidation).

CryptoWithJames
WUSDT UPDATE
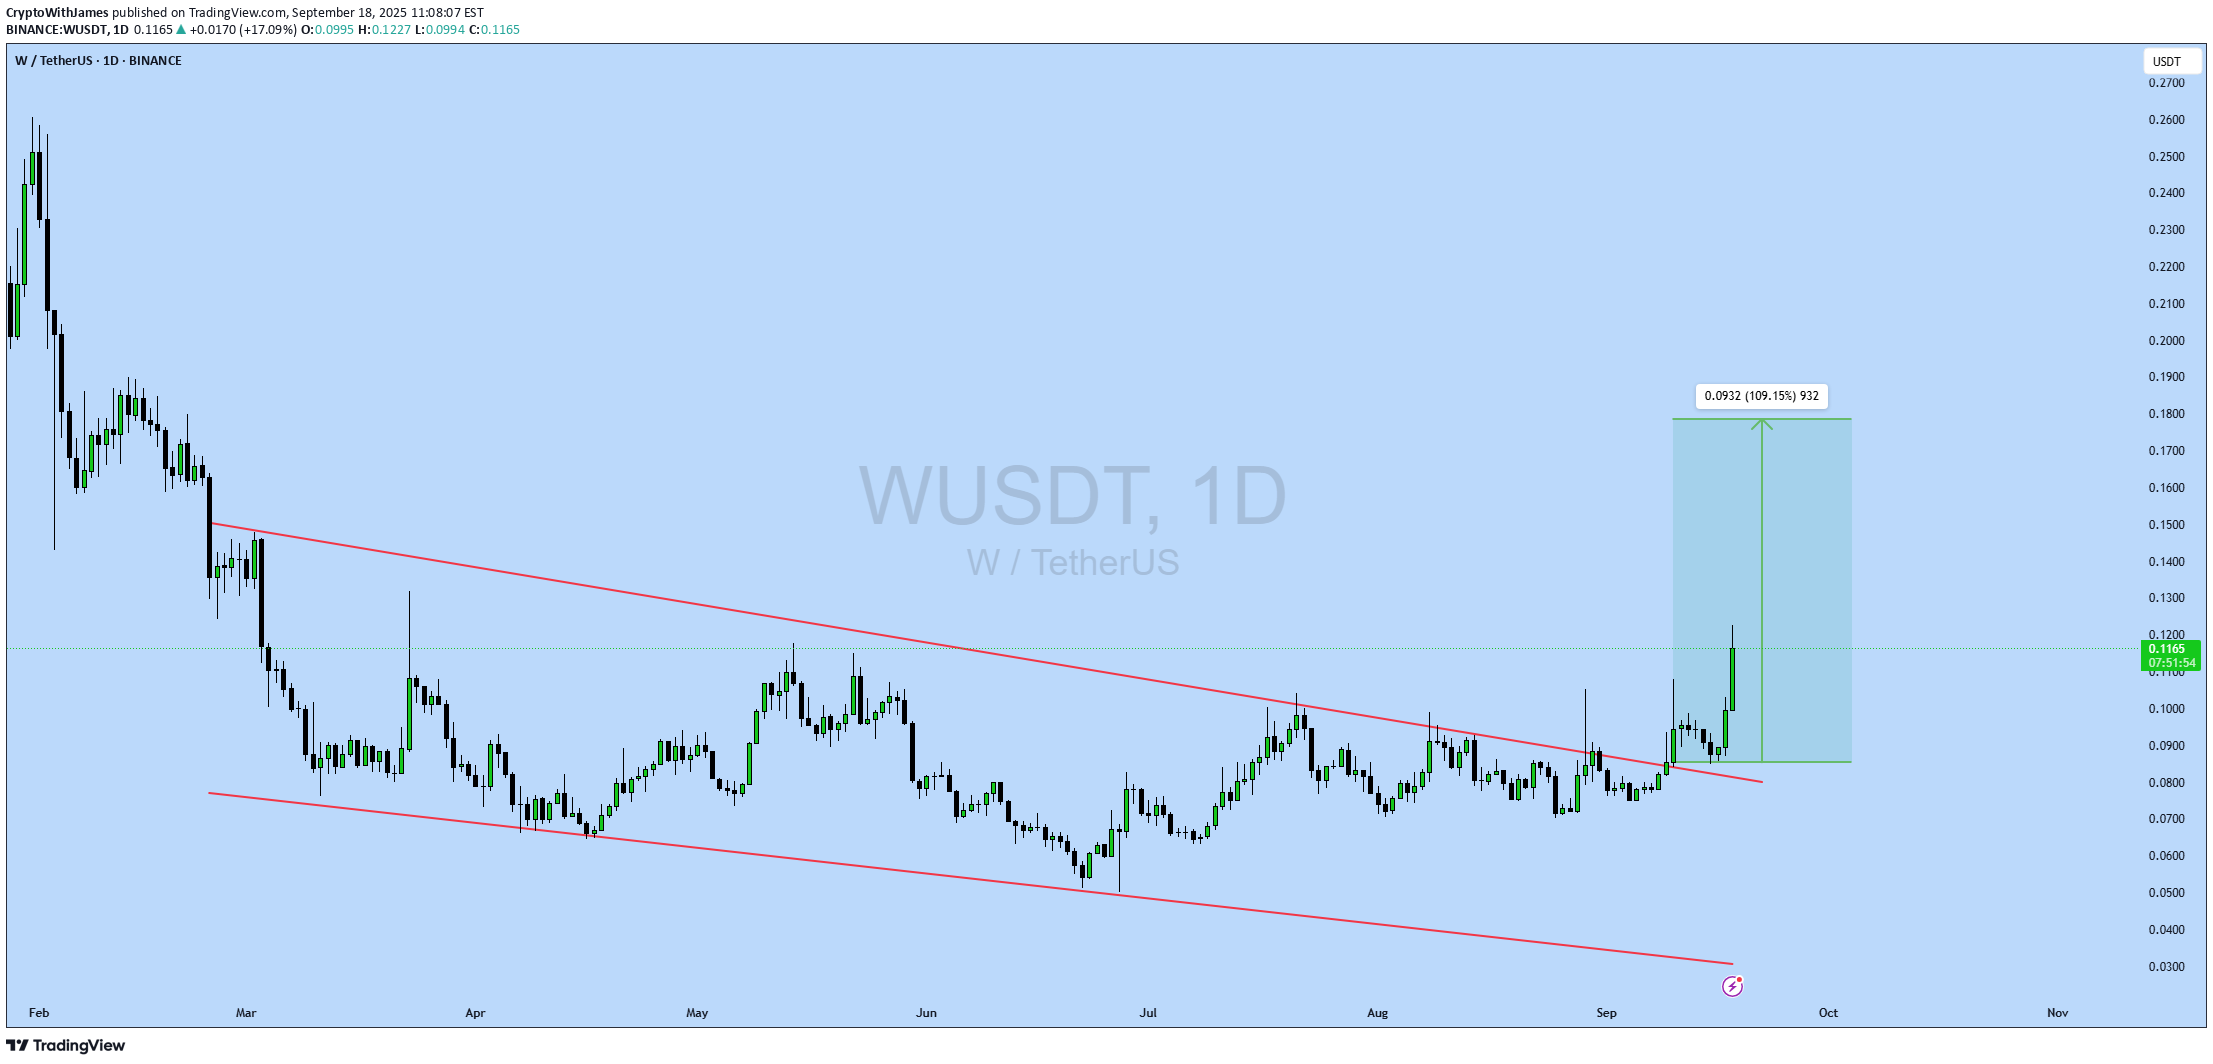
#W UPDATE W Technical Setup Pattern: Bullish Falling Wedge Pattern Current Price: $0.2145 Target Price: $0.3010 Target % Gain: 110.29% $W is breaking out of a falling wedge pattern on the 1D timeframe. Current price is $0.2145 with a target near $0.3010, showing about 40% potential upside. The breakout confirms bullish momentum with structure favoring continuation. Always use proper risk management. Time Frame: 1D Risk Management Tip: Always use proper risk management.
Disclaimer
Any content and materials included in Sahmeto's website and official communication channels are a compilation of personal opinions and analyses and are not binding. They do not constitute any recommendation for buying, selling, entering or exiting the stock market and cryptocurrency market. Also, all news and analyses included in the website and channels are merely republished information from official and unofficial domestic and foreign sources, and it is obvious that users of the said content are responsible for following up and ensuring the authenticity and accuracy of the materials. Therefore, while disclaiming responsibility, it is declared that the responsibility for any decision-making, action, and potential profit and loss in the capital market and cryptocurrency market lies with the trader.