VELO
Velo
| تریدر | نوع سیگنال | حد سود/ضرر | زمان انتشار | مشاهده پیام |
|---|---|---|---|---|
No results found. | ||||
Price Chart of Velo
سود 3 Months :
سیگنالهای Velo
Filter
Sort messages by
Trader Type
Time Frame

MohamedSewid
آپدیت ماهانه ولت (VELO): آیا "قمرنومبر" آغاز یک صعود بزرگ است؟
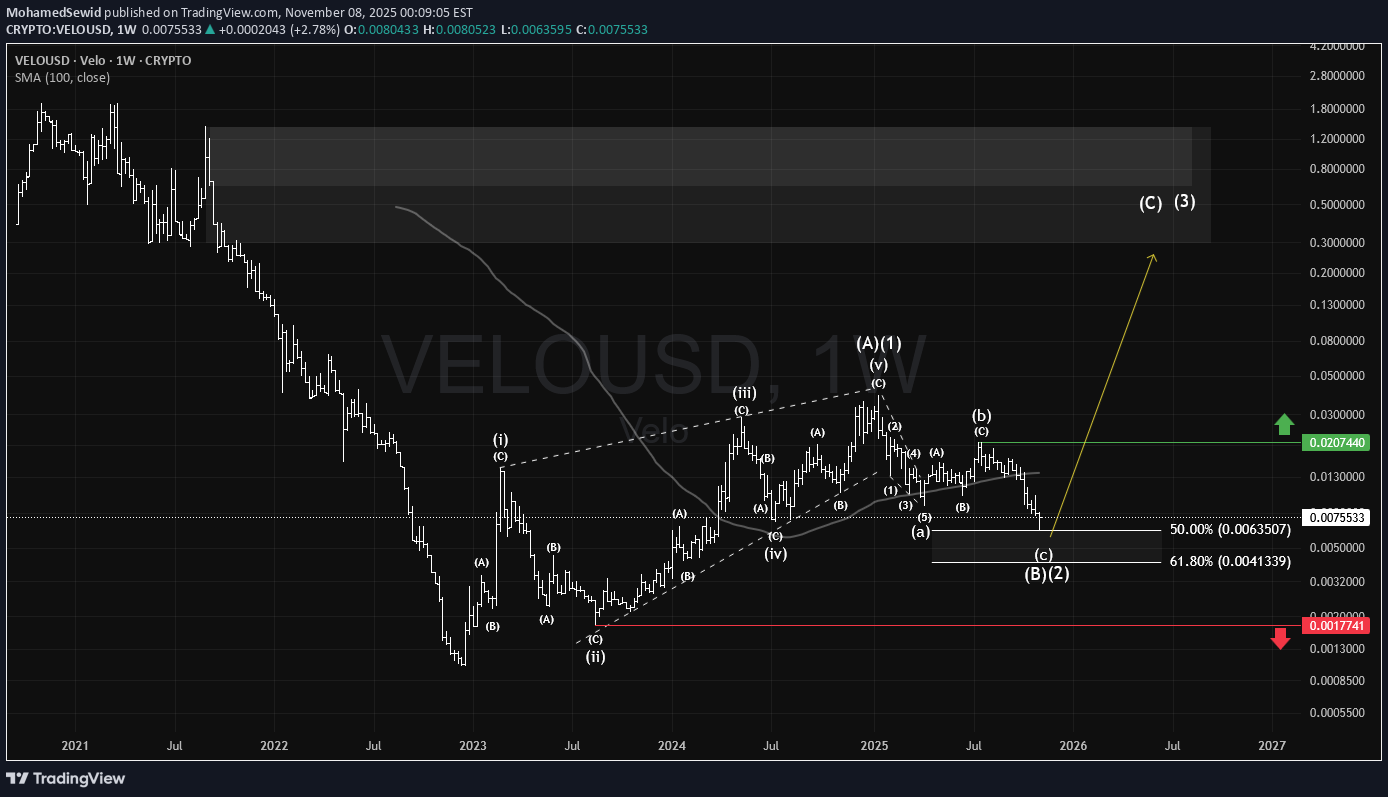
#VELO appears to have completed its corrective 2nd wave from the early 2025 peak, following a strong 2-year impulse wave that began in early 2023. Passing $0.02 could confirm a bullish reversal, optimistically targeting the 2020–2021 price ranges.

TRADEKING_1988
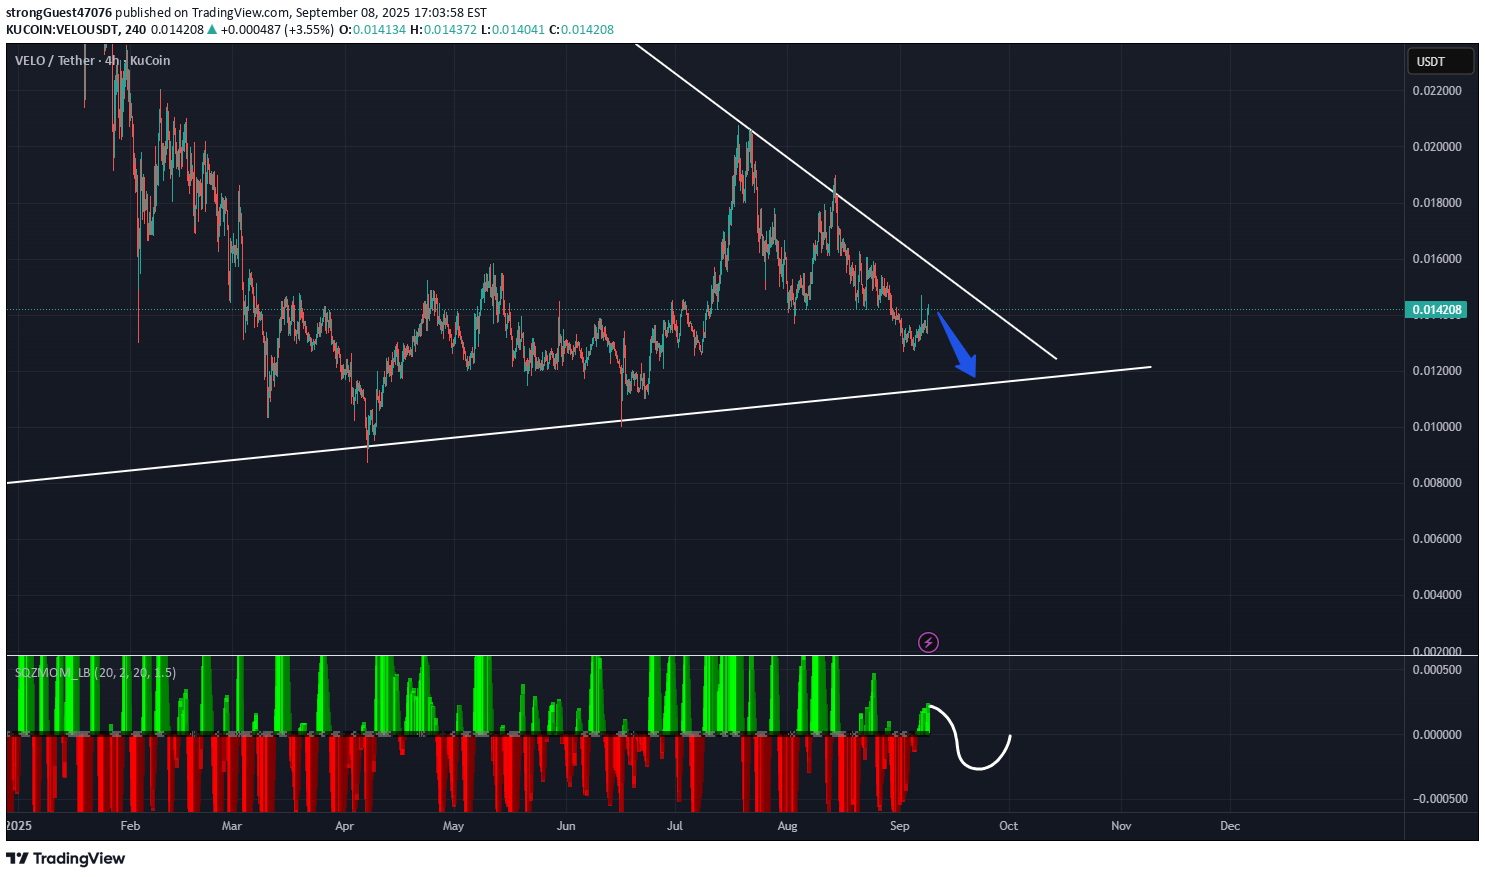
شکست خط روند و منطقه نقدینگی قوی: راز ورود موفق به بازار!
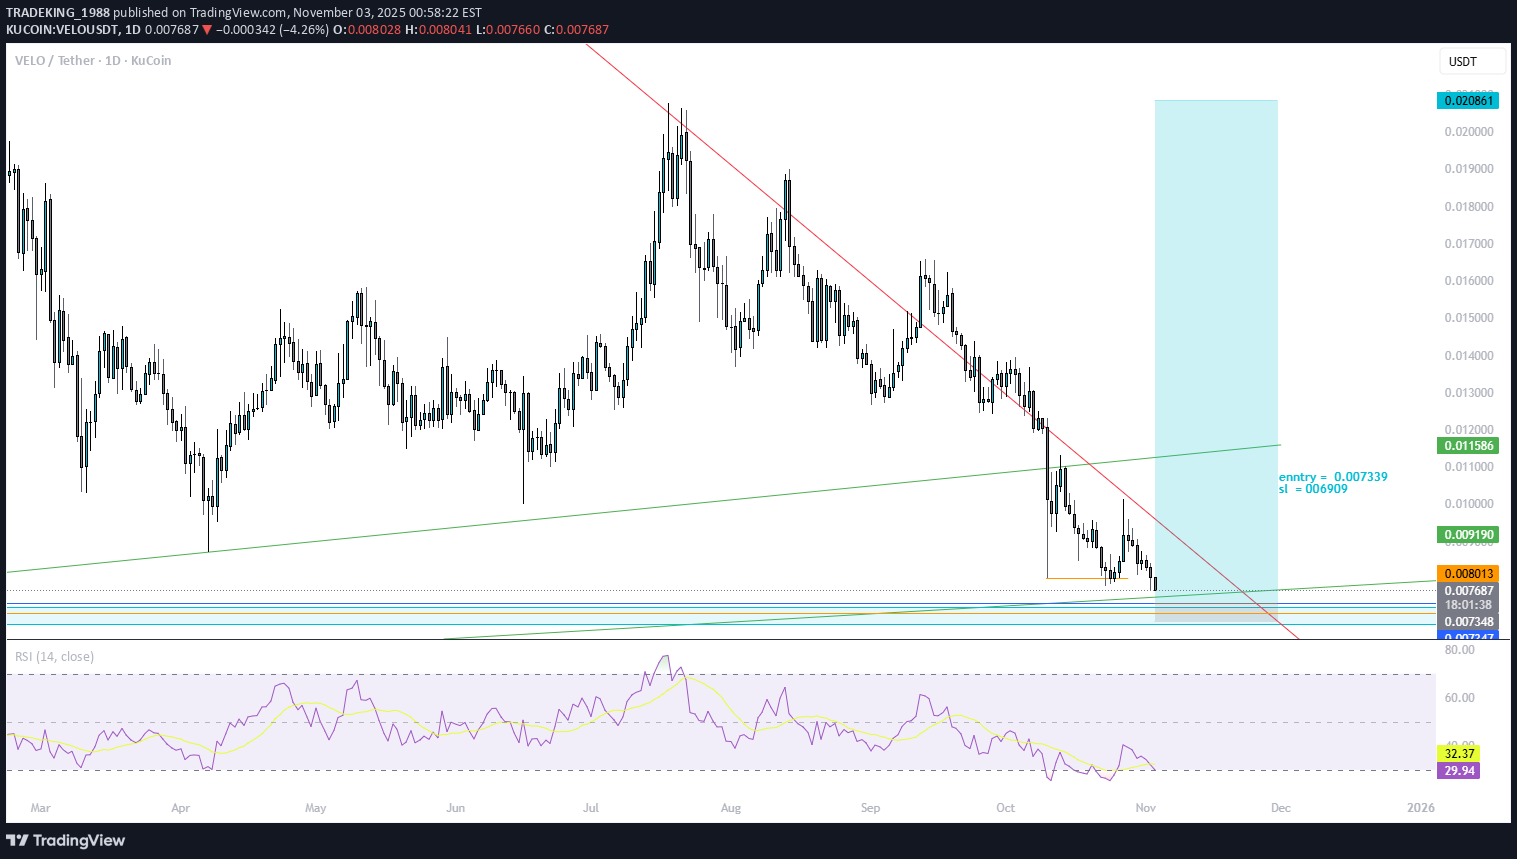
- trendline fakeout green trenline -very strong swap zone -4 daily wipes -liquidity taken

EtherNasyonaL
سطح بحرانی $VELO: دوراهی صعود یا سقوط بزرگ در انتظار قیمت!
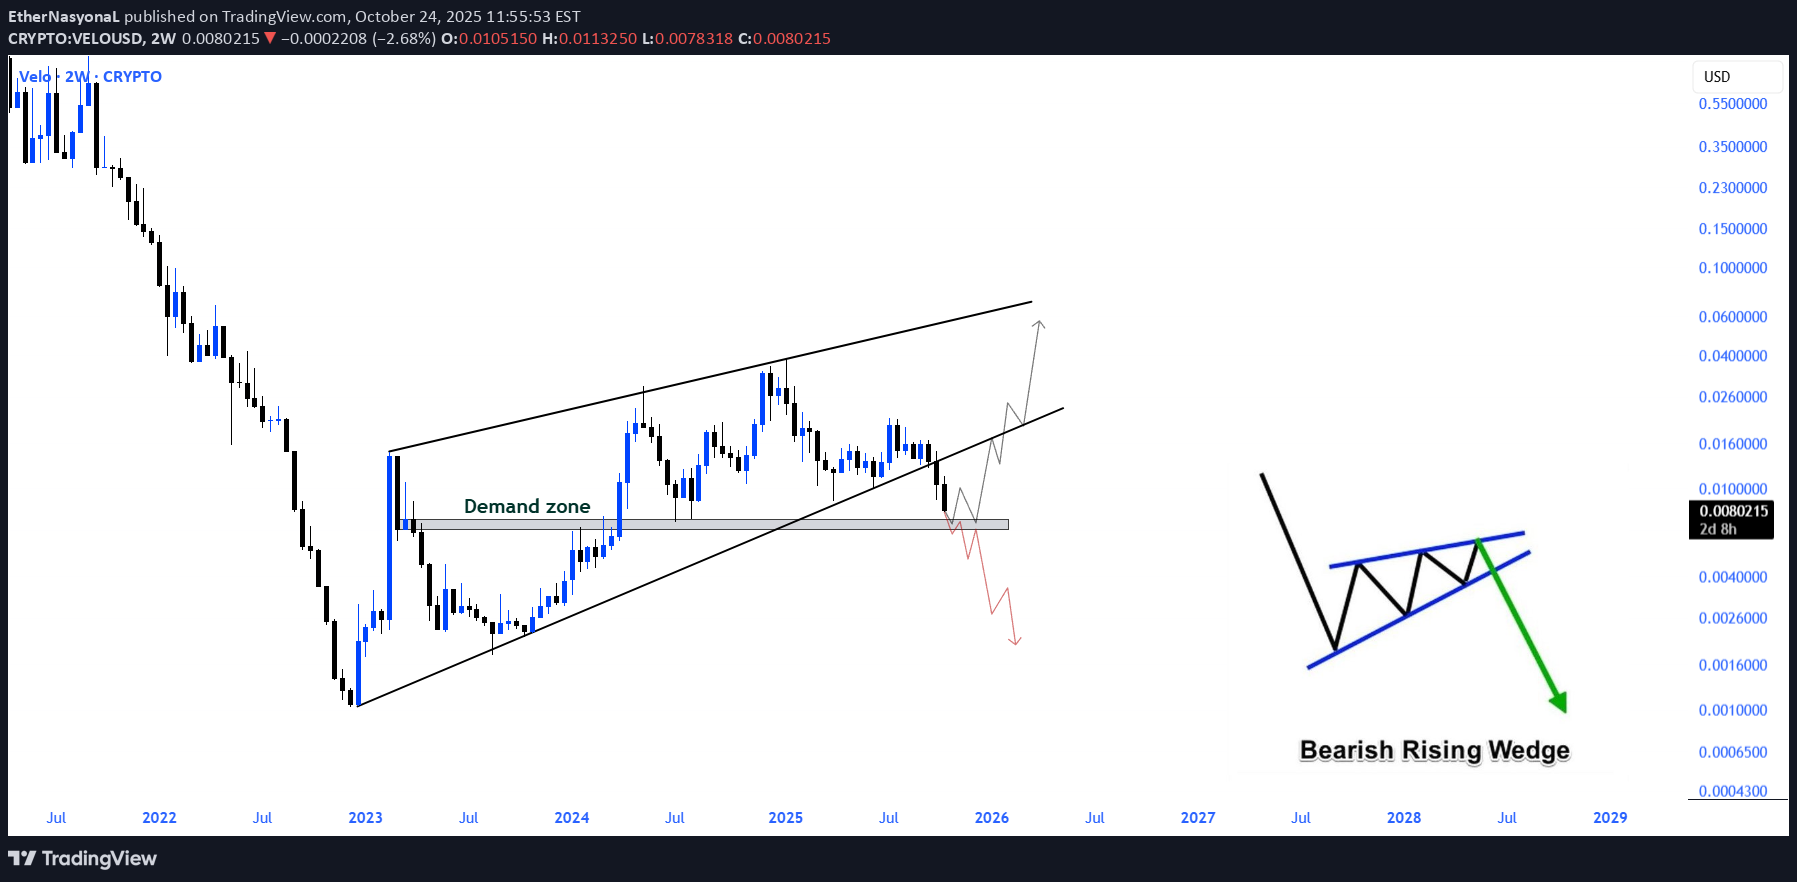
The VELO chart has completed a retest after a classic Bearish Rising Wedge breakout. It's currently heading directly towards the demand zone. A strong reaction from here could lead to a return to the wedge; otherwise, a major decline could open the door.VELO demand zone reaction | critical moment 🔃 Velo perfectly reacted from the demand zone after the Rising Wedge breakdown retest. As long as this reaction holds, a revisit to the wedge area remains likely. However, losing momentum here could still trigger the larger decline scenario once again.

strongGuest47076
long velo 1h
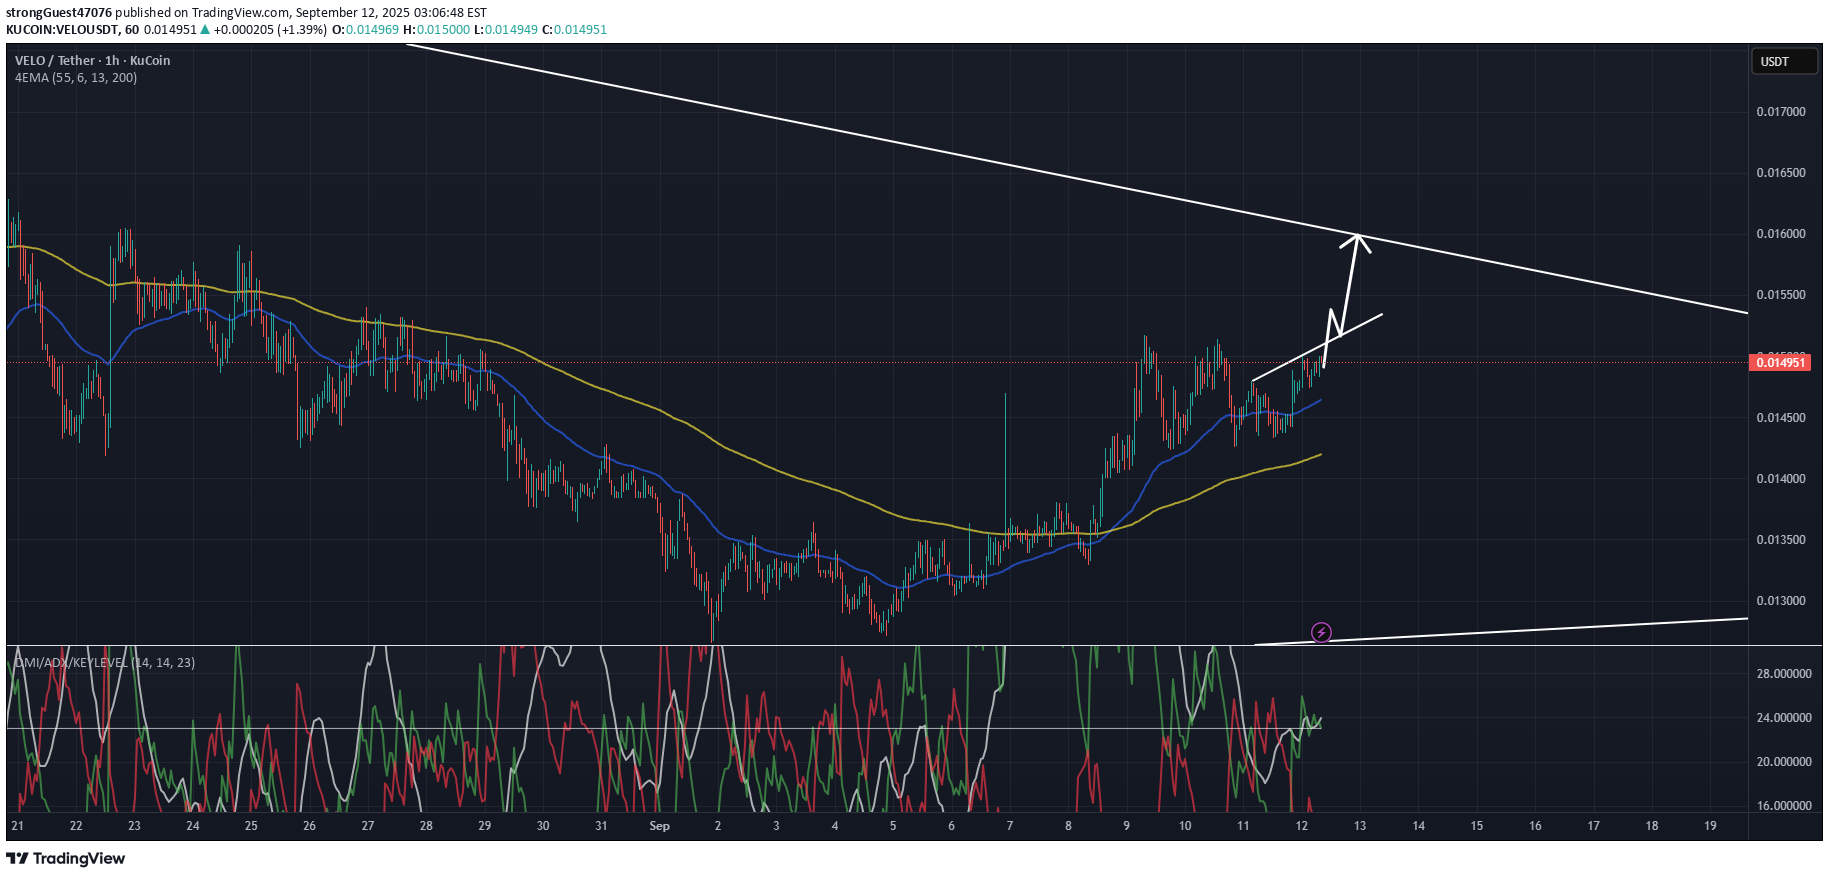
The Velo is preparing to start a new bullish rally in the coming hours. The Adix shows upward bullish strength and candles are about to break out of a sideways channel.

lemonsandshade
VELO - 5 waves down corrective move, 10x opp
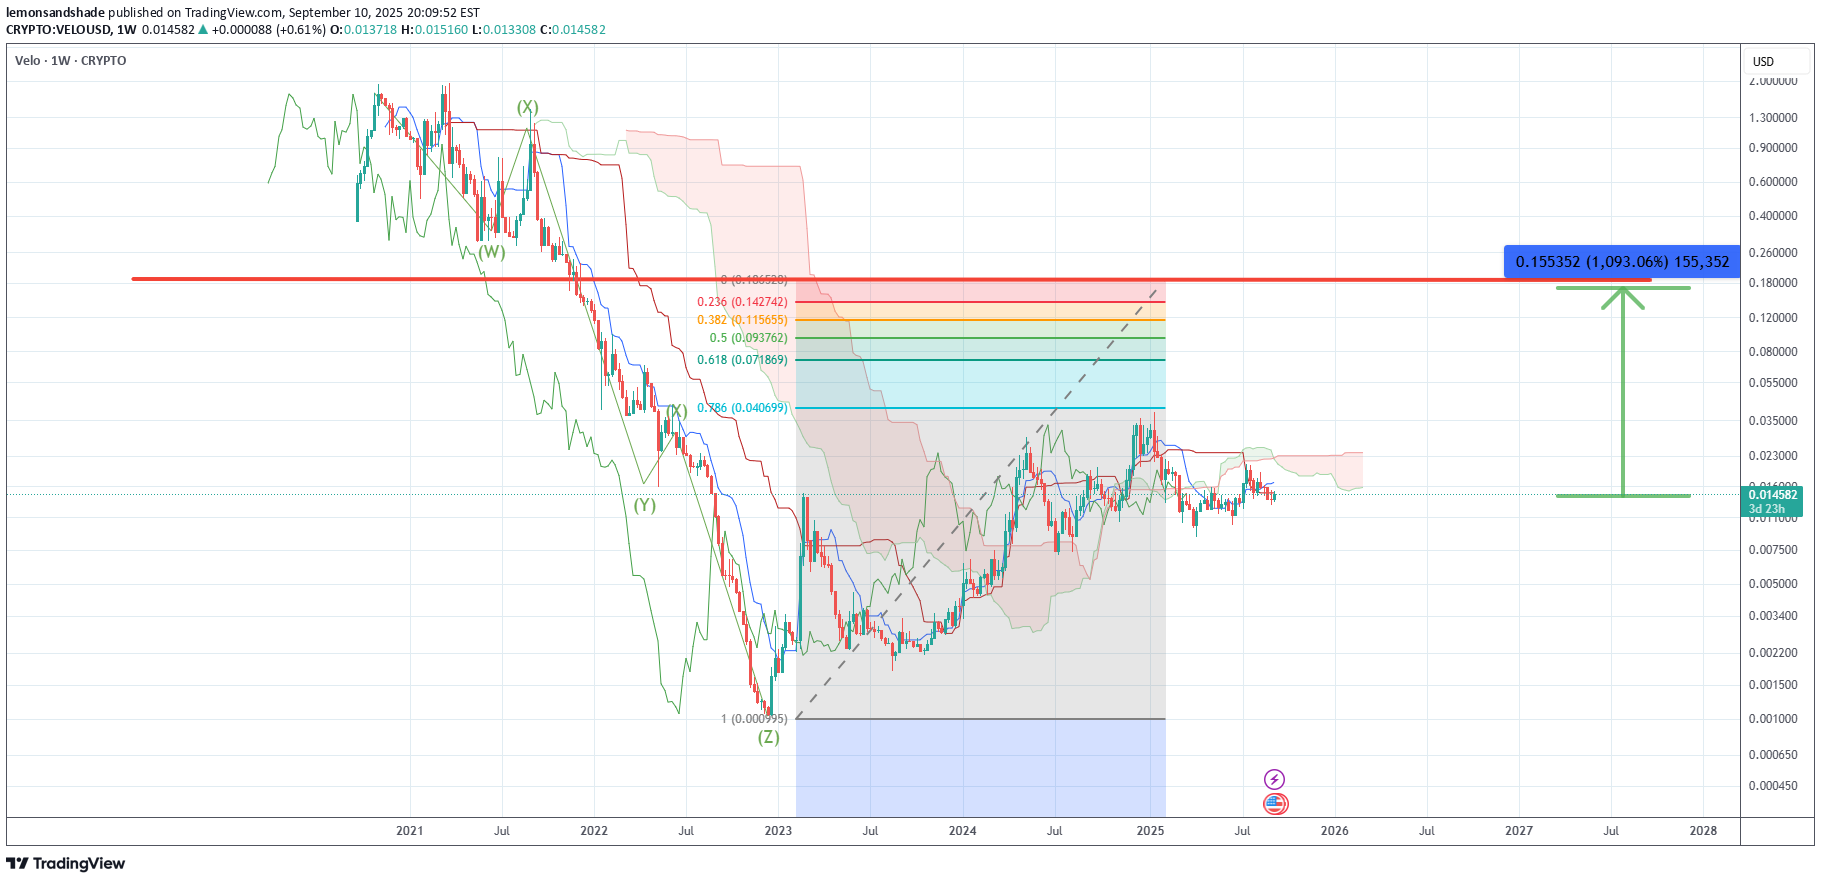
Looks like a nice 5 wave down move, bottom formation, then impulse up. 10x from here looks right.
strongGuest47076
velo long to 0.017
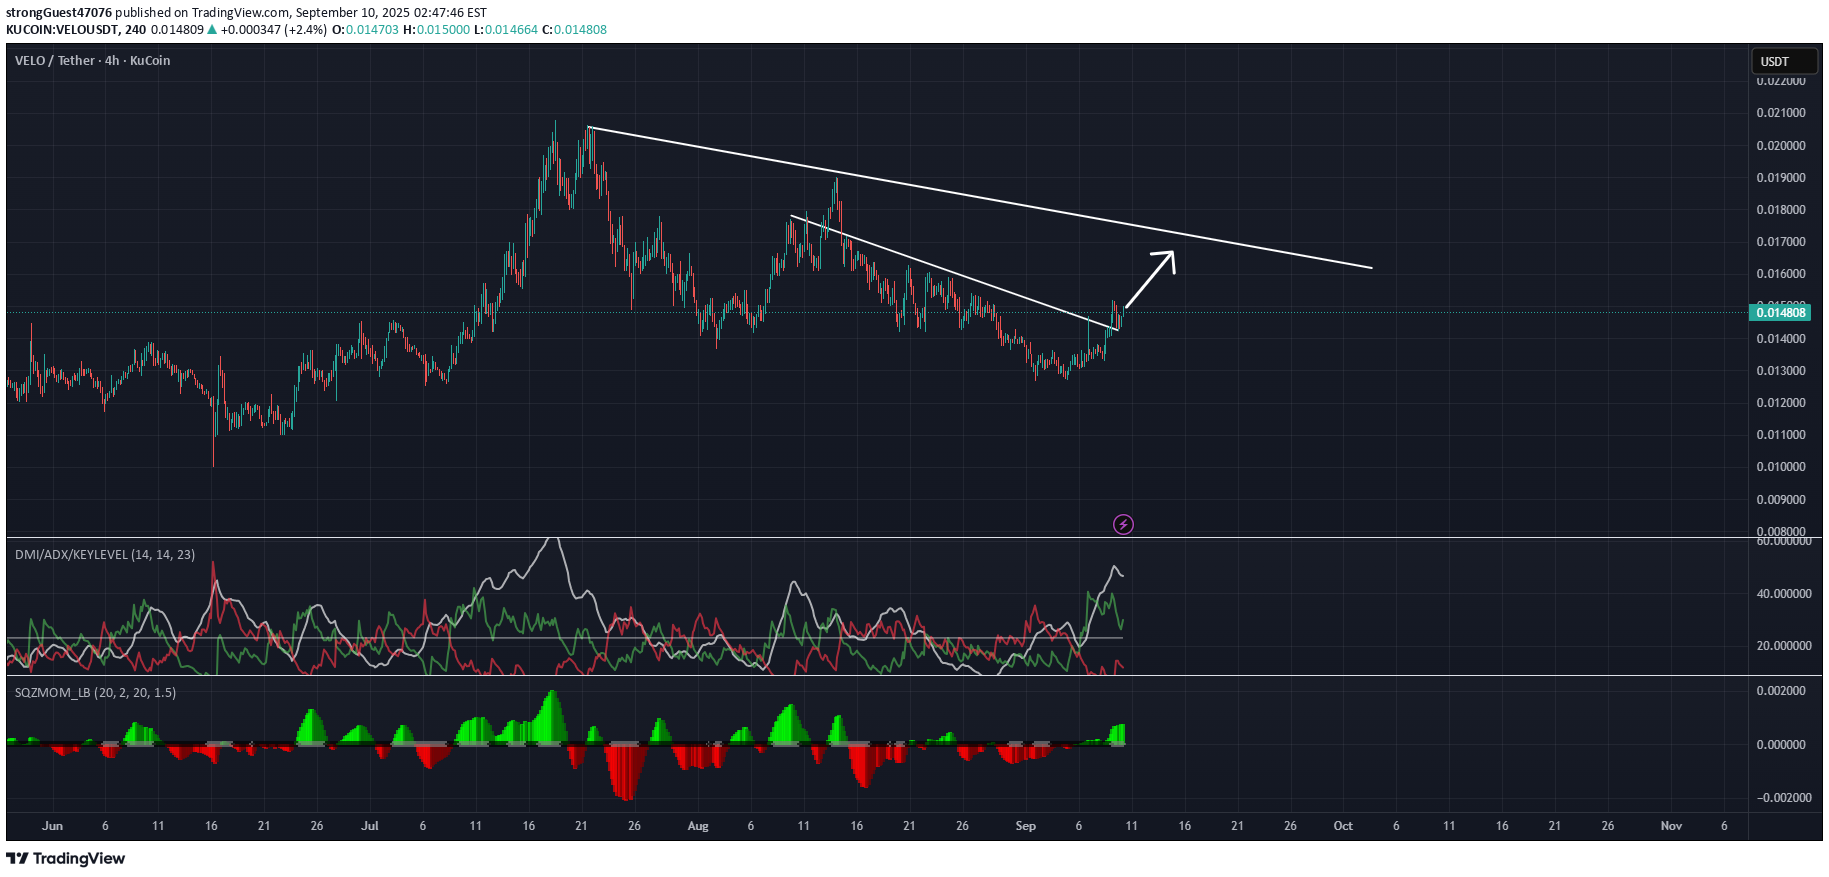
The ADX shows us a strong upward trend, indicating that momentum is beginning to rise. Therefore, a strong recovery awaits us to reach 0.017.
strongGuest47076

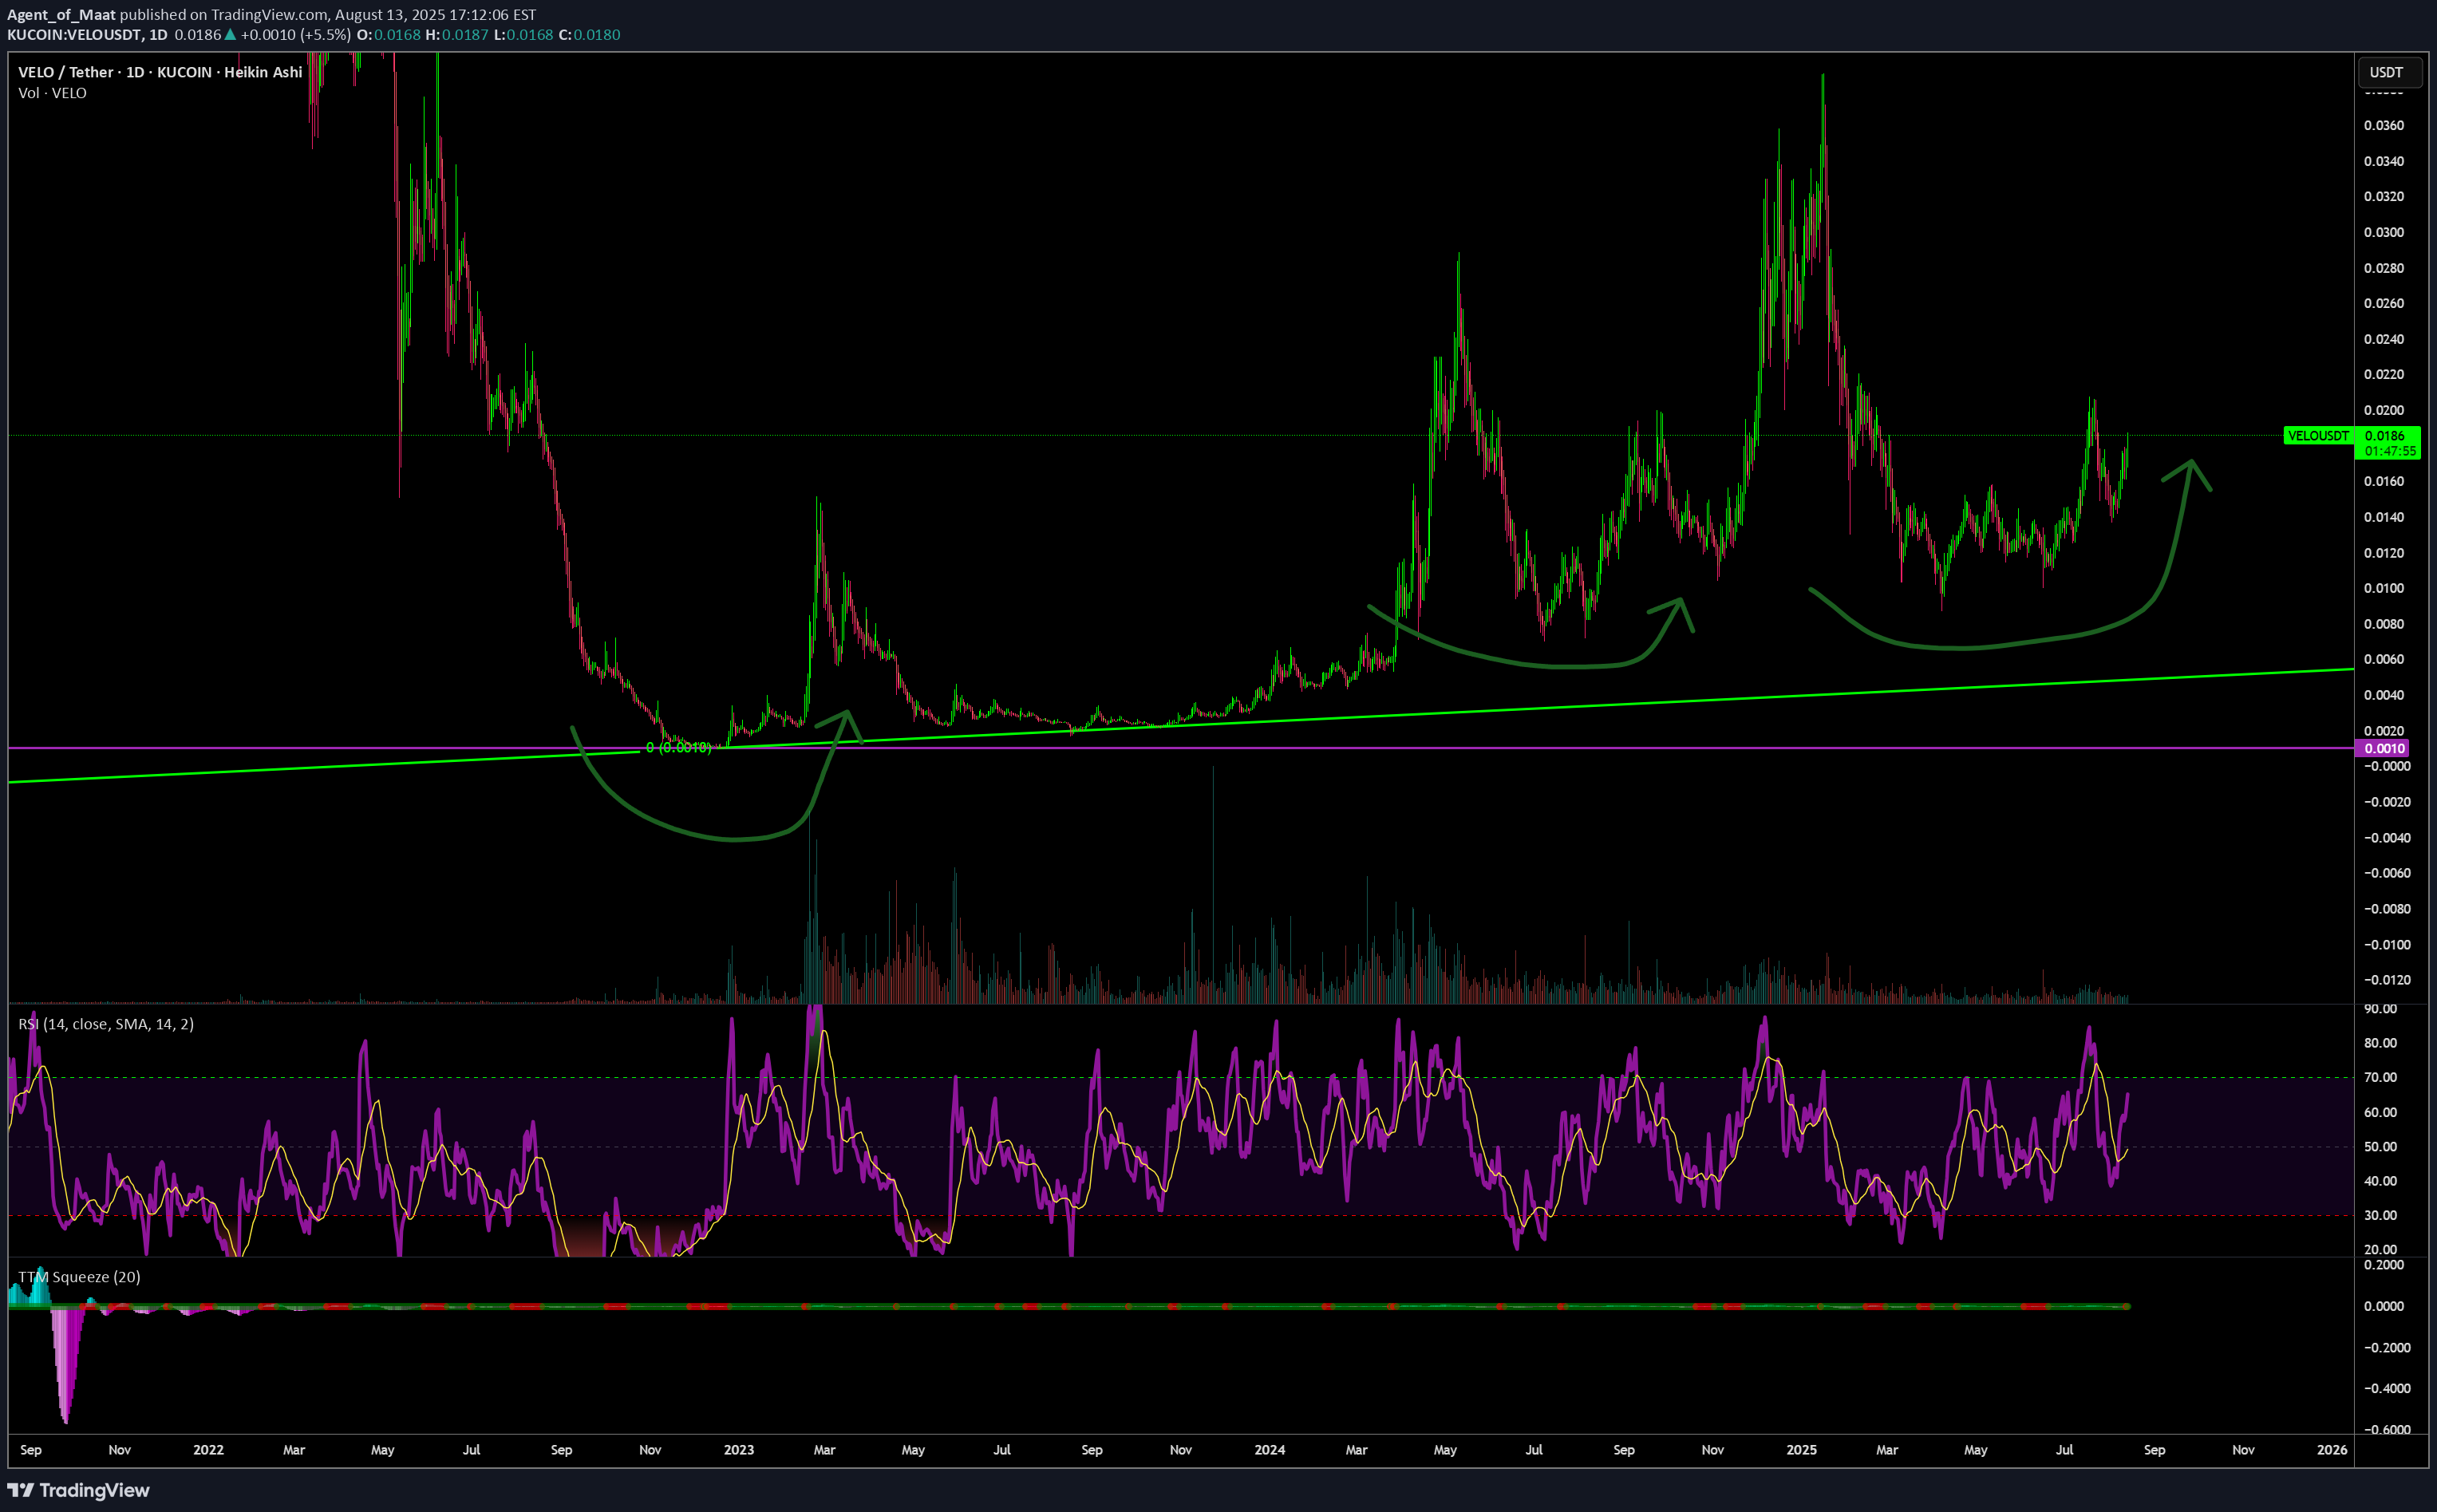
Agent_of_Maat
Velo looking to breakout and melt faces. Bullish

mamdouhrefaat


bloodrain81
This is what I see this asset reaching at Macro level time frame

NFA, please invest only what you can afford to lose and always use 1-3% stop loss as a rule! This trade can always go sideways. I will be buying some positions in spot soon...
Disclaimer
Any content and materials included in Sahmeto's website and official communication channels are a compilation of personal opinions and analyses and are not binding. They do not constitute any recommendation for buying, selling, entering or exiting the stock market and cryptocurrency market. Also, all news and analyses included in the website and channels are merely republished information from official and unofficial domestic and foreign sources, and it is obvious that users of the said content are responsible for following up and ensuring the authenticity and accuracy of the materials. Therefore, while disclaiming responsibility, it is declared that the responsibility for any decision-making, action, and potential profit and loss in the capital market and cryptocurrency market lies with the trader.