
TURBO
Turbo
| تریدر | نوع سیگنال | حد سود/ضرر | زمان انتشار | مشاهده پیام |
|---|---|---|---|---|
 Javlonbek4000Rank: 1082 | خرید | حد سود: تعیین نشده حد ضرر: تعیین نشده | 12/2/2025 | |
 CryptoNuclearRank: 31901 | خرید | حد سود: تعیین نشده حد ضرر: تعیین نشده | 12/8/2025 | |
 Alpha-GoldFXRank: 31959 | خرید | حد سود: تعیین نشده حد ضرر: تعیین نشده | 12/3/2025 | |
 skainnRank: 32176 | فروش | حد سود: تعیین نشده حد ضرر: تعیین نشده | 12/12/2025 |
Price Chart of Turbo
سود 3 Months :
سیگنالهای Turbo
Filter
Sort messages by
Trader Type
Time Frame
skainn
Turboo
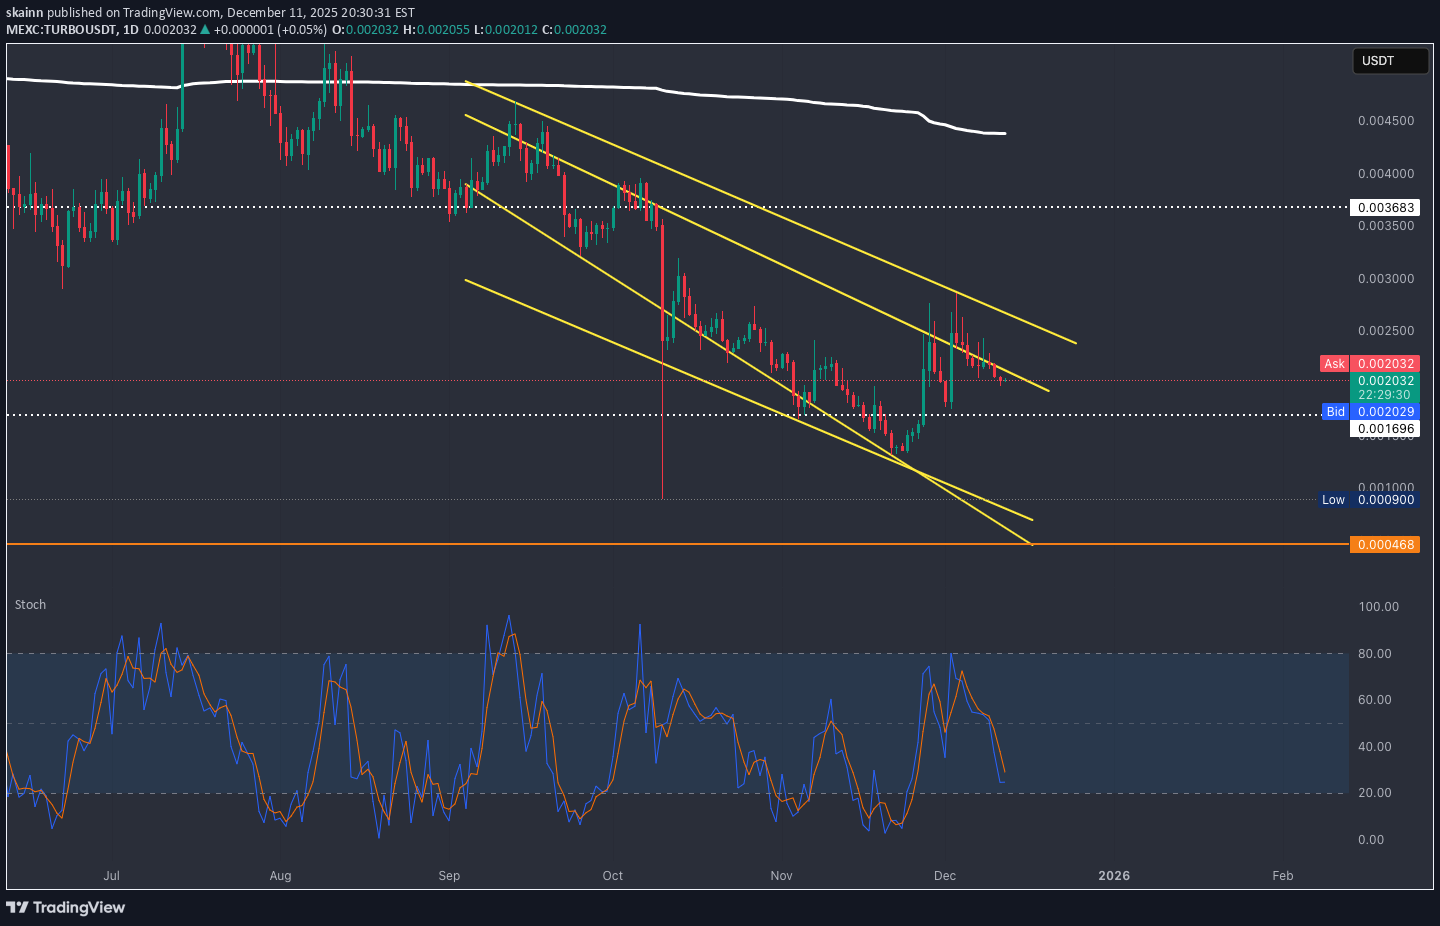
Dear Traders Turbo possible it reach this target lets see if it can play outt :)
CryptoNuclear
تحلیل TURBO/USDT: آیا قیمت در حال برگشت است یا سقوط نهایی؟
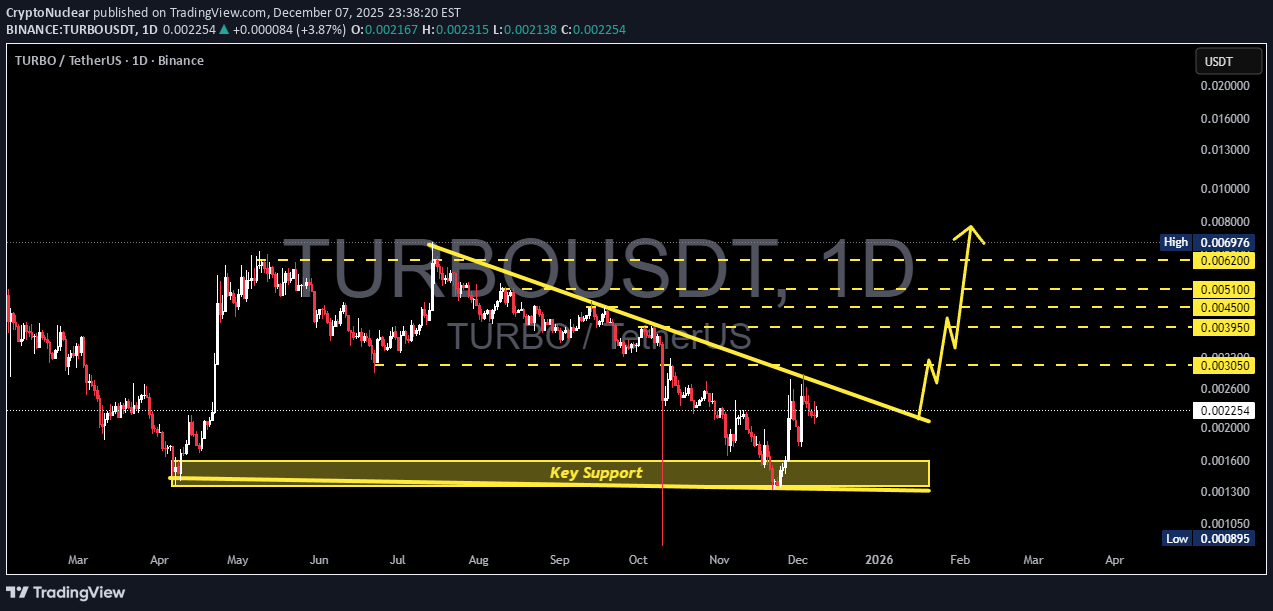
TURBO/USDT is approaching its “Decision Point” — a moment where the market must choose between continuing the multi-month downtrend or triggering a major reversal from a demand zone that has repeatedly saved the price from collapse. For months, TURBO has been trapped beneath a descending trendline, with every bounce rejected by persistent selling pressure. But now something different is happening: Price has once again bounced strongly from the Key Support at 0.00135 – 0.0016, a zone that has acted as the base of every recovery since April. In simple terms: If TURBO is ever going to reverse, this is the place. --- Why This Yellow Zone Matters So Much The 0.00135 – 0.0016 support is a historical demand zone. Each touch has produced strong wicks, sharp rejections, or recovery legs. Sellers appear to be losing momentum in this area. This zone defines market psychology: Breakdown = capitulation. Breakout = reversal ignition. There is no more important battlefield on this chart. --- The Big Pattern Forming The structure combines: Descending trendline → ongoing bearish pressure Flat horizontal support (yellow zone) → strong demand floor Potential descending triangle structure — but with signs of bounce strength that could cause a triangle failure, which often triggers explosive upside. When a descending triangle fails to break down, trapped shorts fuel a rally. TURBO is approaching exactly this type of setup — but it requires a confirmed trendline breakout. --- Bullish Scenario (The Exciting One) Key confirmation: ✔ Daily candle close above the descending trendline ✔ Retest turning the trendline into support If this happens, the entire market structure shifts into early reversal mode. Potential upside targets: 0.00305 → first resistance 0.00395 – 0.00450 → major supply block 0.00510 → structural retest level 0.00620 → extended target if momentum accelerates If TURBO breaks and retests the trendline cleanly… This could turn into a powerful swing reversal. --- Bearish Scenario (If Support Breaks) Bearish confirmation: daily close below 0.00135 This would mean: Demand zone is broken Market structure returns fully bearish Next key target: 0.000895 Increased probability of setting new lower lows This scenario represents a capitulation phase where recoveries become much harder. --- TURBO is balancing on its final major foundation — a historical demand zone that will decide between a major trend reversal or the continuation of the macro downtrend. Breakout above the trendline = bullish structure shift + high-reward upside. Breakdown of 0.00135 = full bearish continuation. This is one of those setups where: risk is small, but the decision and direction will be massive. #TURBO #TURBOUSDT #CryptoTA #MarketStructure #BreakoutSetup #AltcoinAnalysis #SupportAndResistance #TrendlineBreak #DemandZone

Heruprabowo
فرصت خرید عالی در TURBO/USDT: لانگ پرقدرت پس از نقدینگیگیری!
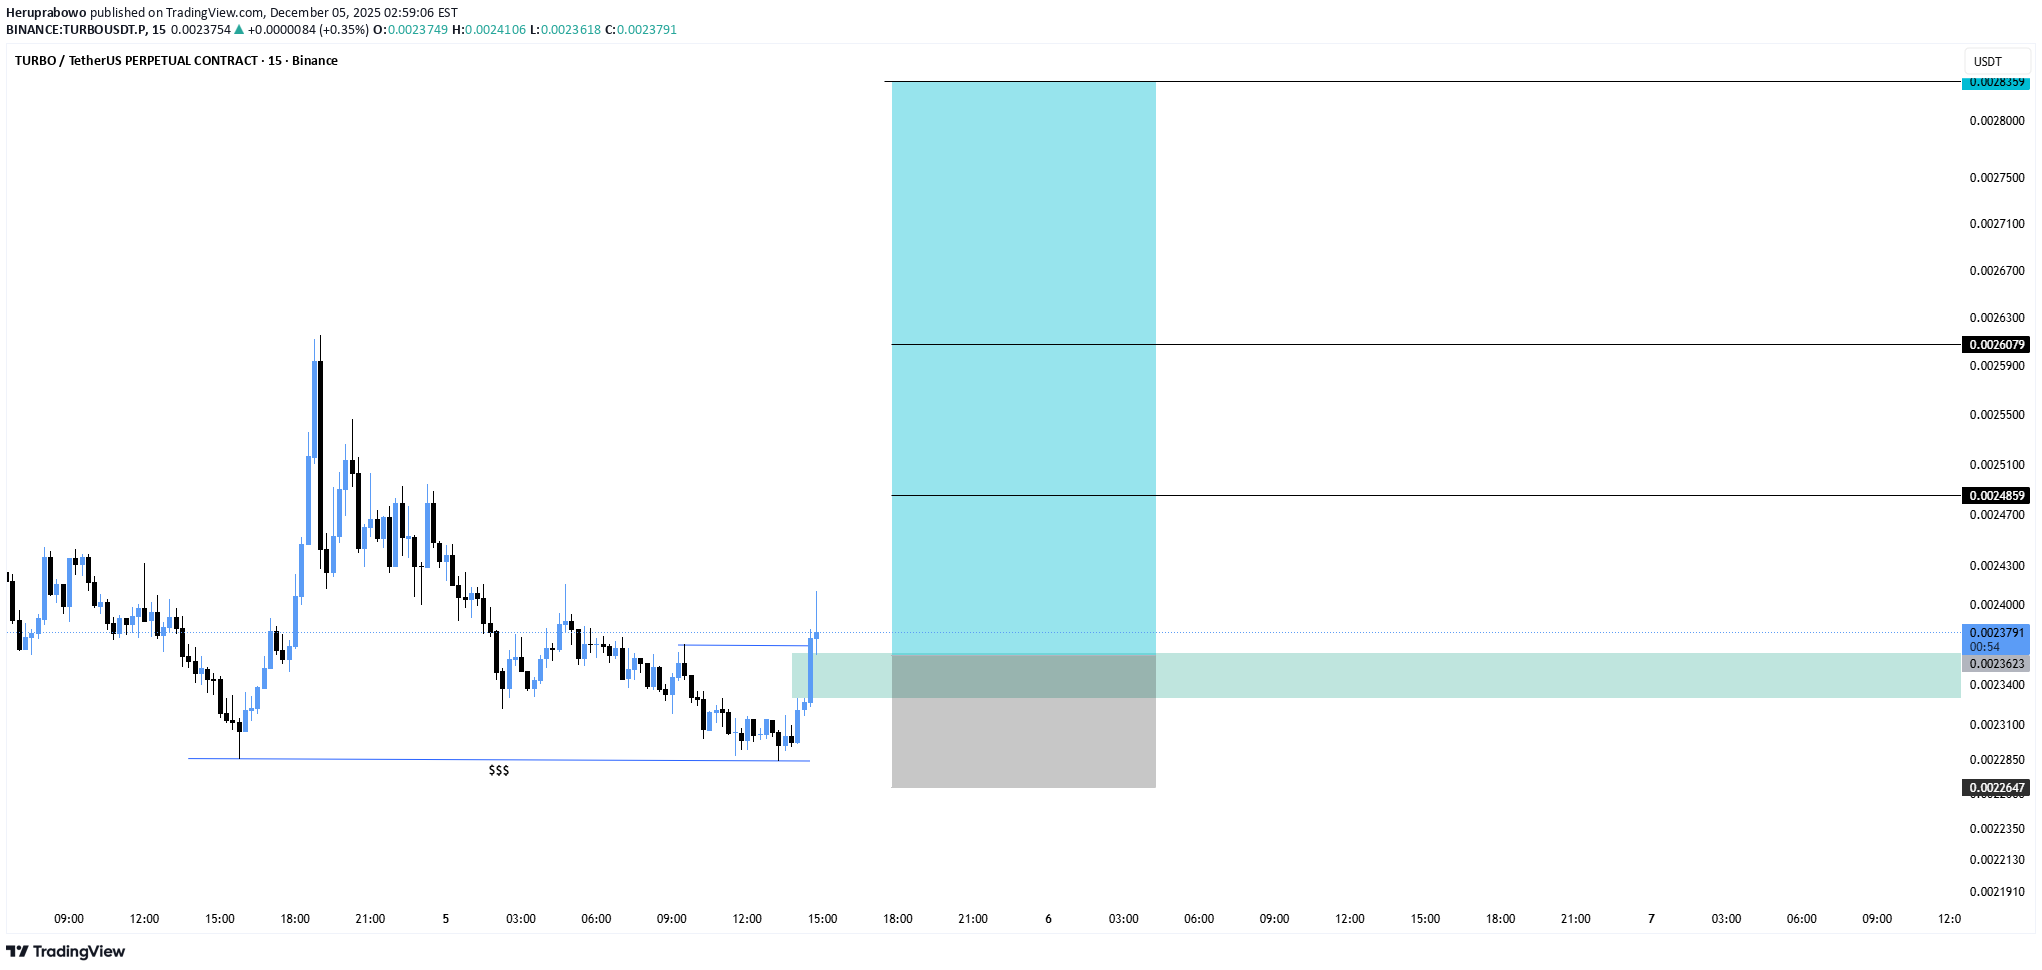
Price swept the liquidity (SSS) and instantly reacted with a strong bullish push. Structure is shifting short-term, giving a clean long opportunity as price taps the demand zone. Entry: 0.0023623 Stop Loss: 0.0022647 TP1: 0.0024859 TP2: 0.0026079 Final TP: 0.0028359 #TURBO #TURBOUSDT #TURBOUSDTPERP
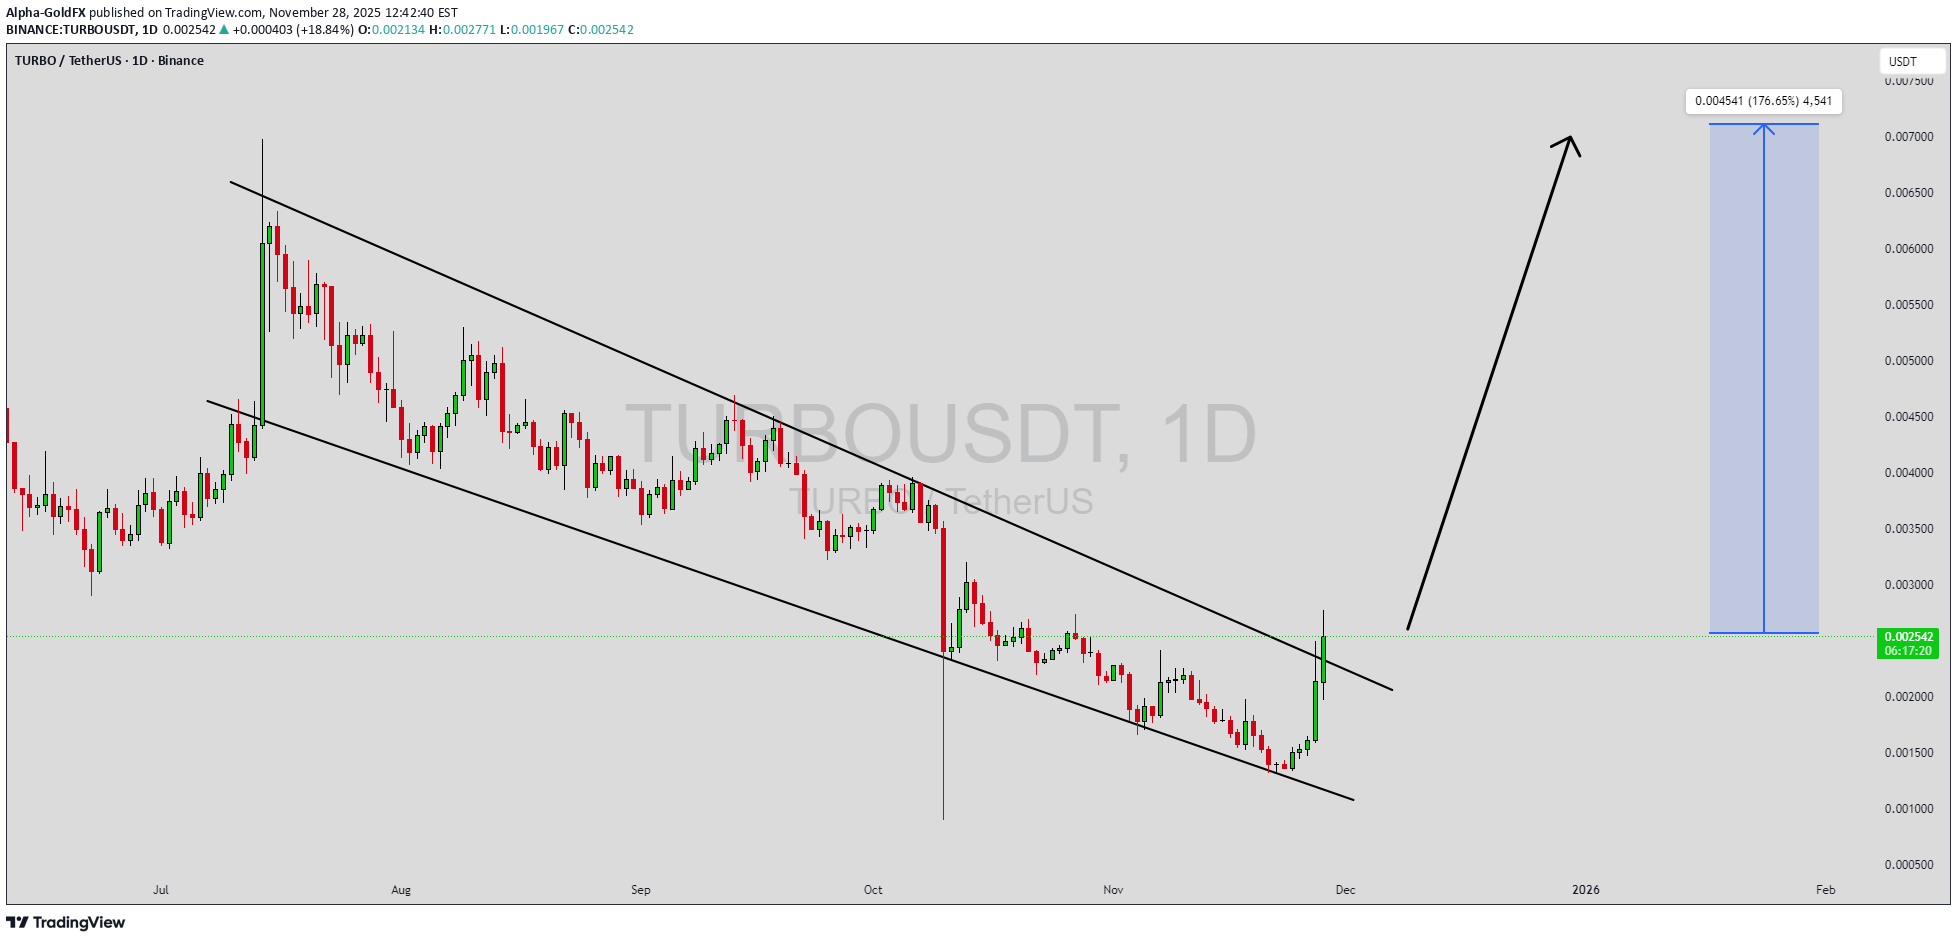
Alpha-GoldFX
سیگنال صعودی بزرگ: آیا TURBOUSDT آماده انفجار ۱۴۰ درصدی است؟
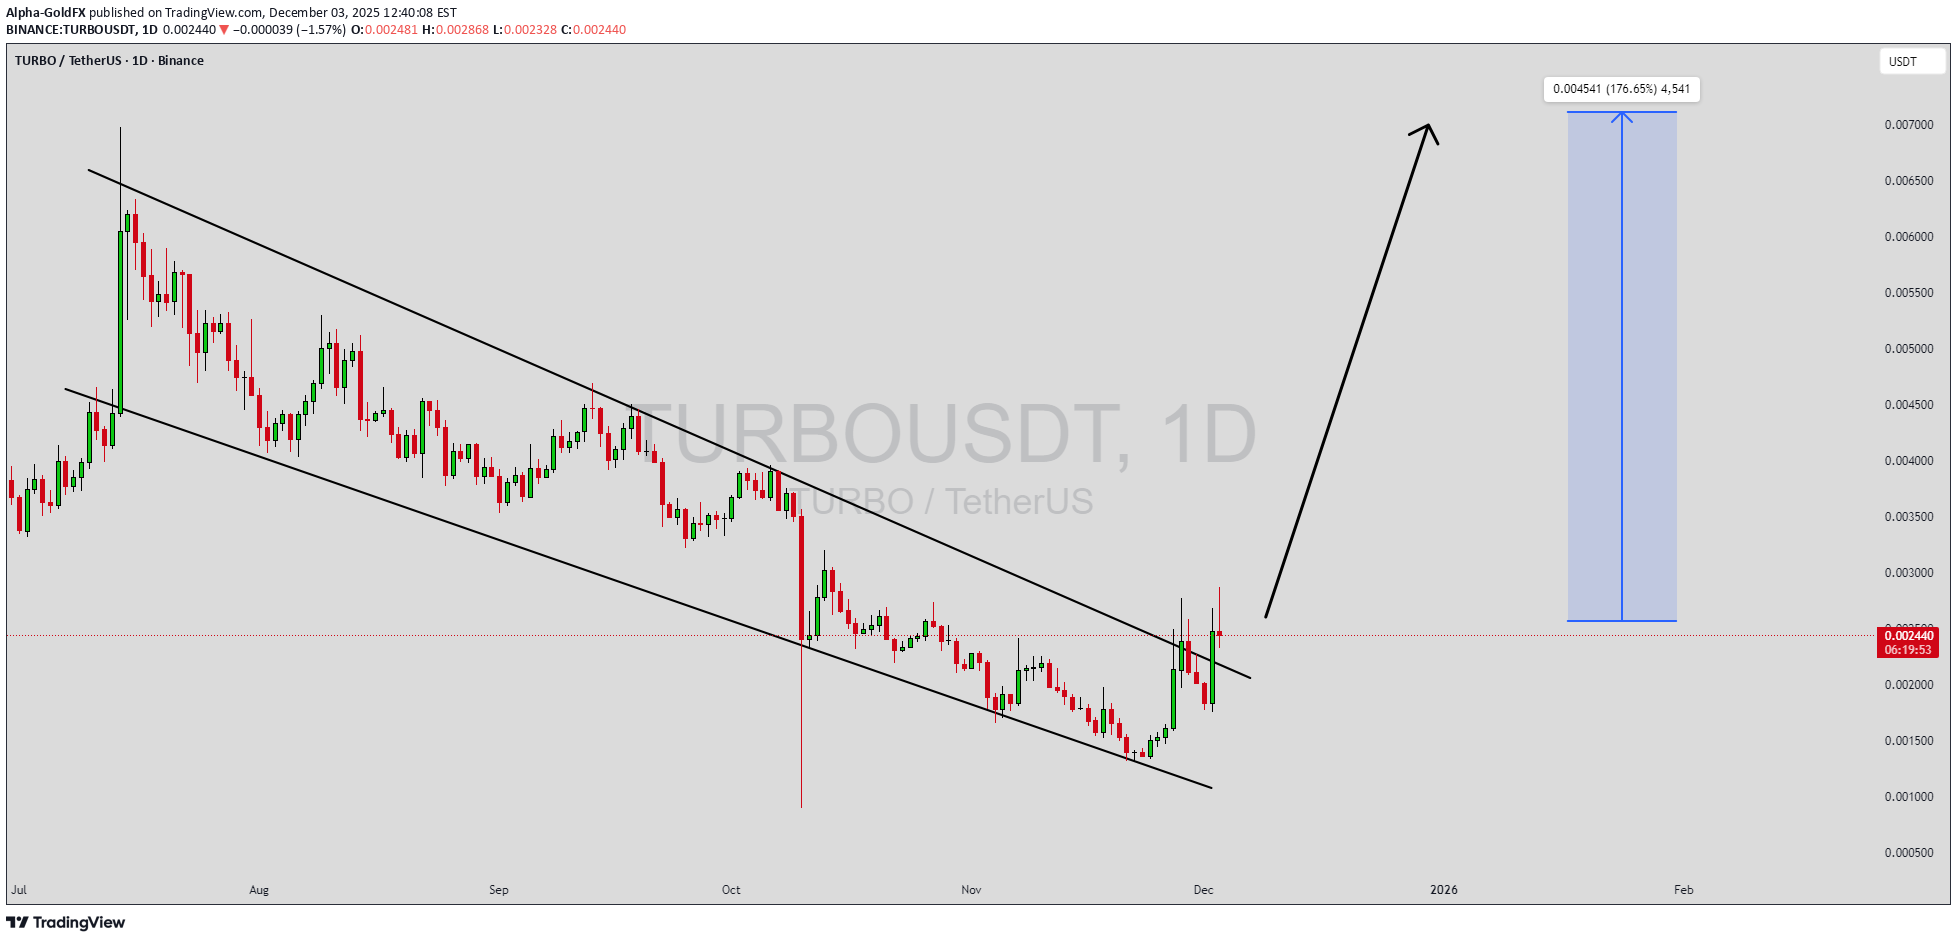
TURBOUSDT is forming a clear falling wedge pattern, a classic bullish reversal signal that often indicates an upcoming breakout. The price has been consolidating within a narrowing range, suggesting that selling pressure is weakening while buyers are beginning to regain control. With consistent volume confirming accumulation at lower levels, the setup hints at a potential bullish breakout soon. The projected move could lead to an impressive gain of around 140% to 150% once the price breaks above the wedge resistance. This falling wedge pattern is typically seen at the end of downtrends or corrective phases, and it represents a potential shift in market sentiment from bearish to bullish. Traders closely watching TURBOUSDT are noting the strengthening momentum as it nears a breakout zone. The good trading volume adds confidence to this pattern, showing that market participants are positioning early in anticipation of a reversal. Investors’ growing interest in TURBOUSDT reflects rising confidence in the project’s long-term fundamentals and current technical strength. If the breakout confirms with sustained volume, this could mark the start of a fresh bullish leg. Traders might find this a valuable setup for medium-term gains, especially as the wedge pattern completes and buying momentum accelerates. ✅ Show your support by hitting the like button and ✅ Leaving a comment below! (What is your opinion about this Coin?) Your feedback and engagement keep me inspired to share more insightful market analysis with you!

pullbacksignal
سیگنال خرید فوری TURBOUSDT: فرصت ترید با تحلیل تکنیکال قوی!
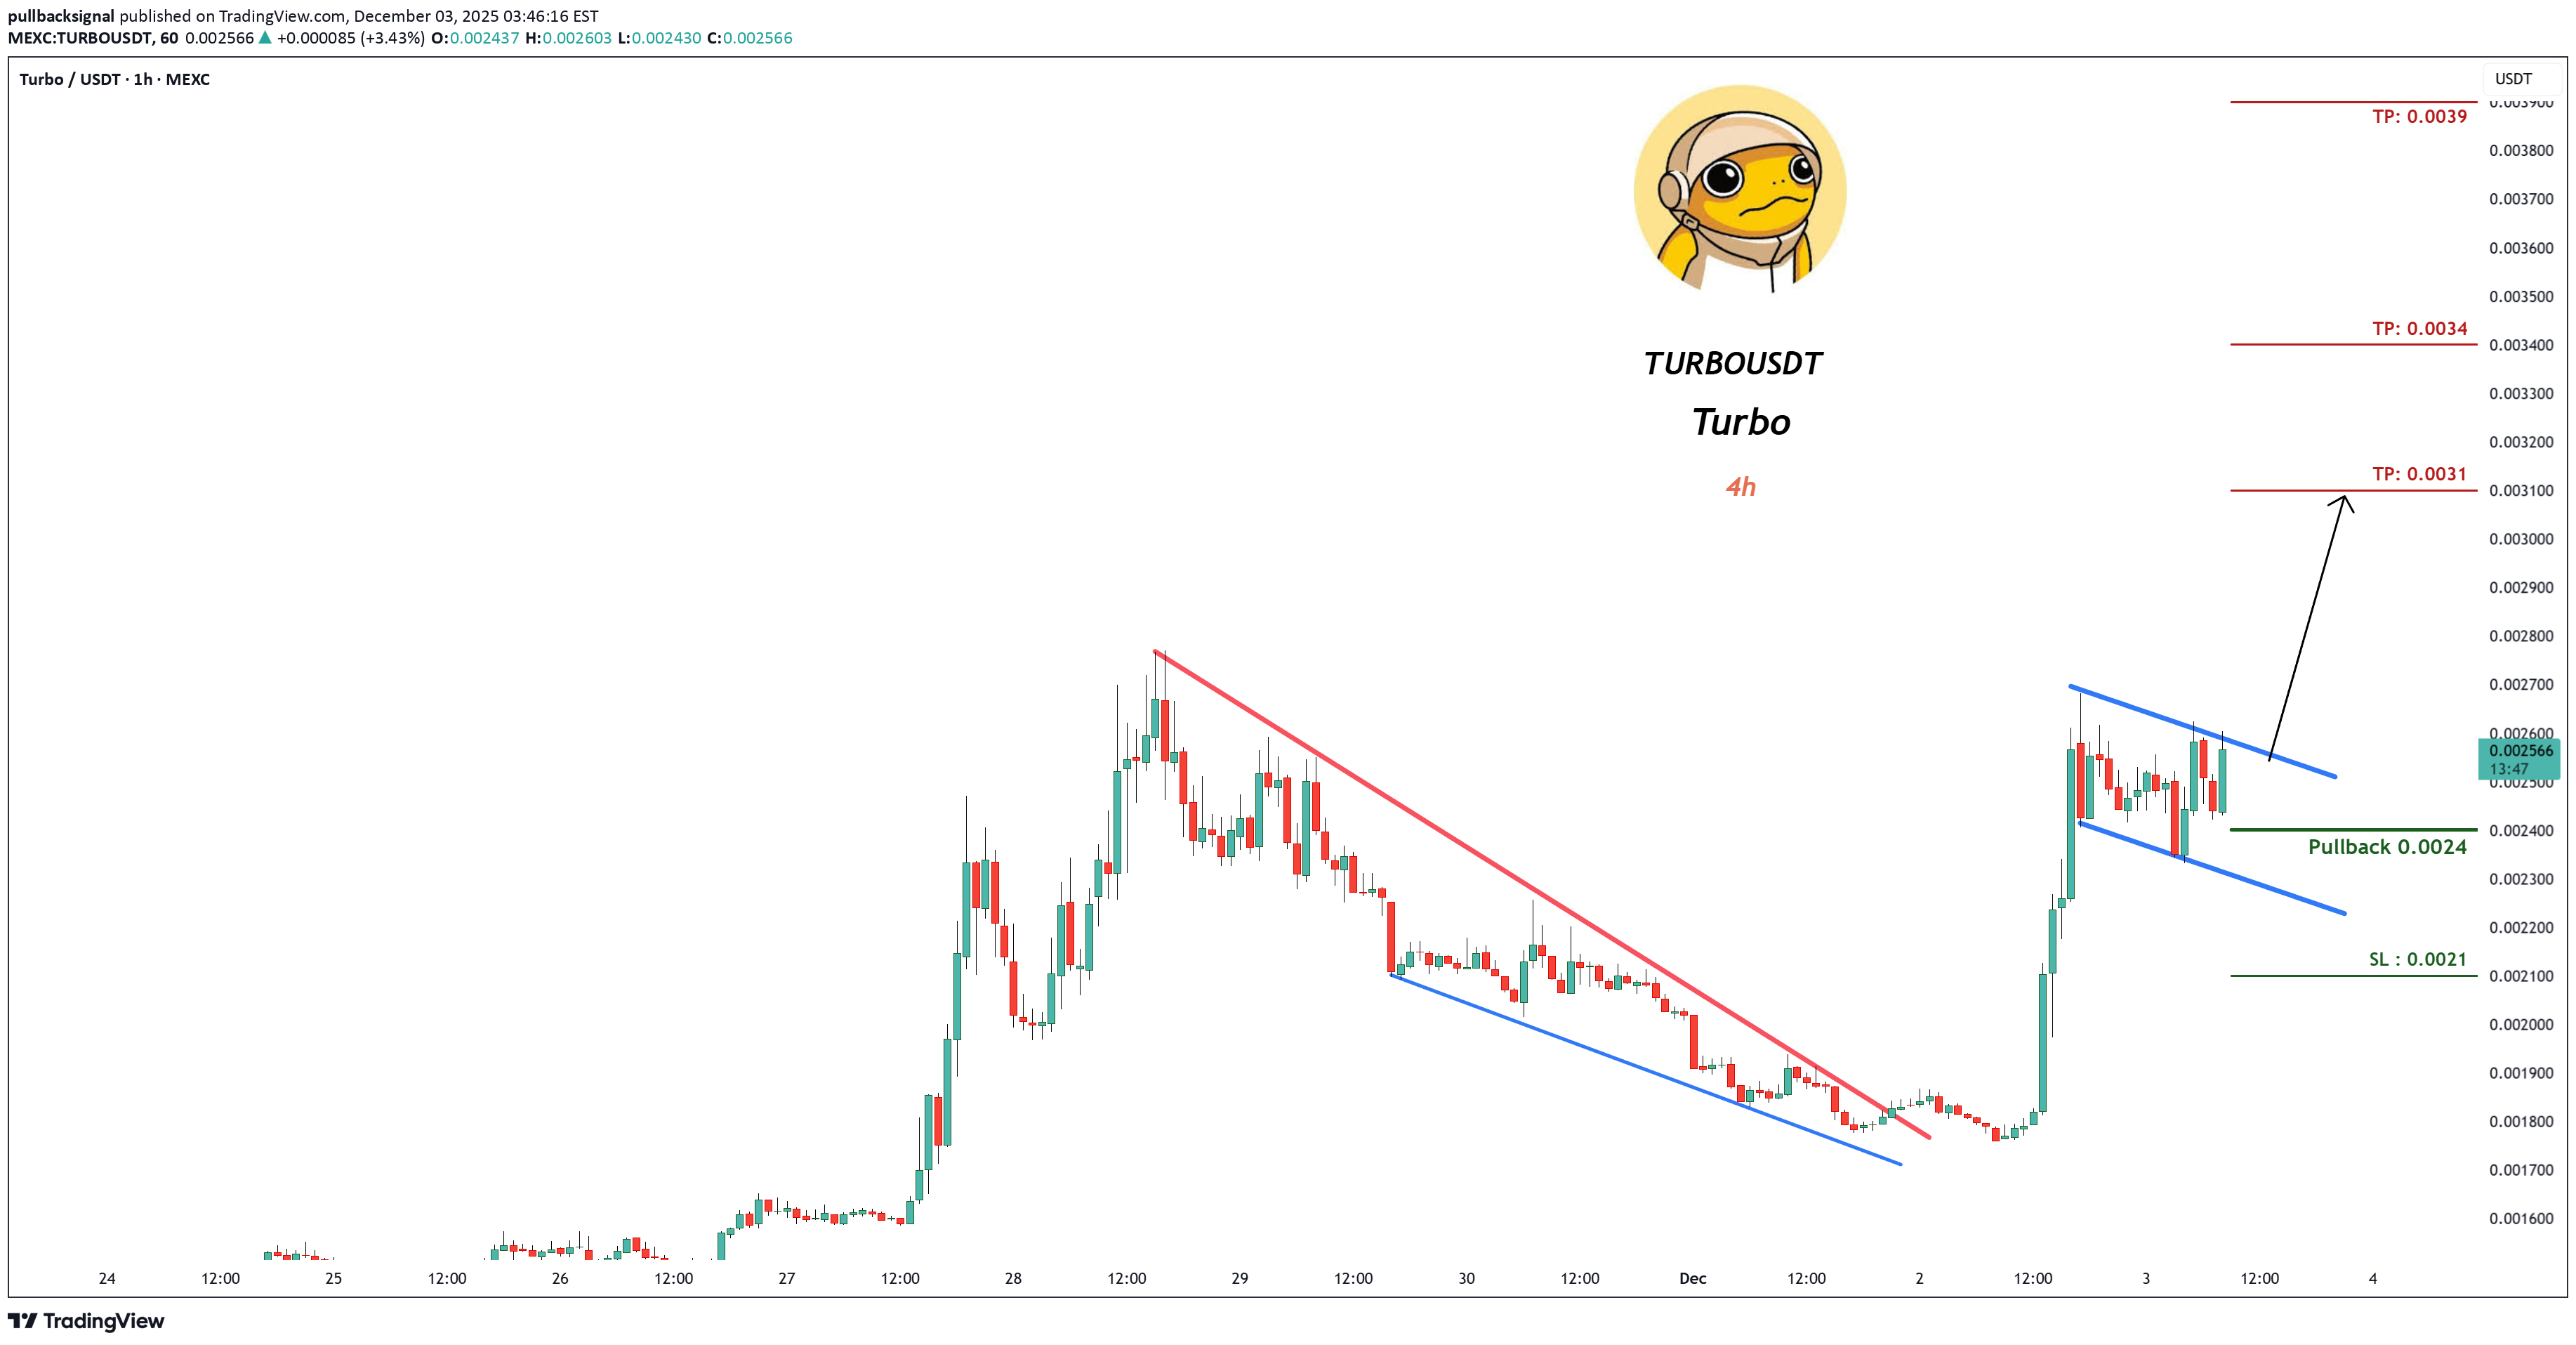
Trading Setup: A Trading Signal is seen in the TURBOUSDT Turbo (1h) (Futures) Traders can open their Buy Trades NOW ⬆️Buy now or Buy on 0.0024 ⭕️SL @ 0.0021 🔵TP1 @ 0.0031 🔵TP2 @ 0.0034 🔵TP3 @ 0.0039 What are these signals based on? Classical Technical Analysis Price Action Candlesticks Fibonacci RSI, Moving Average , Ichimoku , Bollinger Bands Risk Warning Trading Forex, CFDs, Crypto, Futures, and Stocks involve a risk of loss. Please consider carefully if such trading is appropriate for you. Past performance is not indicative of future results. If you liked our ideas, please support us with your likes 👍 and comments .
Javlonbek4000
تحلیل تکنیکال TURBOUSDT: سیگنال صعودی قدرتمند با پتانسیل سود ۴۰ درصدی!
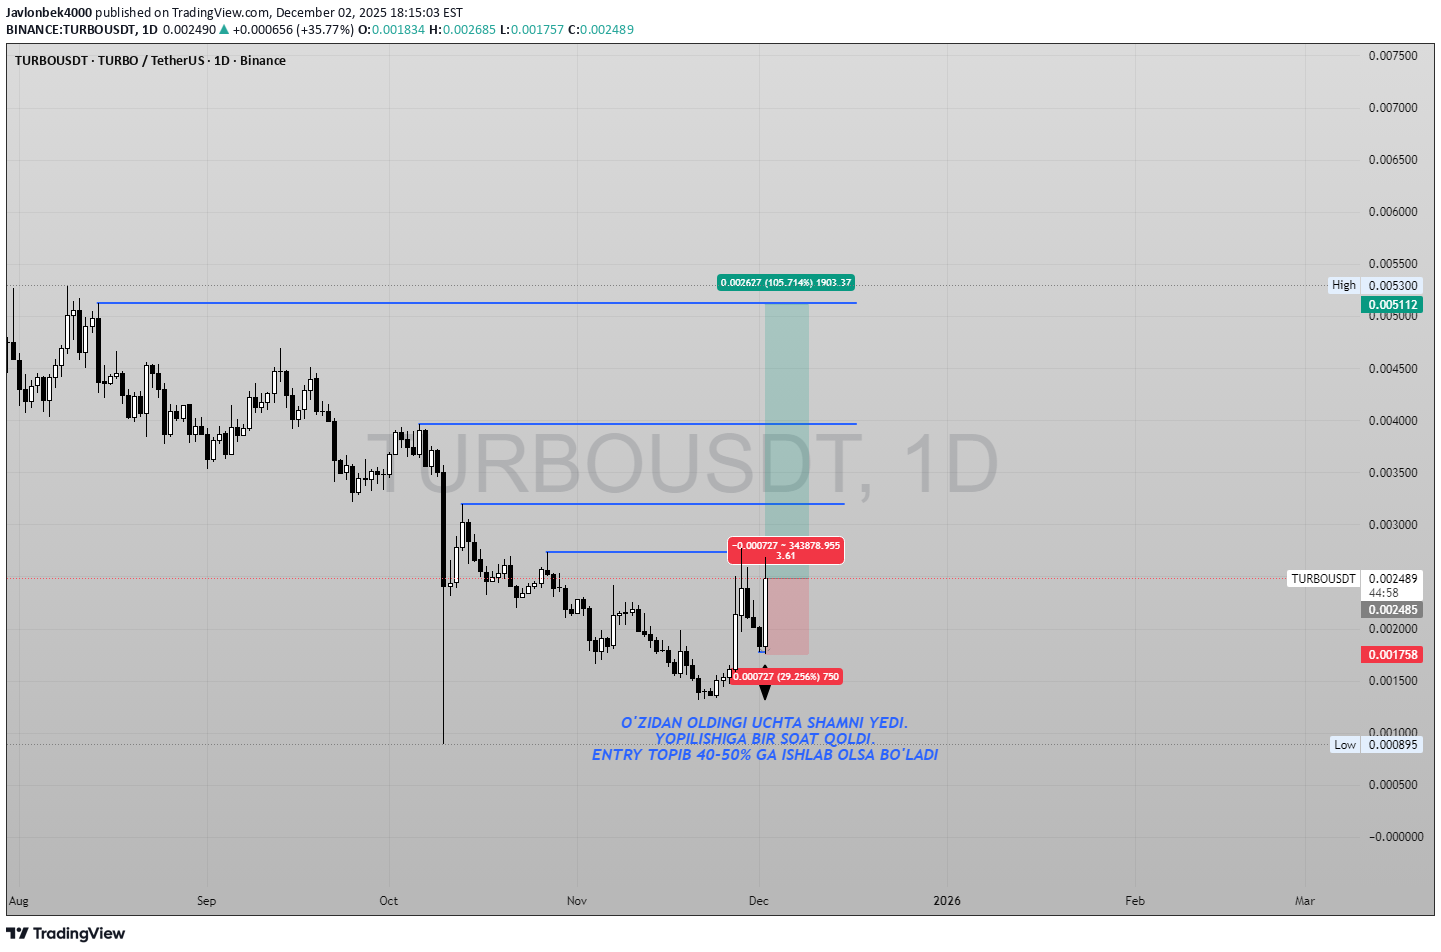
TURBOUSDT – Daily Bullish Engulfing Setup Today’s daily candle on TURBOUSDT is showing strong bullish momentum: it has engulfed the previous three candles, which indicates aggressive buying after a short-term pullback. There is about one hour left until the daily close; if the candle closes near the current levels or higher, this pattern will confirm a potential bullish reversal on the 1D timeframe. My plan for this setup: I am watching this zone for a long entry if the daily close confirms the bullish engulfing structure. The invalidaton for this idea is a clean break below today’s low – if price closes or trades convincingly below that level, the setup is no longer valid. On a successful entry, I see room for a 40–50% upside move toward the next daily resistance levels, where I will look to secure partial profits and trail the remaining position. As always, this is not financial advice – just my personal trading plan based on price action and risk management.
pullbacksignal
سیگنال فروش فوری: فرصت ترید در TURBOUSDT با اهداف و حد ضرر دقیق!

İşlem Kurulumu: TURBOUSDT Turbo (Vadeli İşlemler) (4s)'de bir İşlem Sinyali görülmektedir. İşlemciler ŞİMDİ Satış İşlemlerini açabilirler. ⬇️ Şimdi veya 0,002039'da satabilirsiniz. ⭕️SL @ 0,002274 🔵TP1 @ 0,001559 🔵TP2 @ 0,001356 🔵TP3 @ 0,001095 Bu sinyaller neye dayanmaktadır? Klasik Teknik Analiz Fiyat Hareketi Mum Grafikleri Fibonacci RSI, Hareketli Ortalama, Ichimoku, Bollinger Bantları Risk Uyarısı Forex, CFD, Kripto, Vadeli İşlemler ve Hisse Senetleri ticareti risk içerir. Kayıp riski. Lütfen bu tür bir yatırımın sizin için uygun olup olmadığını dikkatlice değerlendirin. Geçmiş performans, gelecekteki sonuçların göstergesi değildir. Fikirlerimizi beğendiyseniz, lütfen beğenileriniz 👍 ve yorumlarınızla bizi destekleyin.
pullbacksignal
سیگنال فروش داغ TURBOUSDT: آماده کسب سود در بازار فیوچرز!
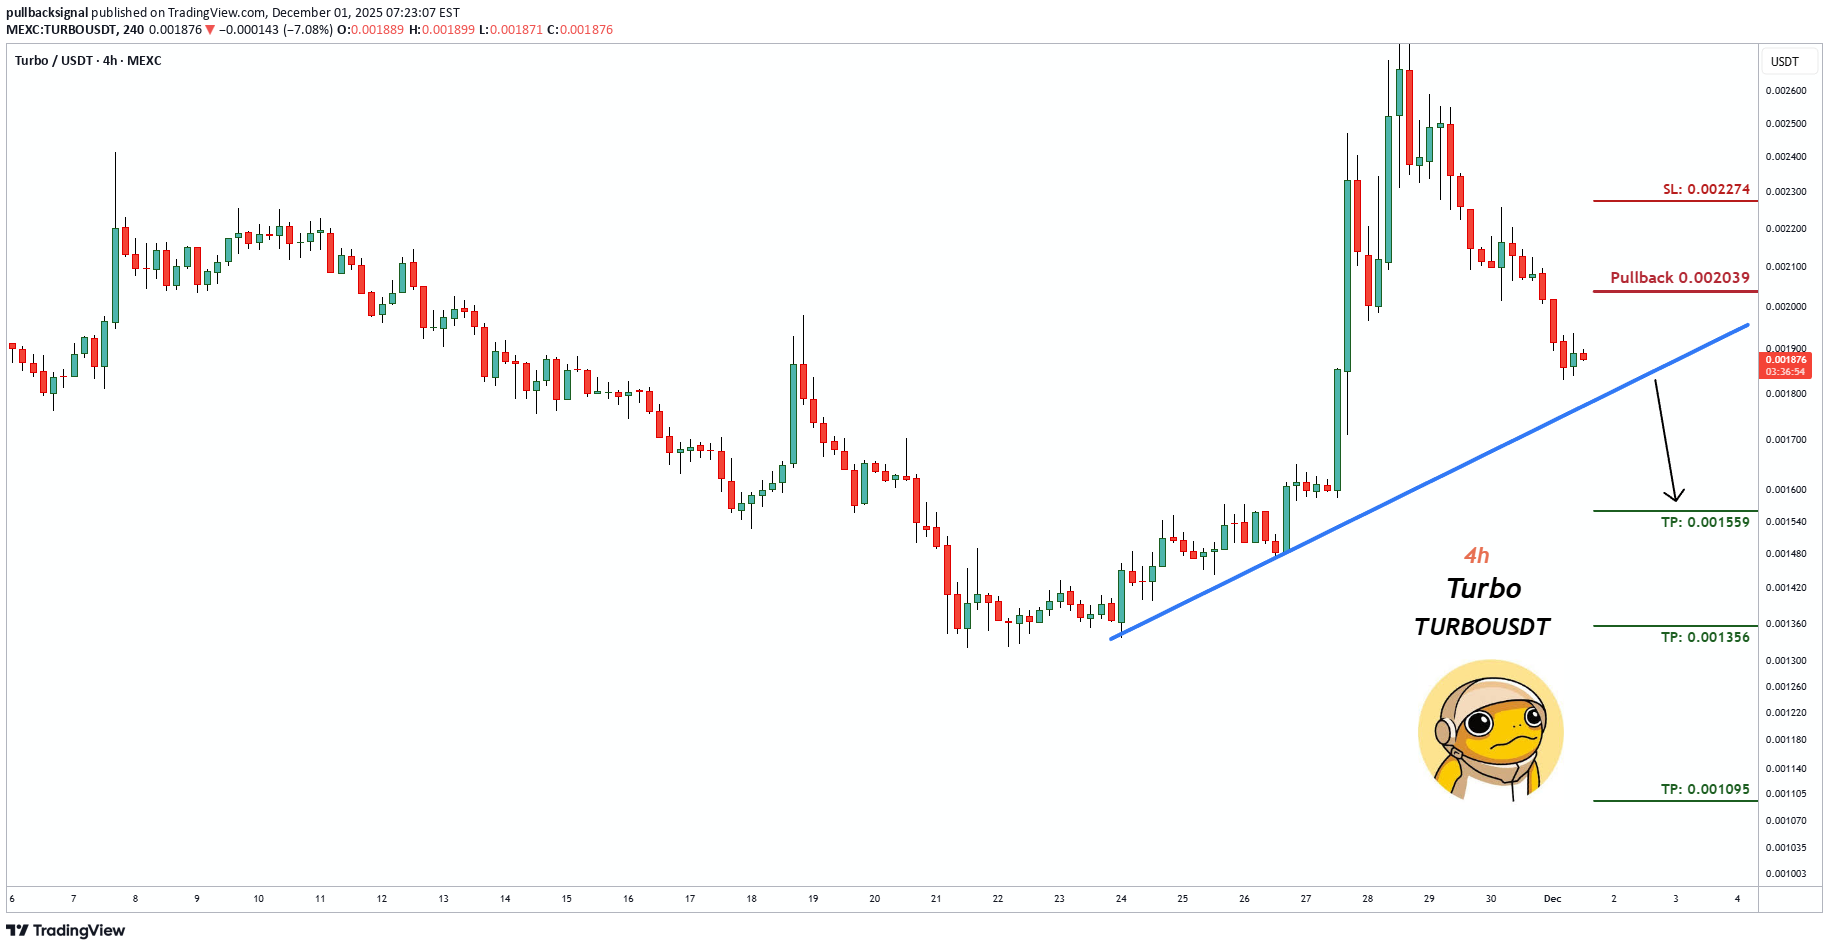
Trading Setup: A Trading Signal is seen in the TURBOUSDT Turbo (Futures) (4h) Traders can open their Sell Trades NOW ⬇️ Sell now or sell on 0.002039 ⭕️SL @ 0.002274 🔵TP1 @ 0.001559 🔵TP2 @ 0.001356 🔵TP3 @ 0.001095 What are these signals based on? Classical Technical Analysis Price Action Candlesticks Fibonacci RSI, Moving Average , Ichimoku , Bollinger Bands Risk Warning Trading Forex, CFDs, Crypto, Futures, and Stocks involve a risk of loss. Please consider carefully if such trading is appropriate for you. Past performance is not indicative of future results. If you liked our ideas, please support us with your likes 👍 and comments .

Bithereum_io
تحلیل شگفتانگیز TURBOUSDT: آیا آماده پرش بزرگ است؟ (با اهداف صعودی انفجاری!)
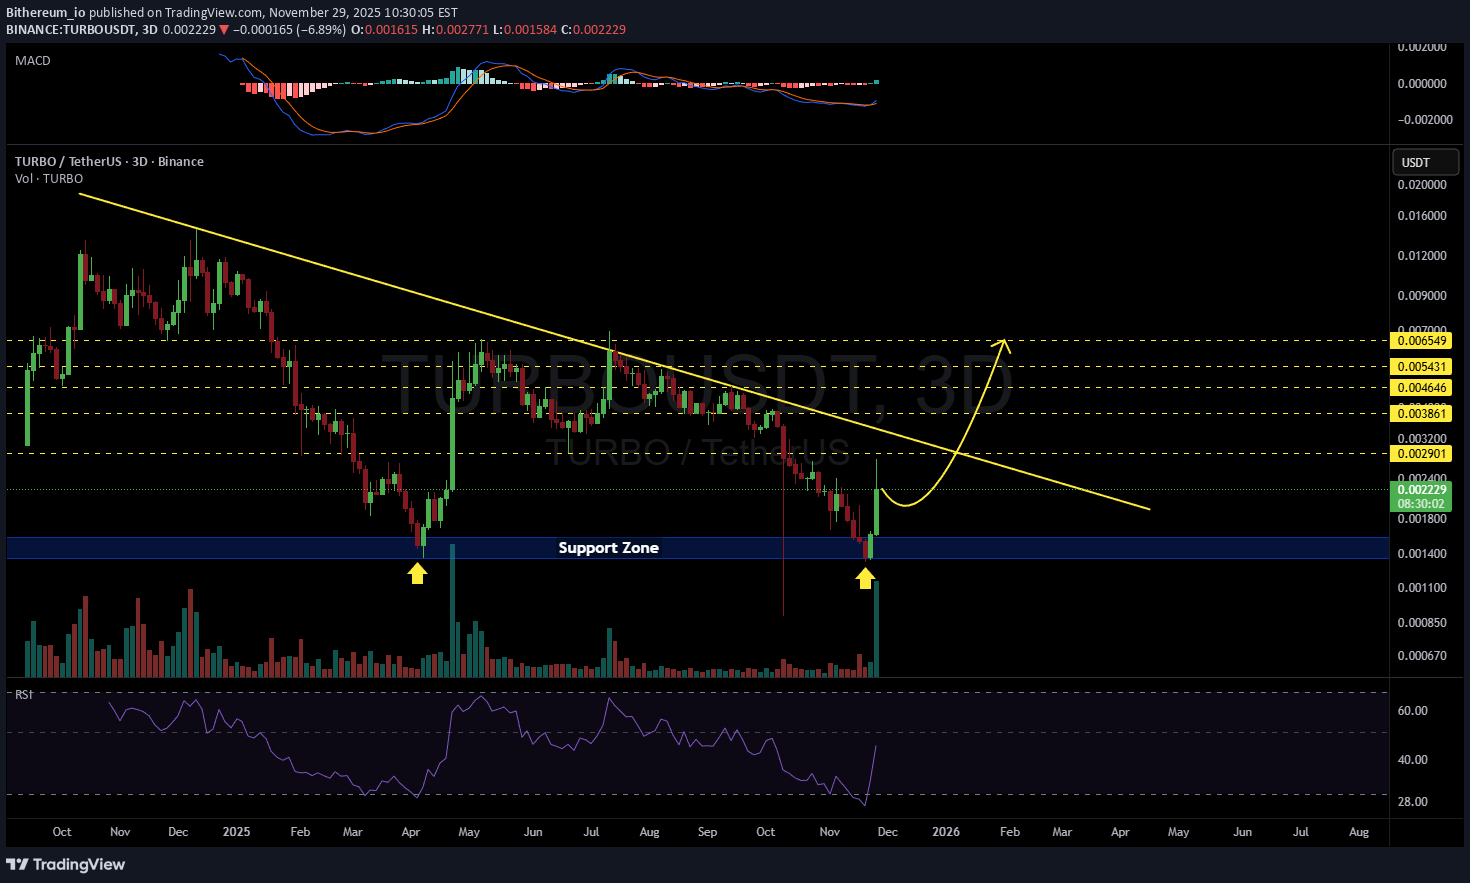
#TURBO has bounced off the support zone perfectly with significant volume on the 3-day timeframe. RSI is showing potential for upward movement. In case of a breakout above the descending resistance, the potential upside targets are: 🎯 $0.002901 🎯 $0.003861 🎯 $0.004646 🎯 $0.005431 🎯 $0.006549 ⚠️ Always remember to use a tight stop-loss and maintain proper risk management.
Alpha-GoldFX
سیگنال انفجاری TURBOUSDT: گوه نزولی نویدبخش افزایش 150 درصدی!
TURBOUSDT is forming a clear falling wedge pattern, a classic bullish reversal signal that often indicates an upcoming breakout. The price has been consolidating within a narrowing range, suggesting that selling pressure is weakening while buyers are beginning to regain control. With consistent volume confirming accumulation at lower levels, the setup hints at a potential bullish breakout soon. The projected move could lead to an impressive gain of around 140% to 150% once the price breaks above the wedge resistance. This falling wedge pattern is typically seen at the end of downtrends or corrective phases, and it represents a potential shift in market sentiment from bearish to bullish. Traders closely watching TURBOUSDT are noting the strengthening momentum as it nears a breakout zone. The good trading volume adds confidence to this pattern, showing that market participants are positioning early in anticipation of a reversal. Investors’ growing interest in TURBOUSDT reflects rising confidence in the project’s long-term fundamentals and current technical strength. If the breakout confirms with sustained volume, this could mark the start of a fresh bullish leg. Traders might find this a valuable setup for medium-term gains, especially as the wedge pattern completes and buying momentum accelerates. ✅ Show your support by hitting the like button and ✅ Leaving a comment below! (What is your opinion about this Coin?) Your feedback and engagement keep me inspired to share more insightful market analysis with you!
Disclaimer
Any content and materials included in Sahmeto's website and official communication channels are a compilation of personal opinions and analyses and are not binding. They do not constitute any recommendation for buying, selling, entering or exiting the stock market and cryptocurrency market. Also, all news and analyses included in the website and channels are merely republished information from official and unofficial domestic and foreign sources, and it is obvious that users of the said content are responsible for following up and ensuring the authenticity and accuracy of the materials. Therefore, while disclaiming responsibility, it is declared that the responsibility for any decision-making, action, and potential profit and loss in the capital market and cryptocurrency market lies with the trader.