
TIA
Celestia
| تریدر | نوع سیگنال | حد سود/ضرر | زمان انتشار | مشاهده پیام |
|---|---|---|---|---|
 Crypto4lightRank: 647 | خرید | حد سود: تعیین نشده حد ضرر: تعیین نشده | 7 hour ago |
Price Chart of Celestia
سود 3 Months :
خلاصه سیگنالهای Celestia
سیگنالهای Celestia
Filter
Sort messages by
Trader Type
Time Frame
Crypto4light
تحلیل تکنیکال تیایاییواسدیتی: سقوط نهایی تا کانال و ناحیه کلیدی ۲۷!
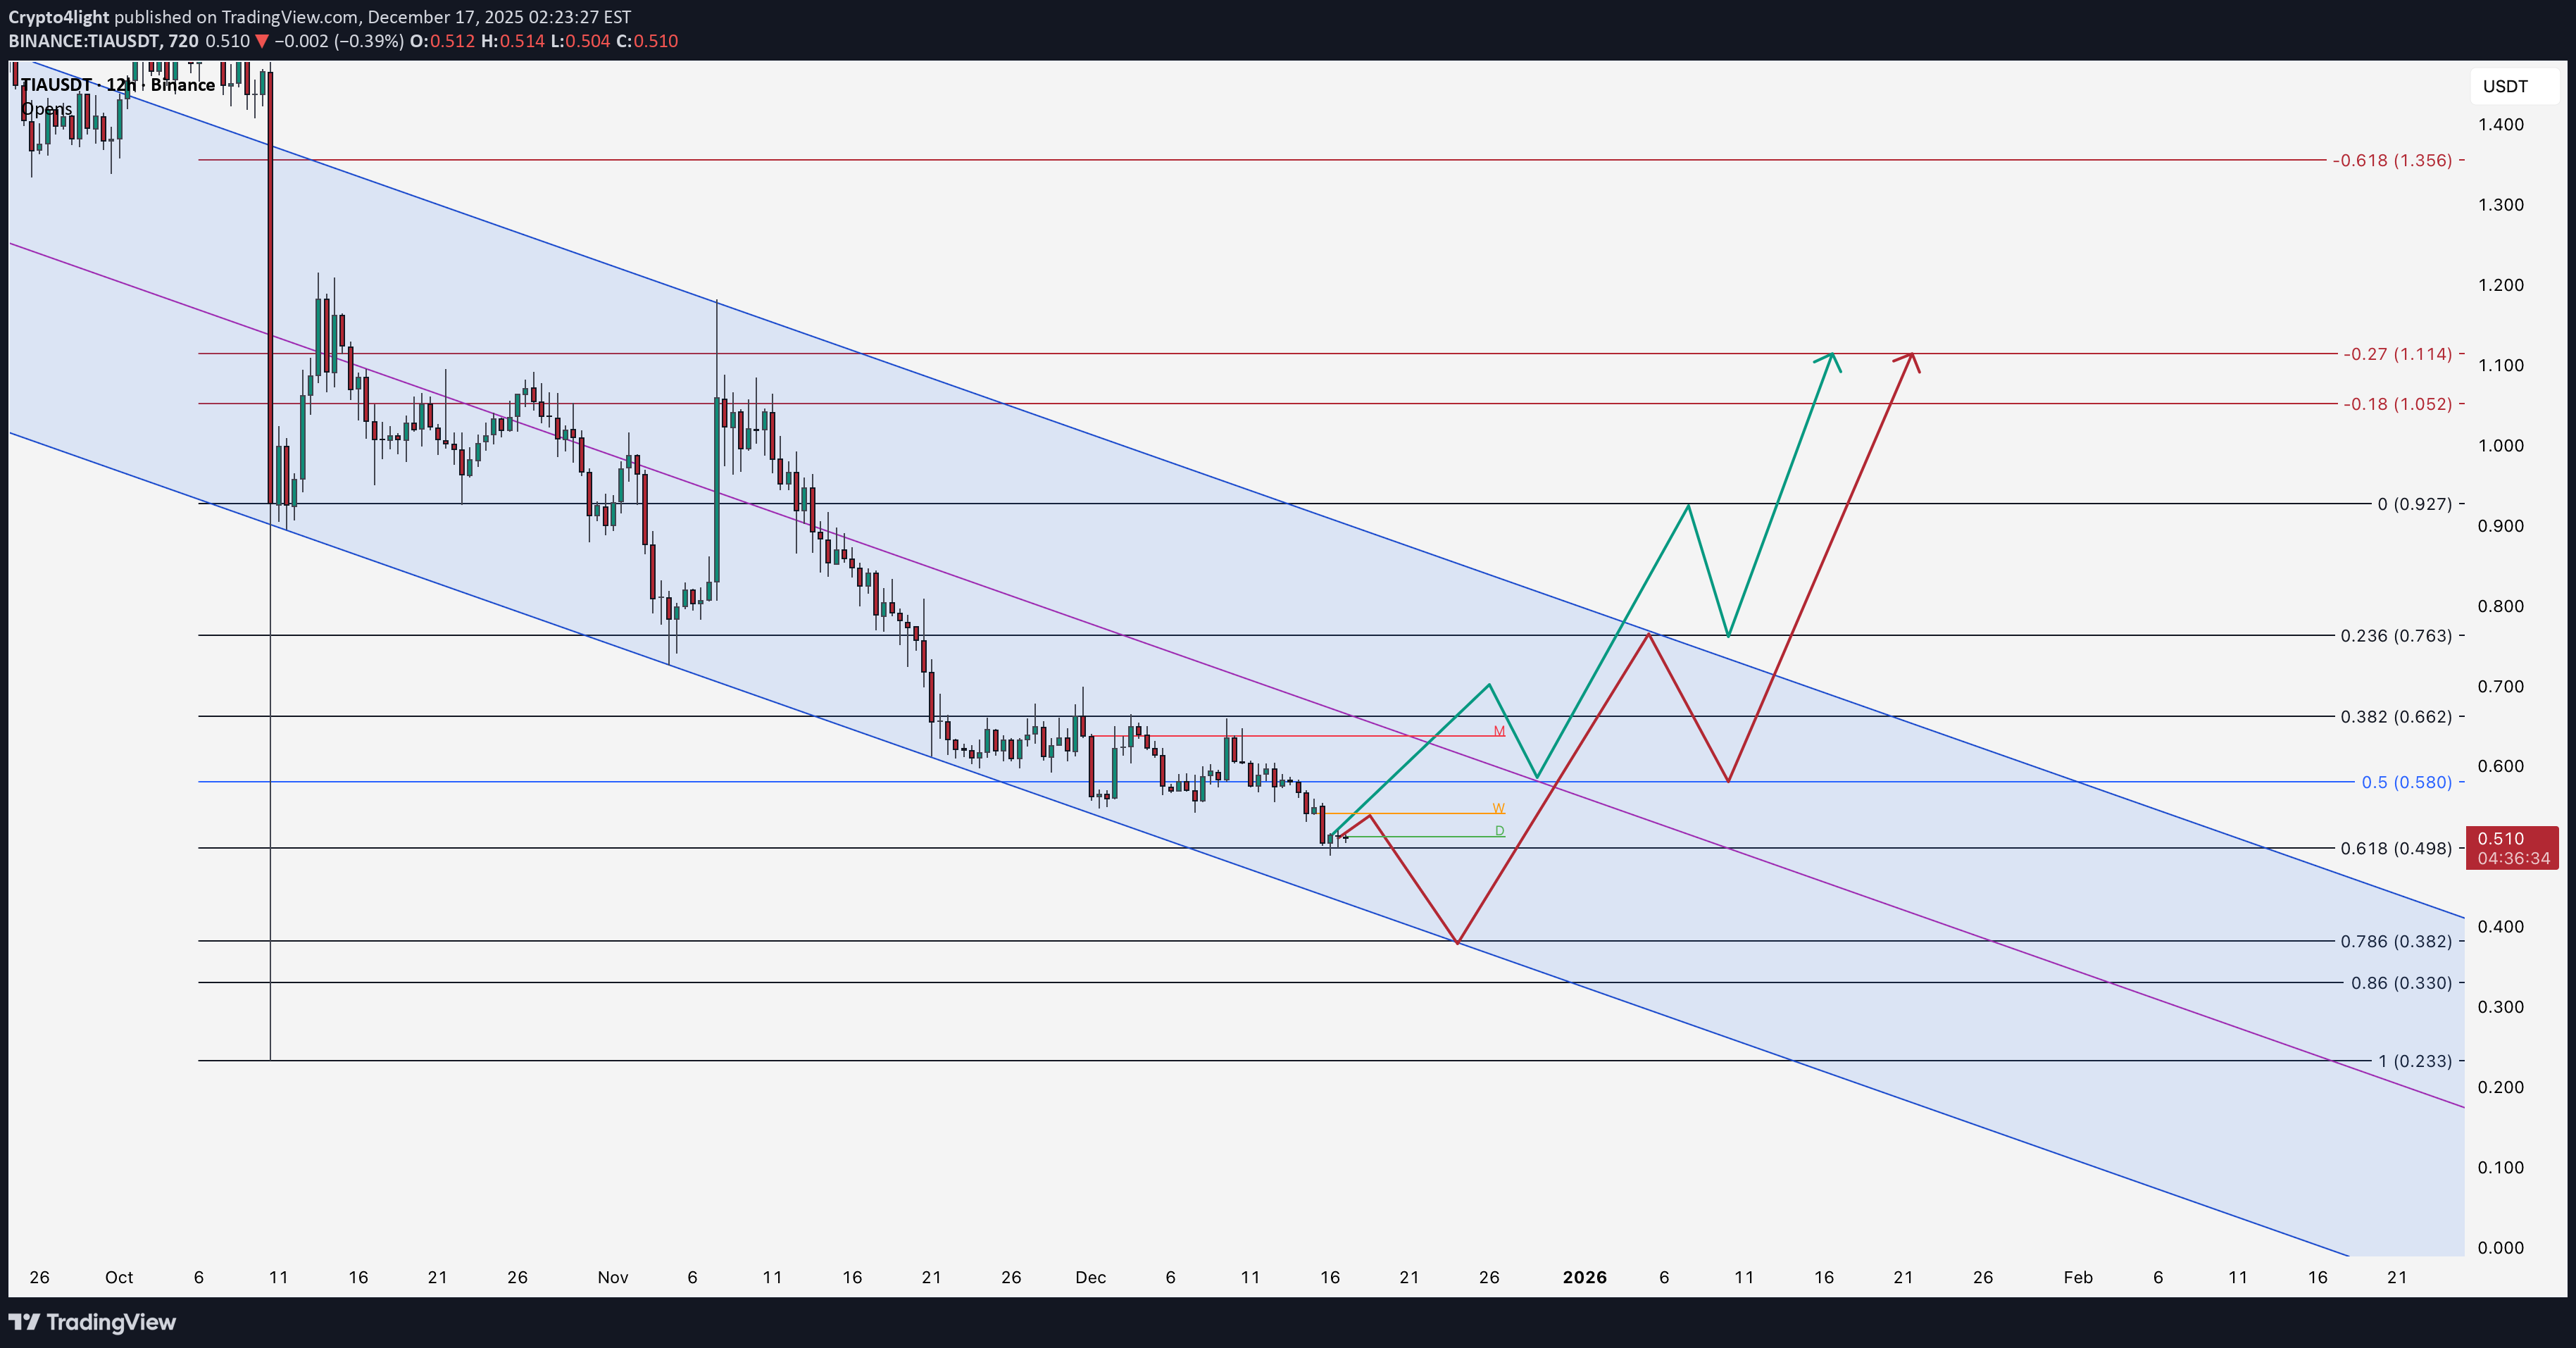
Simple idea with fib (wick Daily from 10 october) TIAUSDT We already at 0.61 fib but based on channel and Japan decision about rates in next few days we can see final drop to 3rd touch of channel around 23-26 December! After that road will be to equilibrium of channel and 27 zone of fib where more than okay withdraw initial deposit or fix local trade

WaveRiders2

Bithereum_io
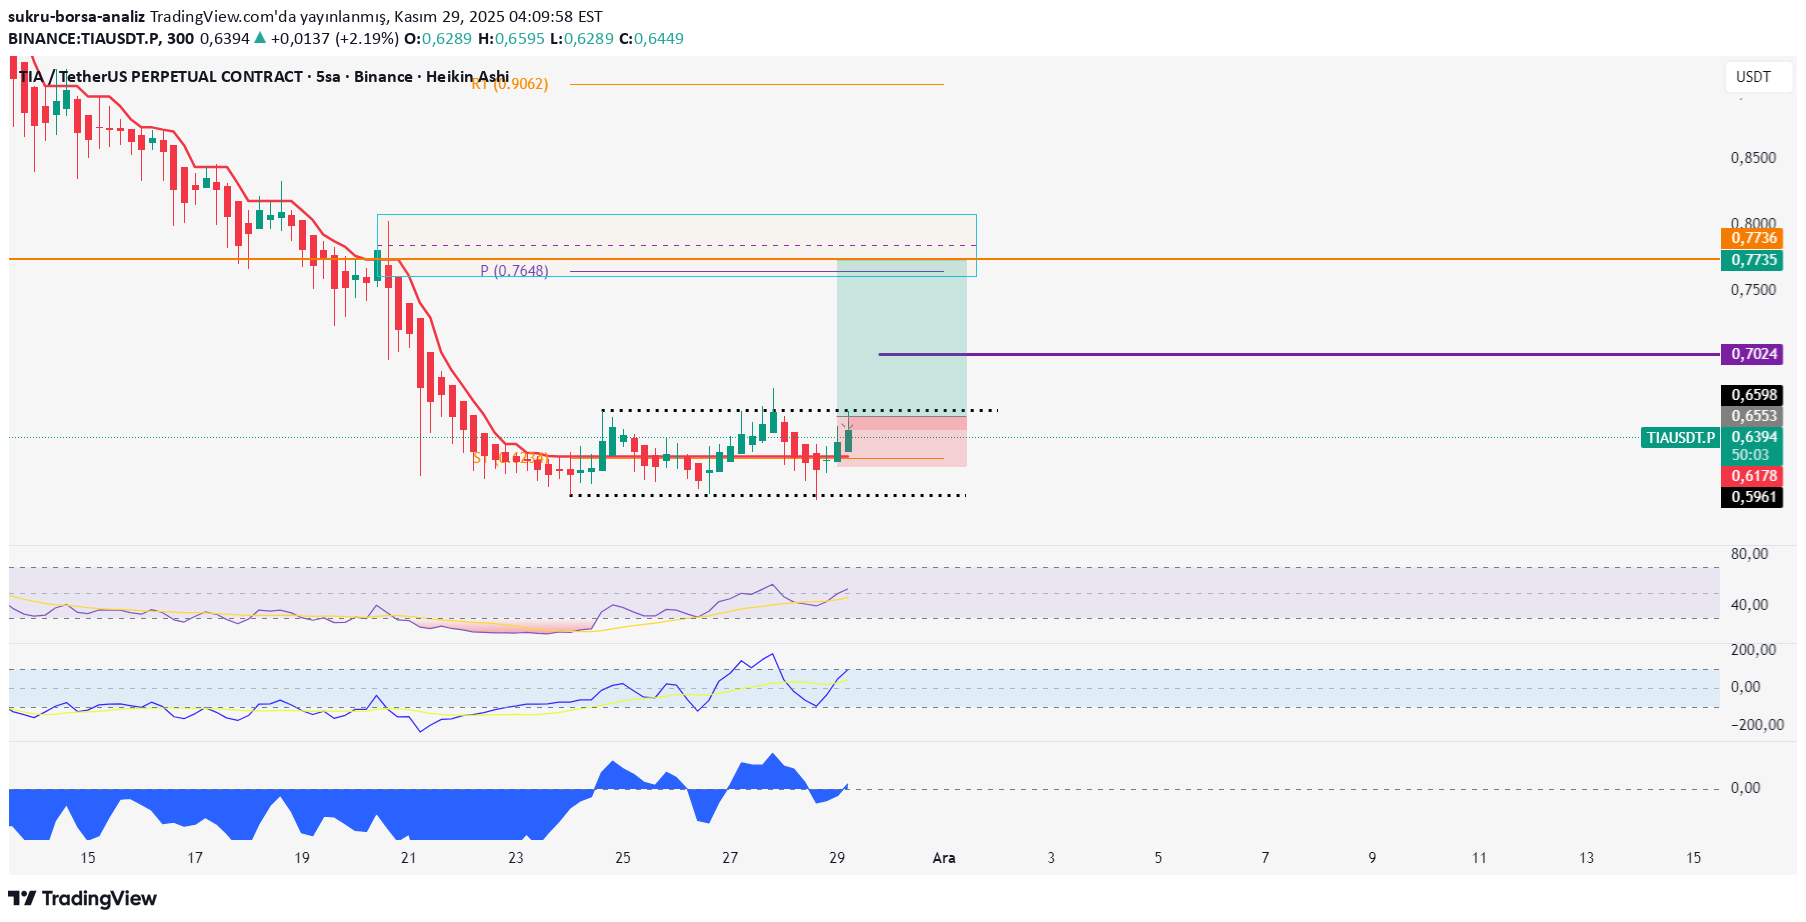
آیا قیمت تیا (TIA) به ۲ دلار میرسد؟ تحلیل تکنیکال و اهداف قیمتی هیجانانگیز
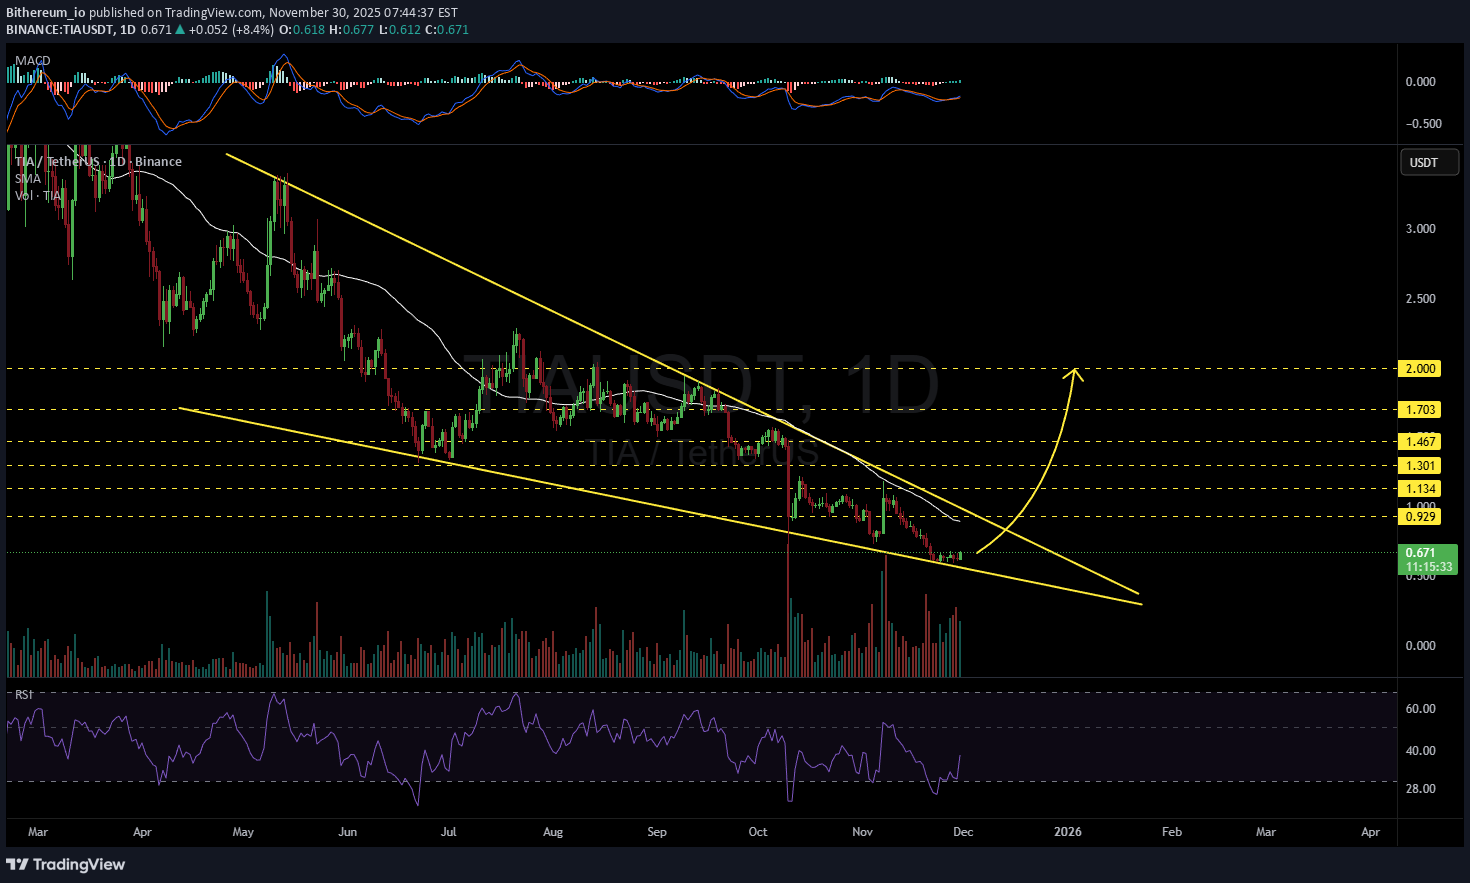
#TIA may be aiming for the $2 level. #TIA is moving inside a falling wedge pattern on the daily chart and has bounced off the wedge support. In case of a breakout above the wedge resistance and the daily SMA50, the targets are: 🎯 $0.929 🎯 $1.134 🎯 $1.301 🎯 $1.467 🎯 $1.703 🎯 $2.000 ⚠️ Always remember to use a tight stop-loss and maintain proper risk management.

Cryptojobs
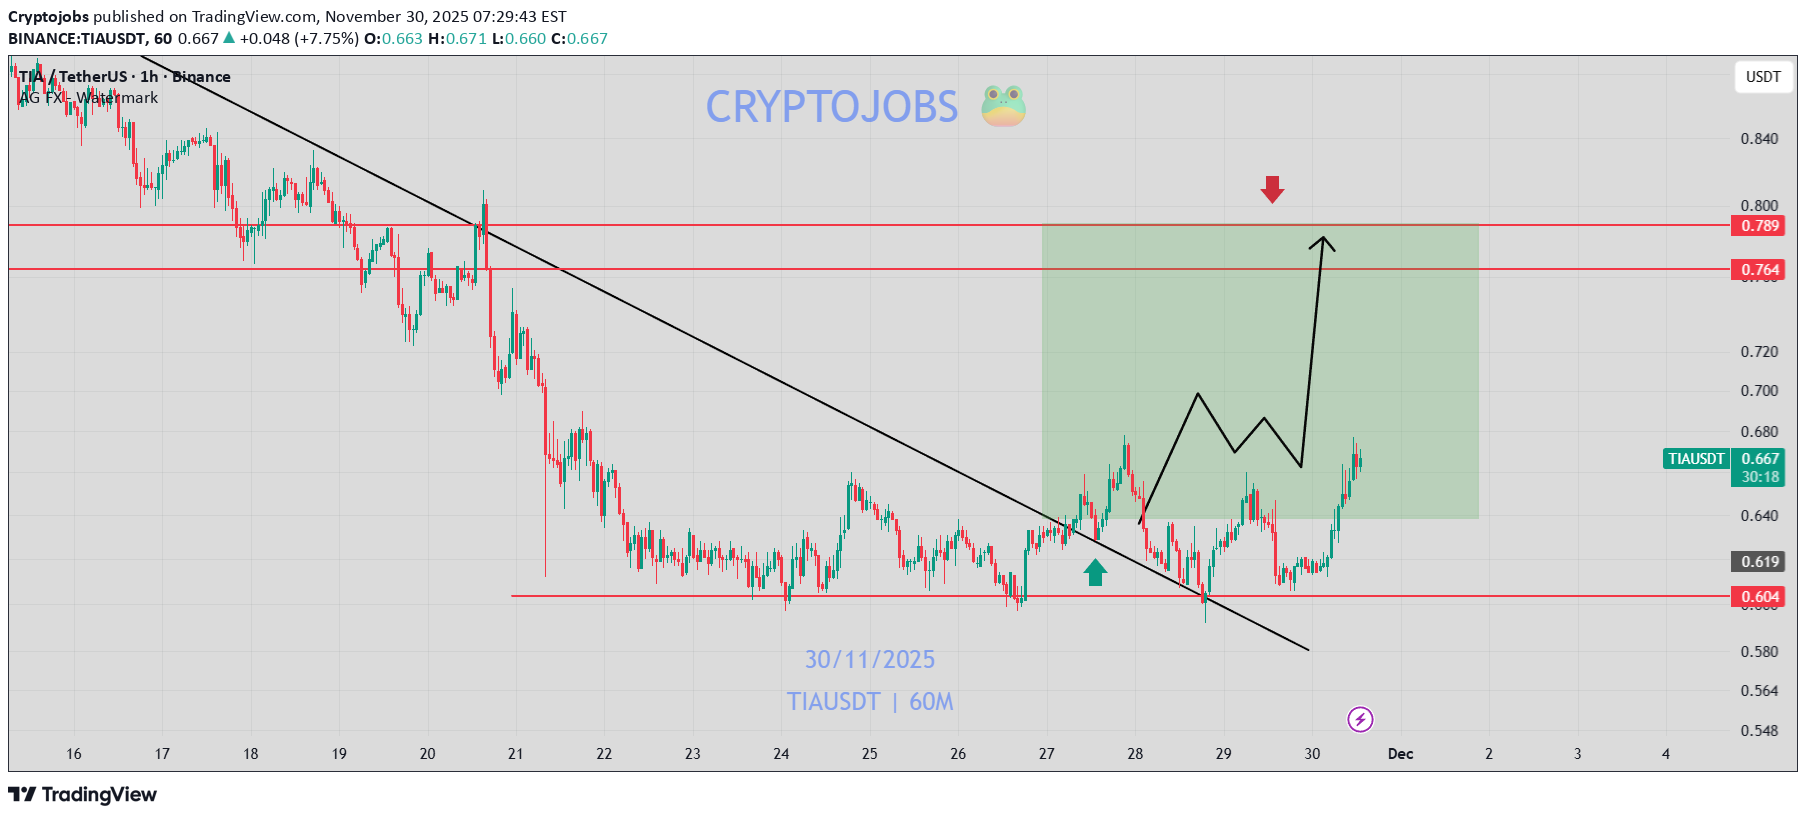

تحلیل تکنیکال امروز: رازهای نمودار وایكاف برای کسب سود سریع!
Today, tomorrow, in a short time and in hours, Wyckoff offers a very good savings and target.

آیا ارز دیجیتال TIA آماده جهش دوم است؟ تحلیل موج جدید سکههای هوش مصنوعی
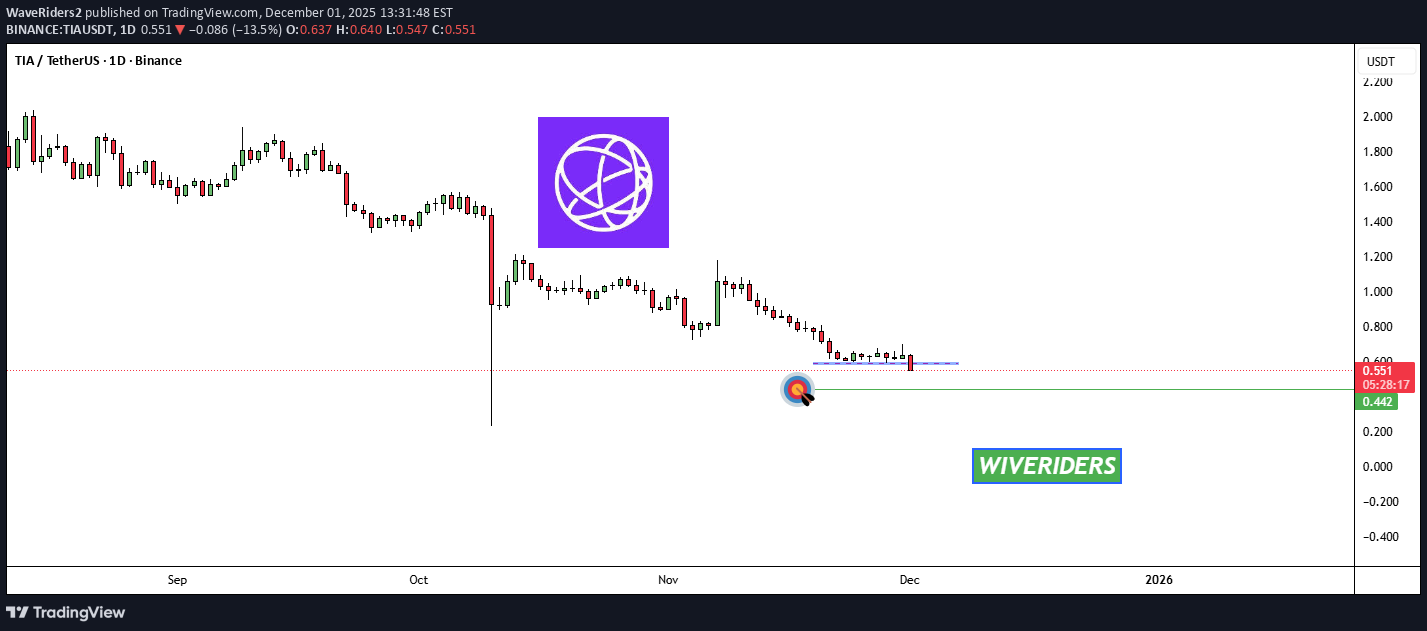
Who could forget that crazy rally during the AI coin frenzy in late'23. There are some good projects that are sold beyond belief and I think TIA looks like it is making a nice base here, we appear to have reached seller exhaustion. Easy punt with a small amount, around $1000 for me, I don't really need a stop on this trade, I'm happy to be wrong in the event BTC continues down further.

ozhanatak
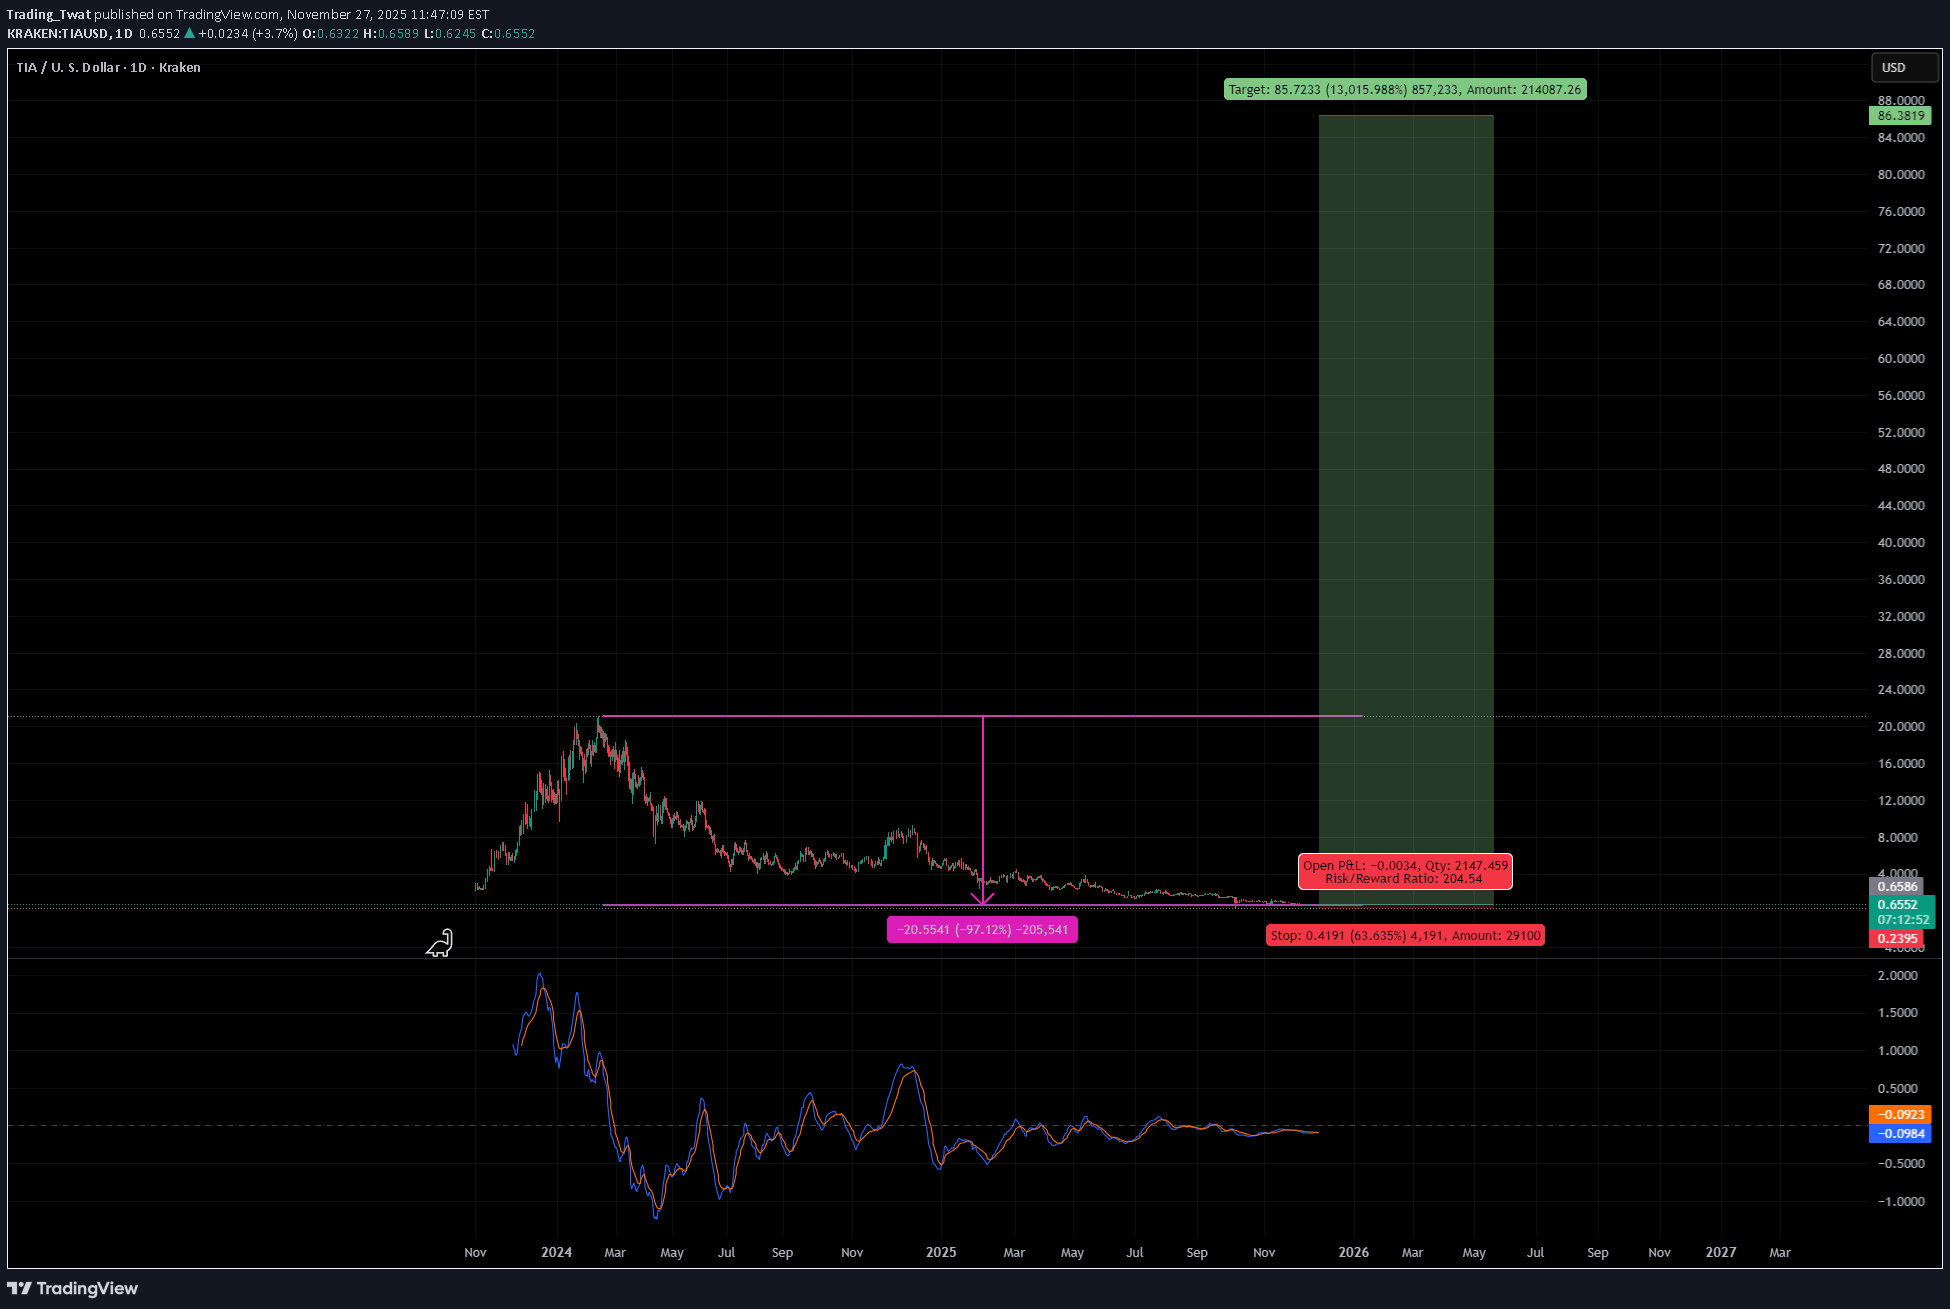
پیشبینی سقوط آزاد TIA/USDT: آیا قیمت به ۱.۵ دلار میرسد؟ (هشدار سرمایهگذاری)
Just as it fell rapidly from 20 dollars to these levels, I expect it to move towards at least 1.5 dollars in a short time in the volume breakdown. This is for testing purposes only, do not invest by relying on the comments and feelings here. Because both those who know and those who don't know are screwed :)
Crypto4light
اهداف واقعی تیا (TIA) برای ۲۰۲۶: از کف تا سقف ۱۲ دلاری!
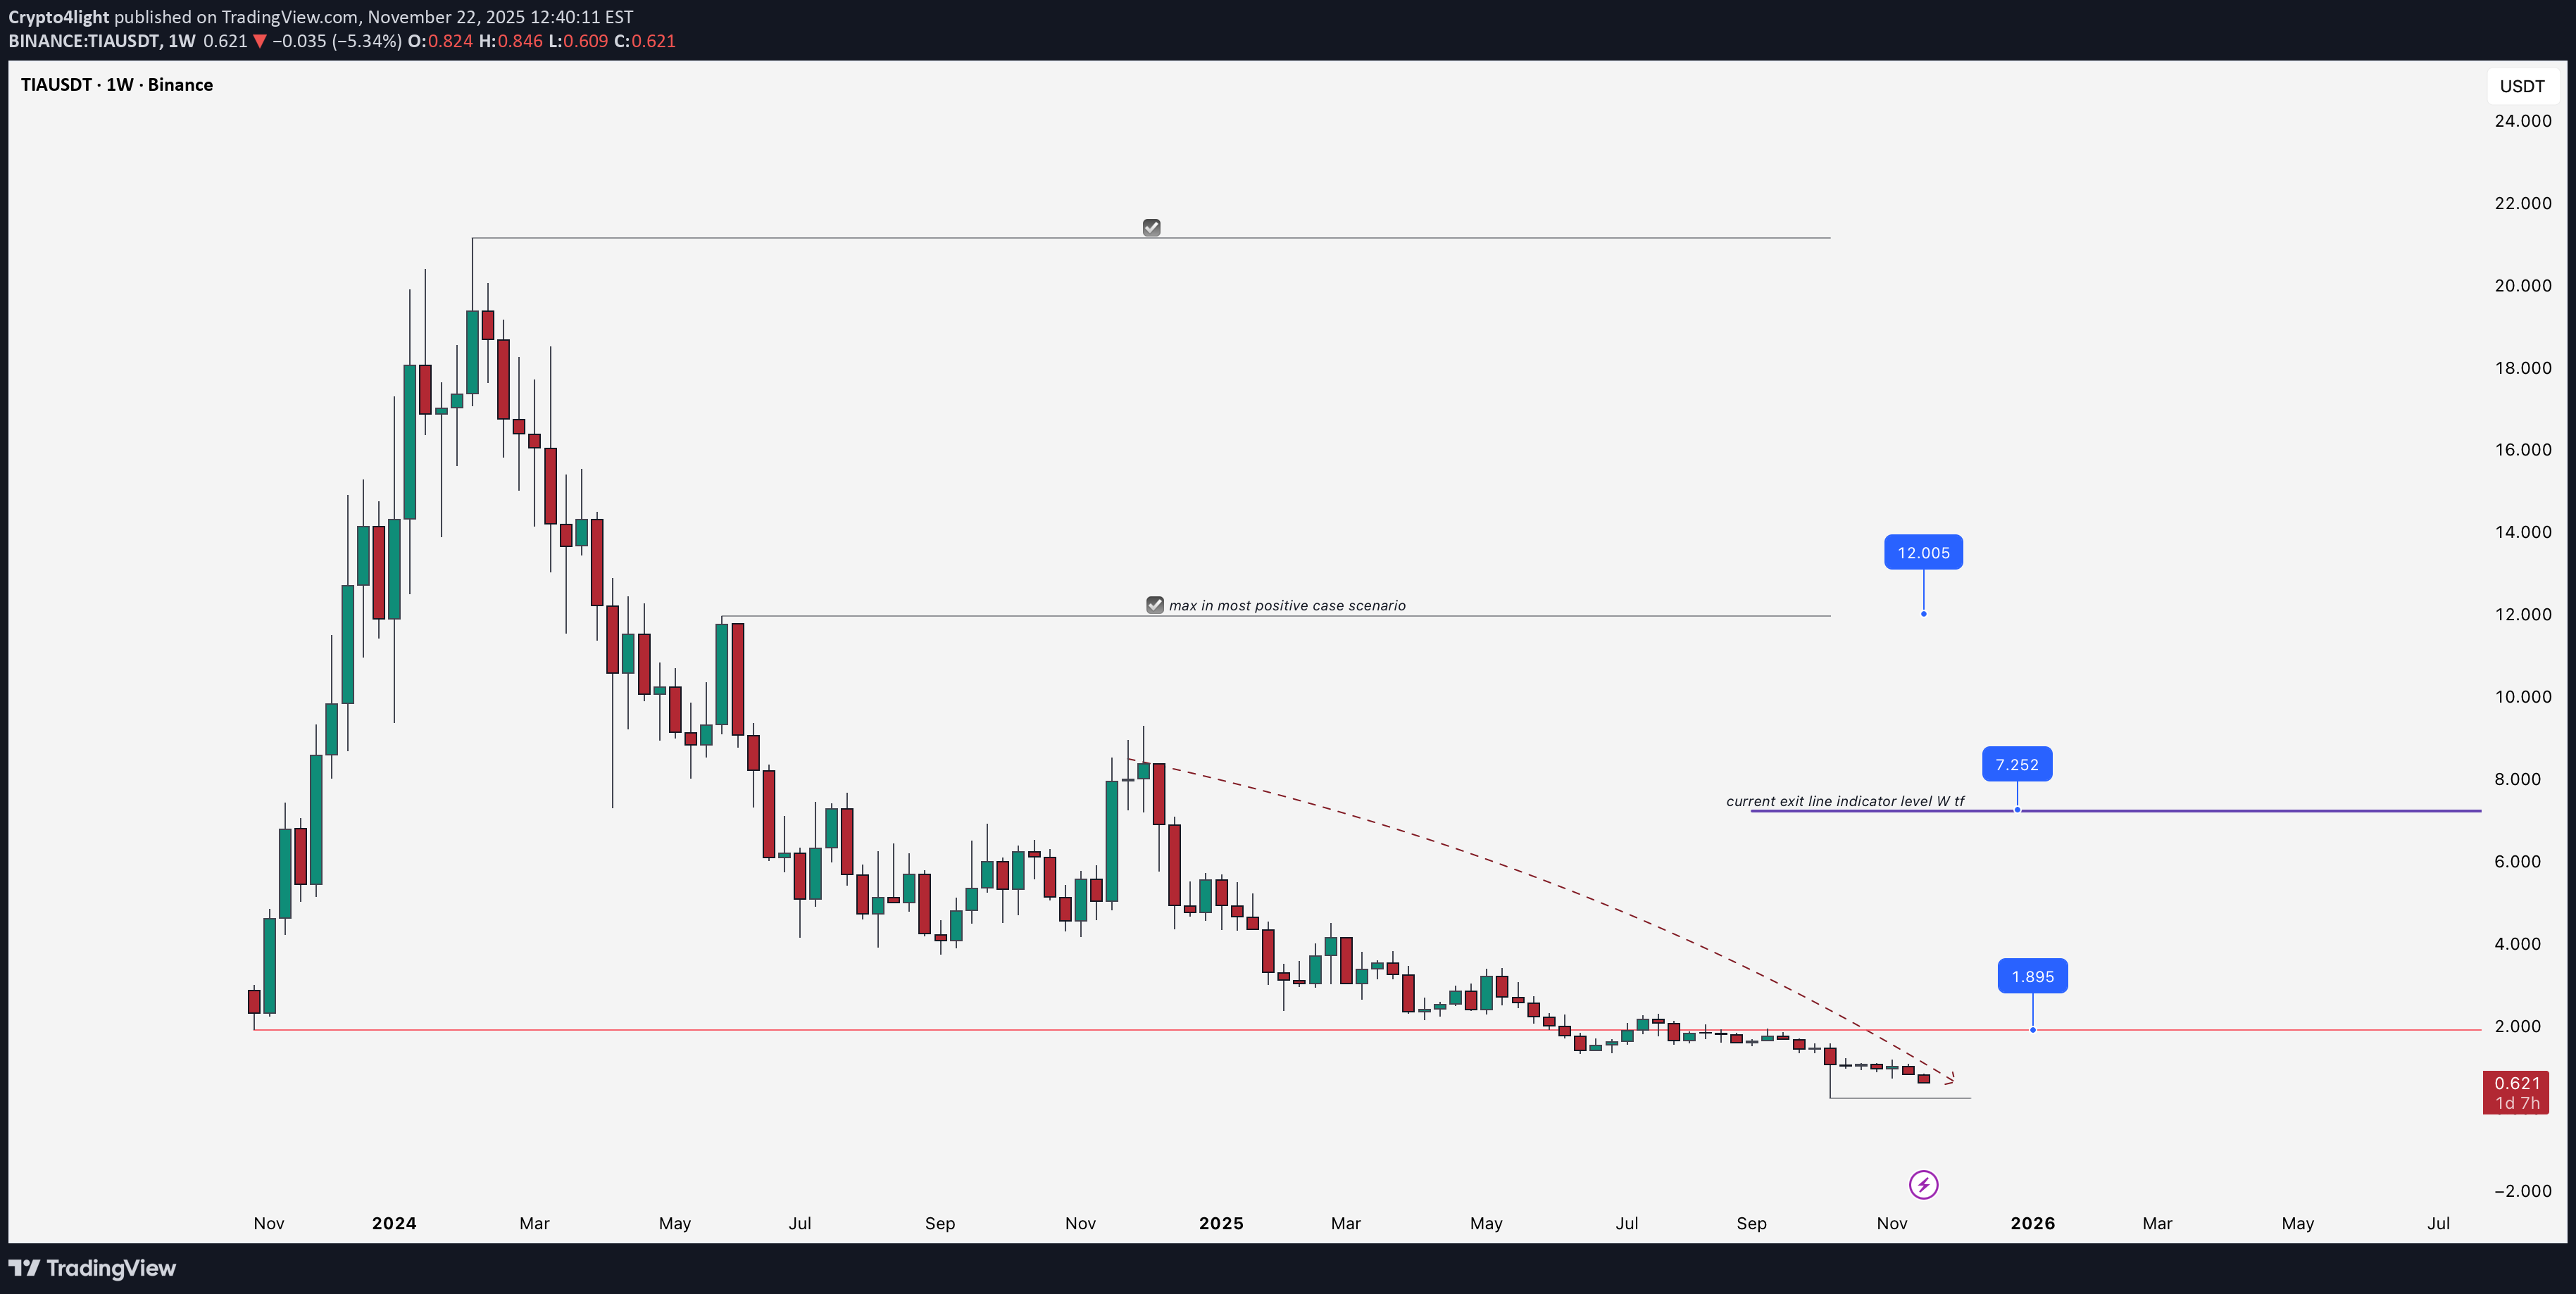
Friendly reminder: Celestia seed round in 2021 was priced at $0.01, so all those funds that participated in that round are still over 6000% in profit at current values! Even those who got in on the 2022 rounds at $0.09 cents are still over 500% in profit! So I hope you didn't miss the main analysis I posted when TIA was at its peak values! Everyone was laughing back then, saying I don't understand the technology, and stories about Celestia dropping below $1 seemed like pure fantasy to them! Now it's reality, and another reality is that Celestia as a protocol has about 50 active users per day + around $200 in daily profit from fees, and that's with $55 million raised in investor rounds! Probably only now will it start to become clear to you that fundamental metrics are just a game of marketing)) The key is simply to study the price delivery algorithm! So in the worst-case scenario, TIA will just get delisted from exchanges, like they've done with many projects! Then of course the plan will be canceled! But with positive altcoin dynamics and if Bitcoin dominance drops below 50%, then in theory we'll first close the local downward order flow, hitting the listing price first, then the exit line price for take profit, then the maximum, which in the most positive scenario is the equilibrium of the entire downward move from the peak values! Around $12!

Literaryflavus
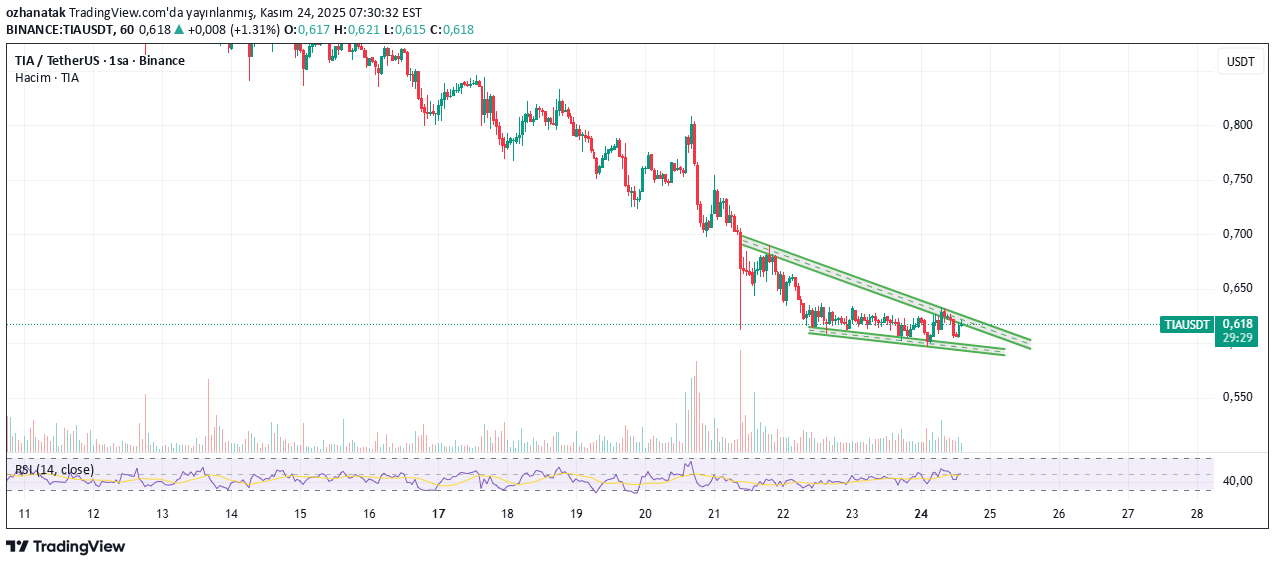
سقوط نمیکنم! چرا این سهم/ارز دیجیتال مسیر صعودی را ادامه میدهد؟ (نظر شخصی است)
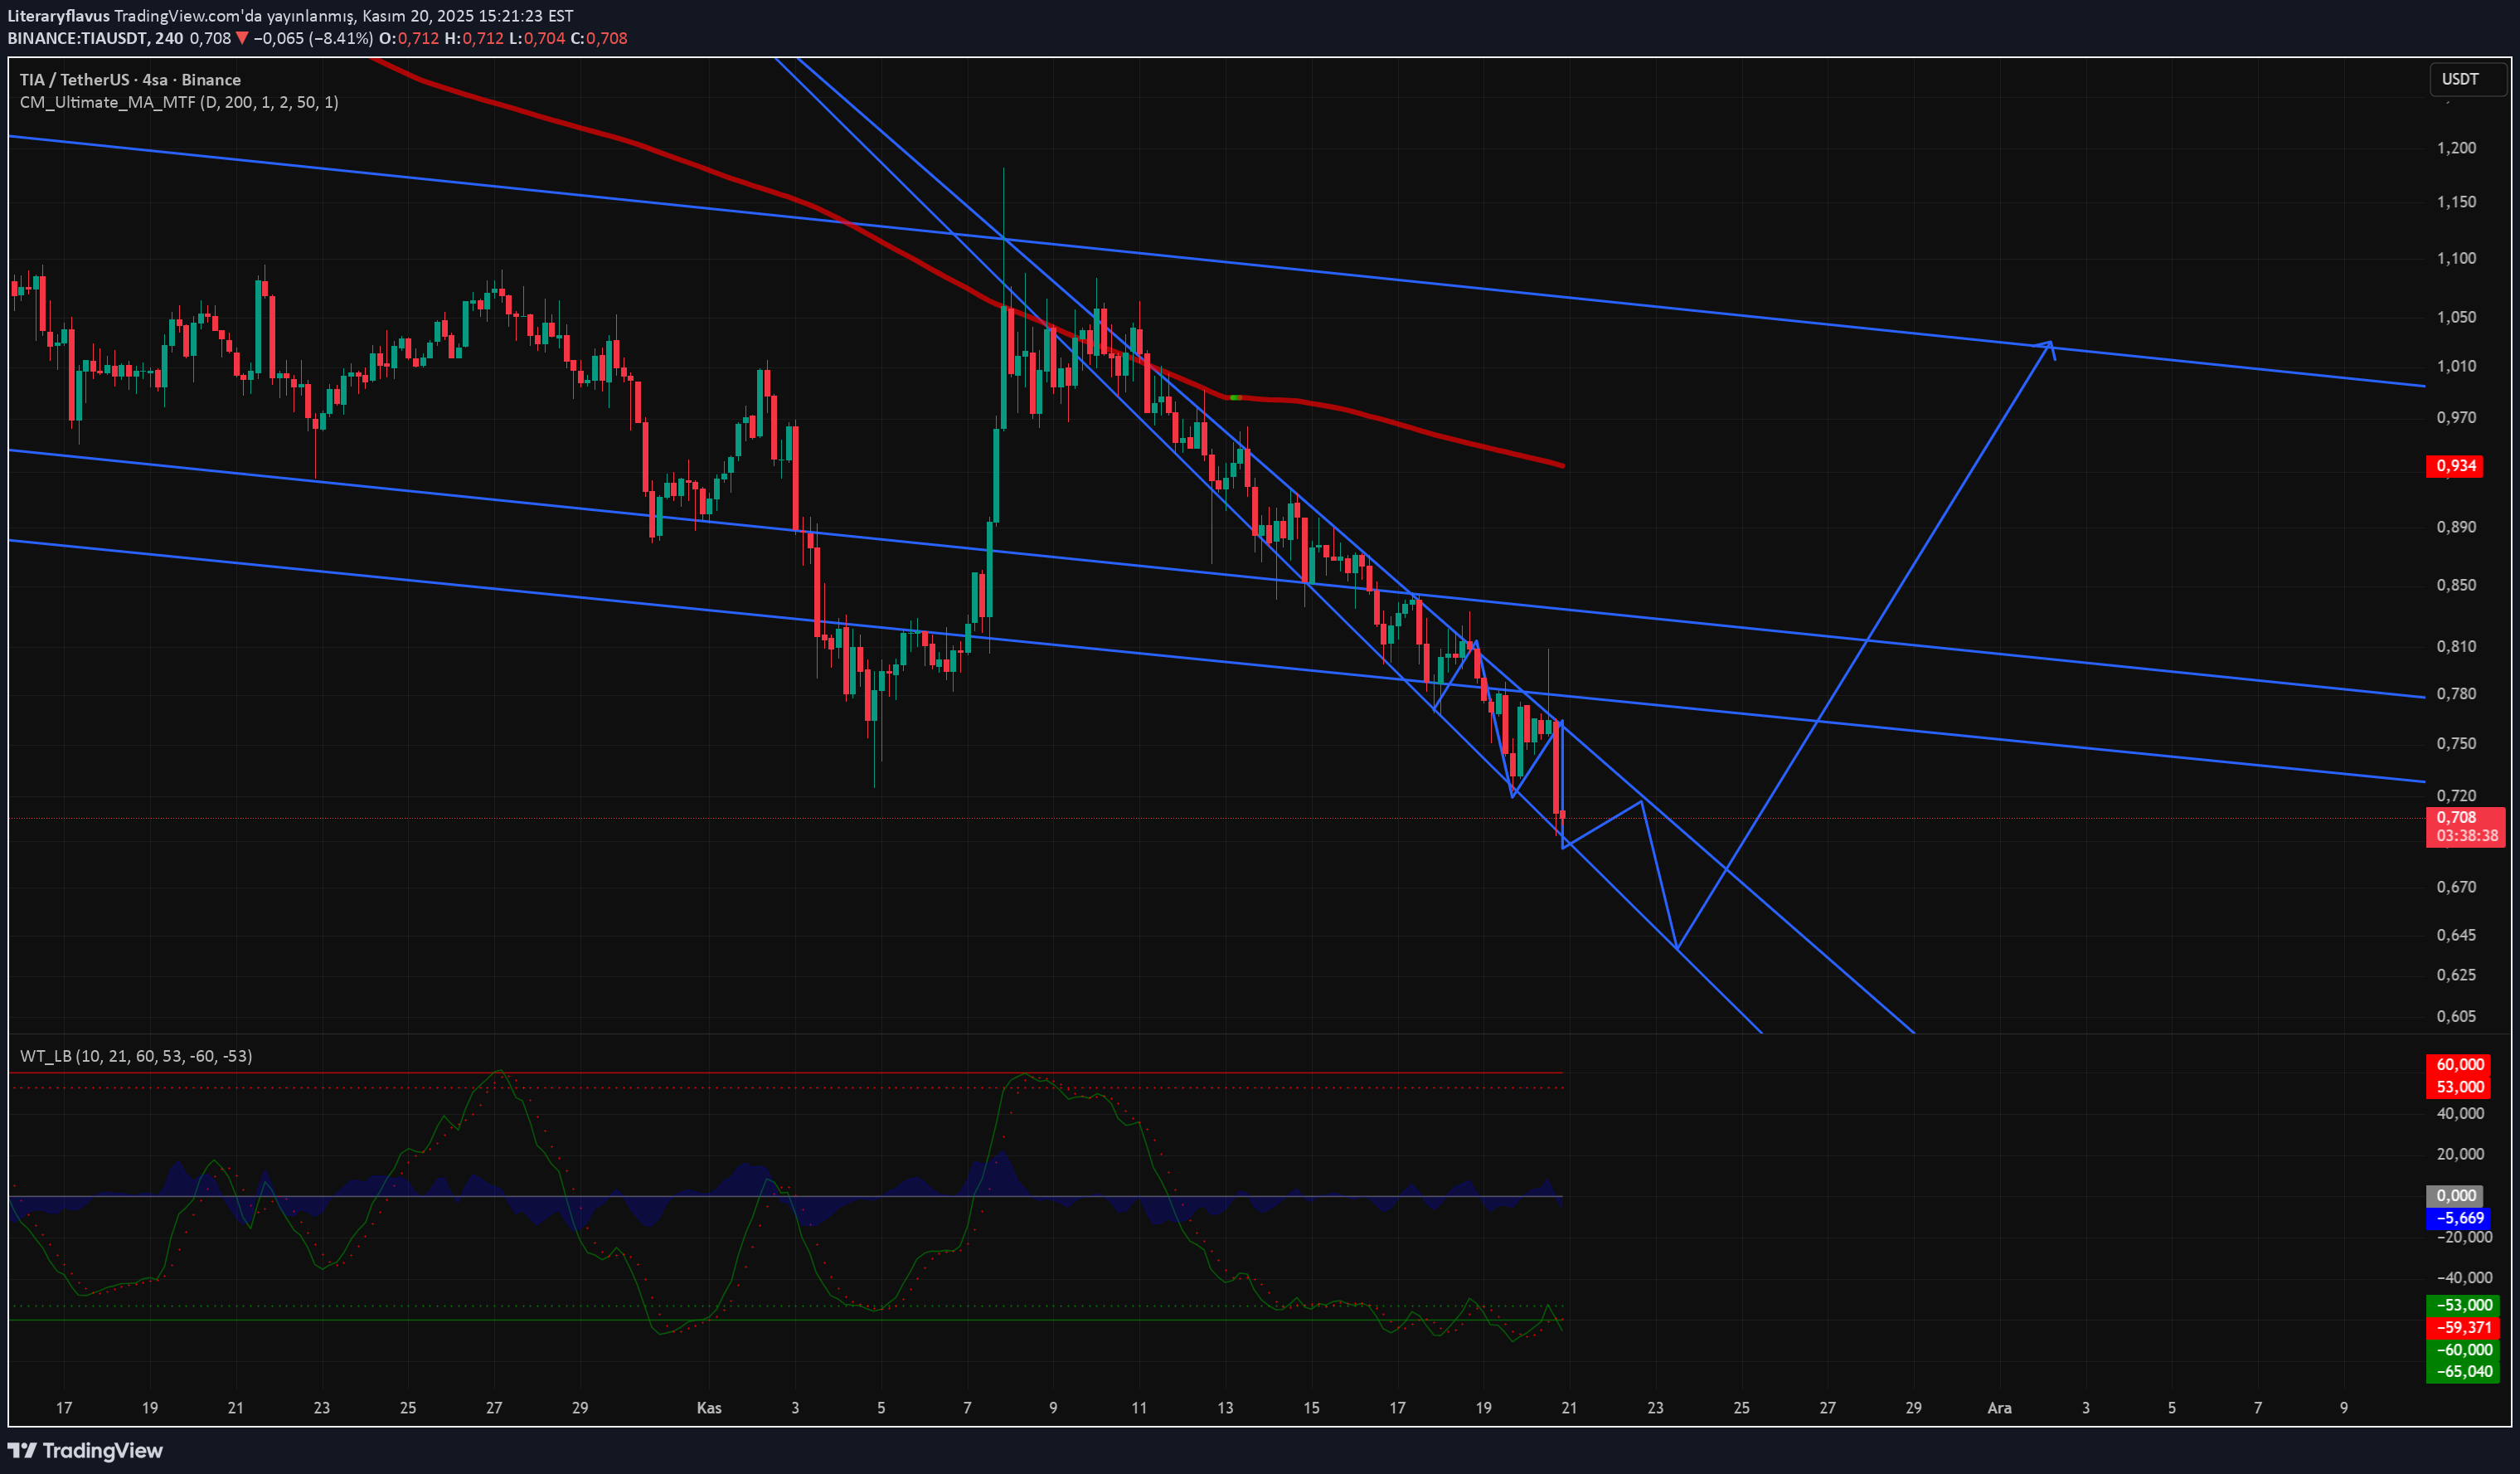
No matter what happens, the falling wedge does not break down. I'm on the bullish side. It is not investment advice. DYOR

SmallBagsHereandthere
TIA سلستیا: موشک دادههای در حال انفجار؛ از تورم ۲.۵٪ تا هدف ۱۵ دلاری!
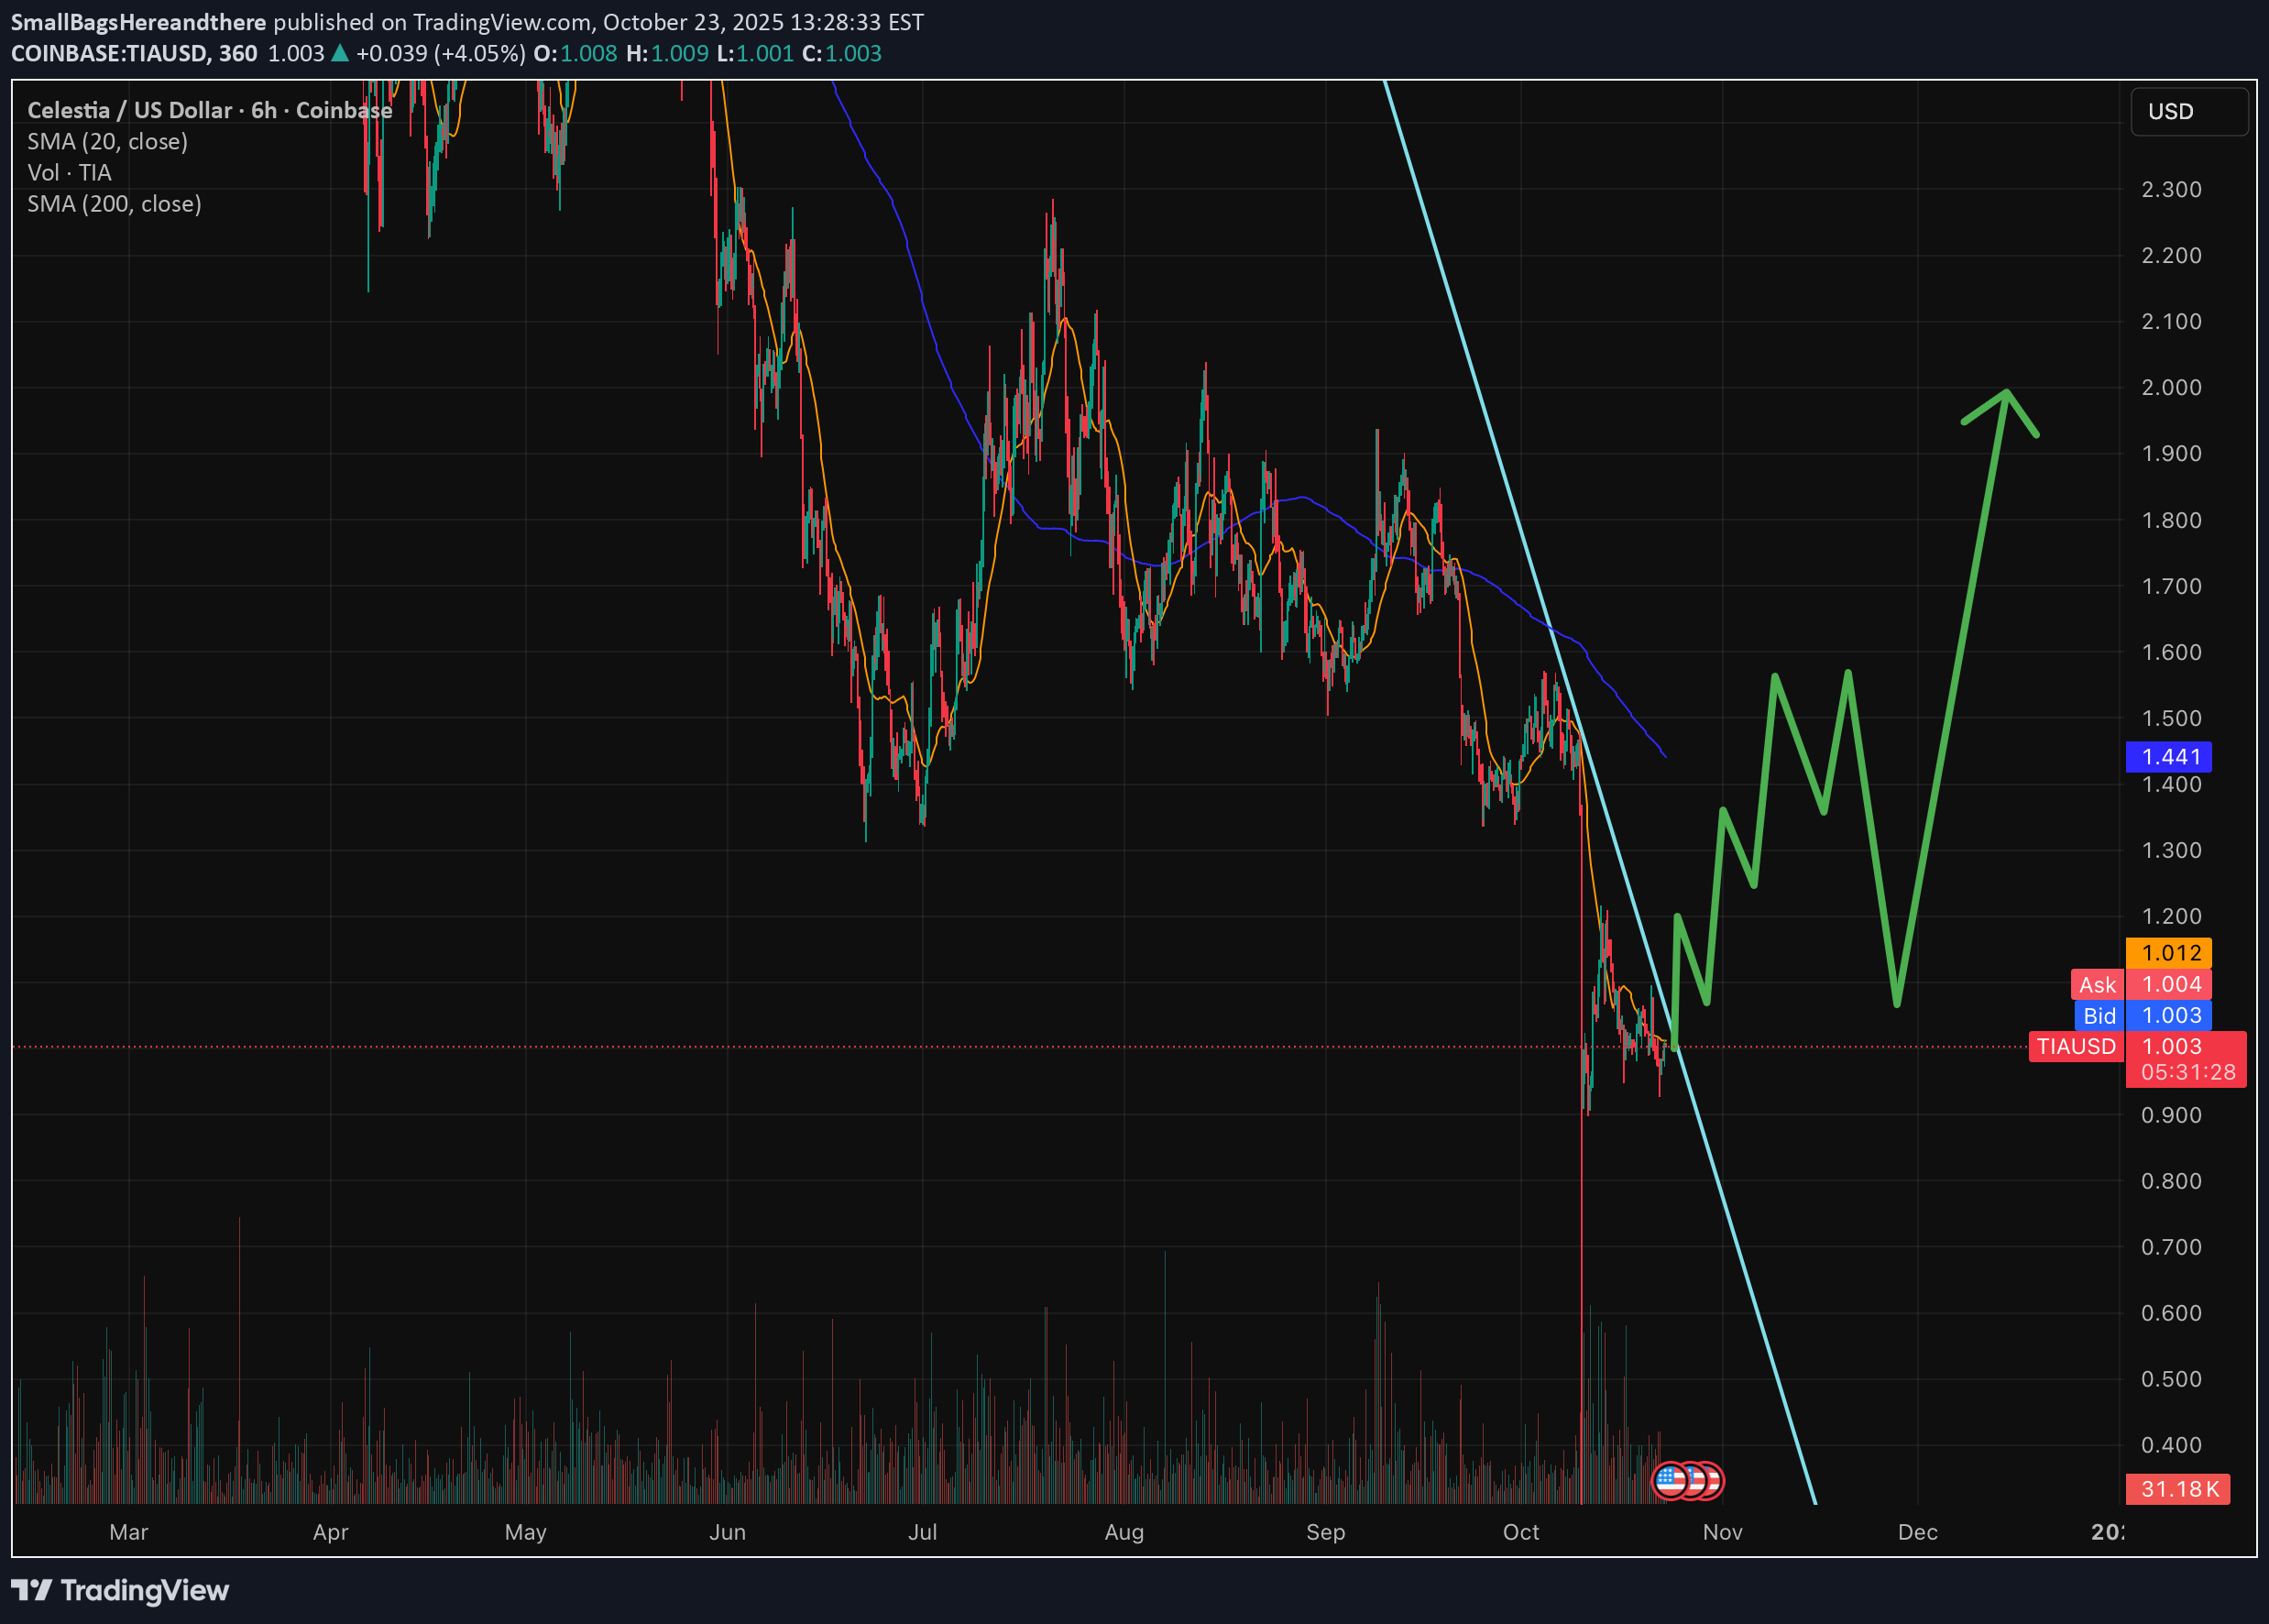
Buckle up, space cadets—Celestia's TIA token is blasting off like a modular rocket fueled by data availability dreams! As the undisputed king of separating blockchain bloat from the fun stuff, it's snagging rollups left and right (over 30 and counting, gobbling 50% of its blobspace), while the fresh Matcha upgrade slashes inflation to a svelte 2.5% and hooks up Hyperlane for seamless cross-chain shenanigans. Sure, October's token unlocks might sprinkle some stardust sell-off, but with analysts eyeing $15–$21 peaks by year's end amid bullish reversal charts screaming "higher highs ahead," this isn't just a moonshot—it's a full-on galactic takeover. HODL tight; your portfolio's about to feel the gravity of gains!
Disclaimer
Any content and materials included in Sahmeto's website and official communication channels are a compilation of personal opinions and analyses and are not binding. They do not constitute any recommendation for buying, selling, entering or exiting the stock market and cryptocurrency market. Also, all news and analyses included in the website and channels are merely republished information from official and unofficial domestic and foreign sources, and it is obvious that users of the said content are responsible for following up and ensuring the authenticity and accuracy of the materials. Therefore, while disclaiming responsibility, it is declared that the responsibility for any decision-making, action, and potential profit and loss in the capital market and cryptocurrency market lies with the trader.