
SXP
Swipe
| تریدر | نوع سیگنال | حد سود/ضرر | زمان انتشار | مشاهده پیام |
|---|---|---|---|---|
No results found. | ||||
Price Chart of Swipe
سود 3 Months :
سیگنالهای Swipe
Filter
Sort messages by
Trader Type
Time Frame

CryptoAnalystSignal
پیشبینی انفجاری SXP/USDT: فرصت خرید در کانال صعودی با اهداف جدید!
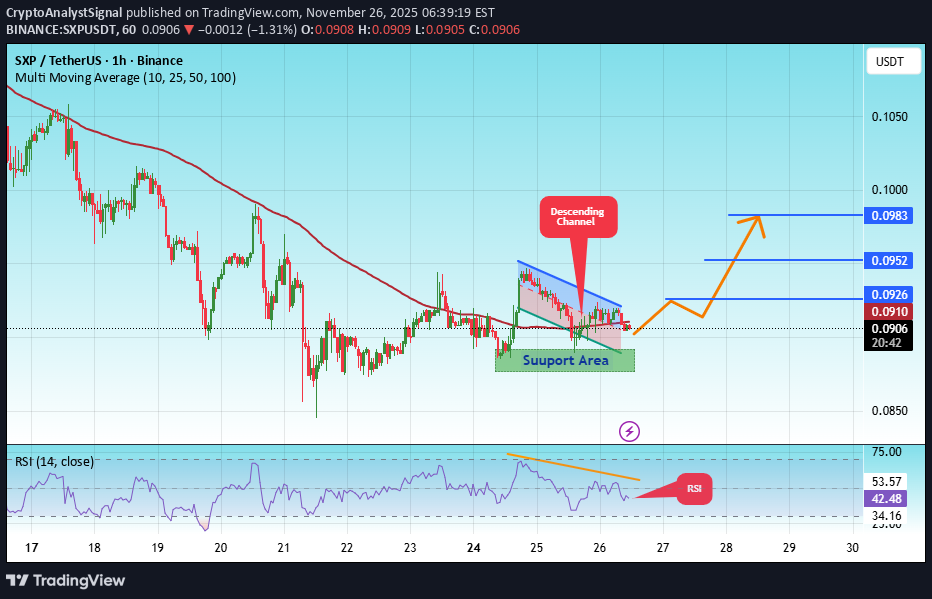
#SXP The price is moving within an ascending channel on the 1-hour timeframe and is adhering to it well. It is poised to break out strongly and retest the channel. We have a downtrend line on the RSI indicator that is about to break and retest, which supports the upward move. There is a key support zone in green at 0.0882, representing a strong support point. We have a trend of consolidation above the 100-period moving average. Entry price: 0.0907 First target: 0.0910 Second target: 0.0952 Third target: 0.0983 Don't forget a simple money management rule: Place your stop-loss order below the green support zone. Once you reach the first target, save some money and then change your stop-loss order to an entry order. For any questions, please leave a comment. Thank you.

AndrewsMarket-Mastery
سیگنال انفجاری SXP: الگوی نهنگ پنهان و احتمال رشد ۱۰۰ درصدی!

SXP/USDT appears to be forming a classic falling wedge pattern—one that’s showing increased volume and heightened interest from the investing community. The narrowing range and converging trendlines hint at a compression of volatility, which often precedes a breakout to the upside. Given the current accumulation phase and strong volume behind recent dips, this setup looks primed for a potential surge that could deliver a 90% to 100%+ move if bullish momentum kicks in. On the fundamentals, SXP (Solar) is re-positioning itself as a Layer-1 blockchain with a focus on scalability and real-world use cases, which is gaining traction among investors seeking projects beyond the top tier. While its circulating supply of over 660 million tokens and market cap around US$75 million still classify it as a small-cap crypto, that very characteristic offers higher upside if it catches a breakout and rotates into the spotlight. The rising volume metrics signal rediscovered interest, which may be the catalyst for a strong breakout. In terms of strategy, traders should look for a clean breakout above the upper boundary of the wedge with convincing volume. That breakout will serve as the trigger to enter long positions, while risk should be defined by placing stops just below the recent swing low or below the support trendline of the wedge. Given the pattern and expected move of near 90% to 100%+, the risk-reward is compelling—but as always, proper position sizing and discipline are key. In short, SXP/USDT is flashing a high-probability reversal setup with structural, volume, and sentiment alignment now converging. If the breakout confirms, this could be one of the standout altcoin moves to watch. Show your support by hitting the like button and Leaving a comment below! (What is You opinion about this Coin) Your feedback and engagement keep me inspired to share more insightful market analysis with you!

Bithereum_io
تحلیل SXP/USDT: فرصت خرید در کف الگوی گُوِه نزولی با اهداف صعودی هیجانانگیز!
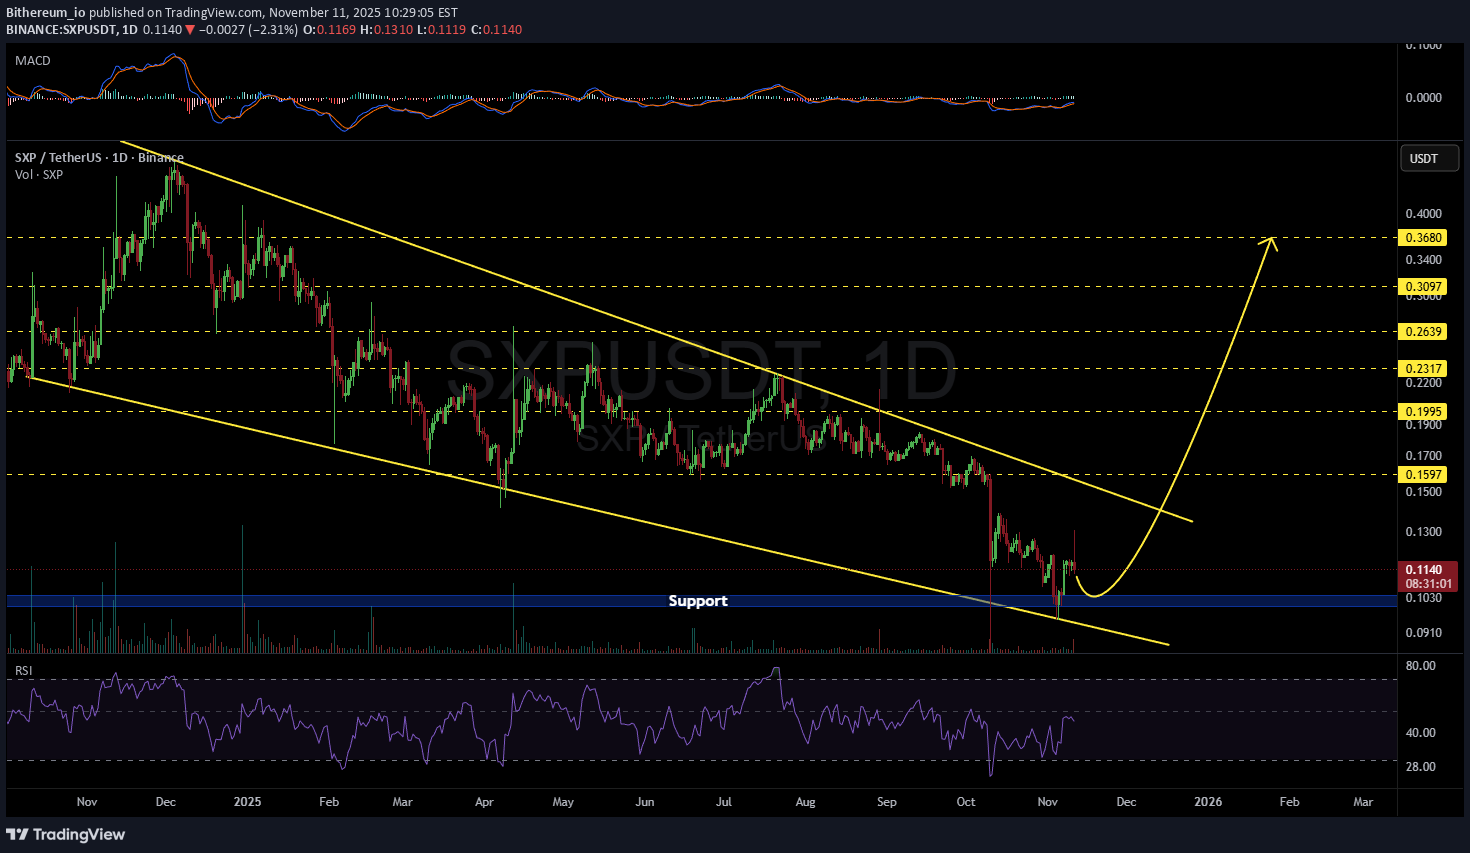
#SXP is moving inside a falling wedge pattern on the daily chart. Consider buying a small bag here and near the support shown on the chart. In case of a breakout above the wedge resistance, the potential targets are: 🎯 $0.1597 🎯 $0.1995 🎯 $0.2317 🎯 $0.2639 🎯 $0.3097 🎯 $0.3680 ⚠️ Always use a tight stop-loss and apply proper risk management.

DragonCaoB
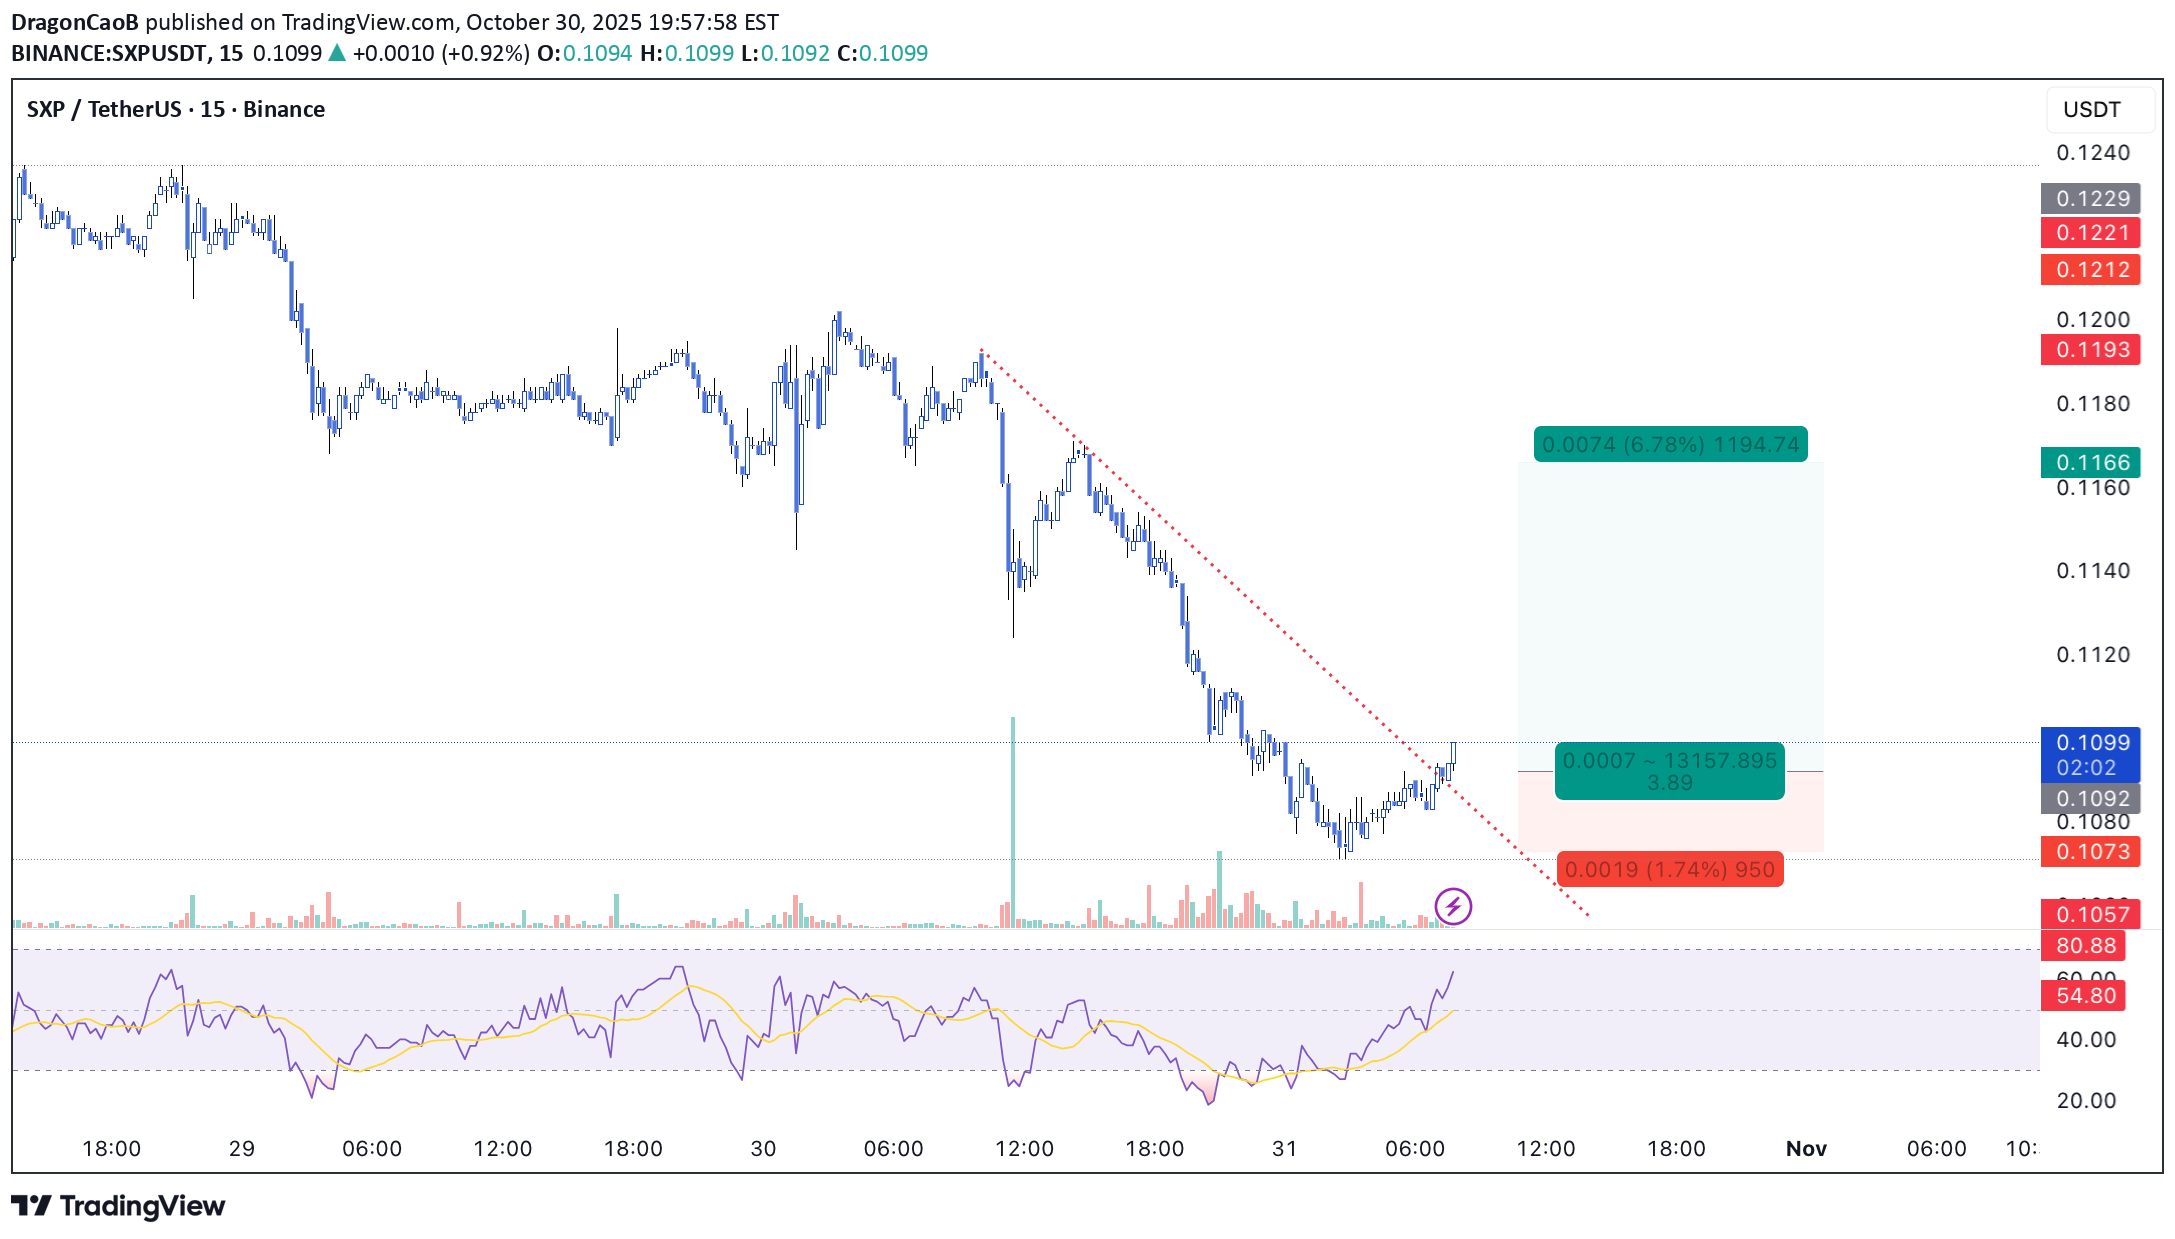
خرید بزرگ SXP: سیگنال صعود قوی با حجم بالا (استراتژی اسکالپ)
💎 Scalp Long – SXP Price has broken out of the descending channel and completed its retest successfully. RSI is in the buying zone, while buying volume continues to rise sharply, confirming bullish momentum. 🎯 Trade Setup: → TP: 0.1108 | SL: 0.098 | RR: 1 : 3.13 Structure, momentum, and volume are aligned — suggesting a strong upside continuation as SXP begins its recovery phase.
DragonCaoB
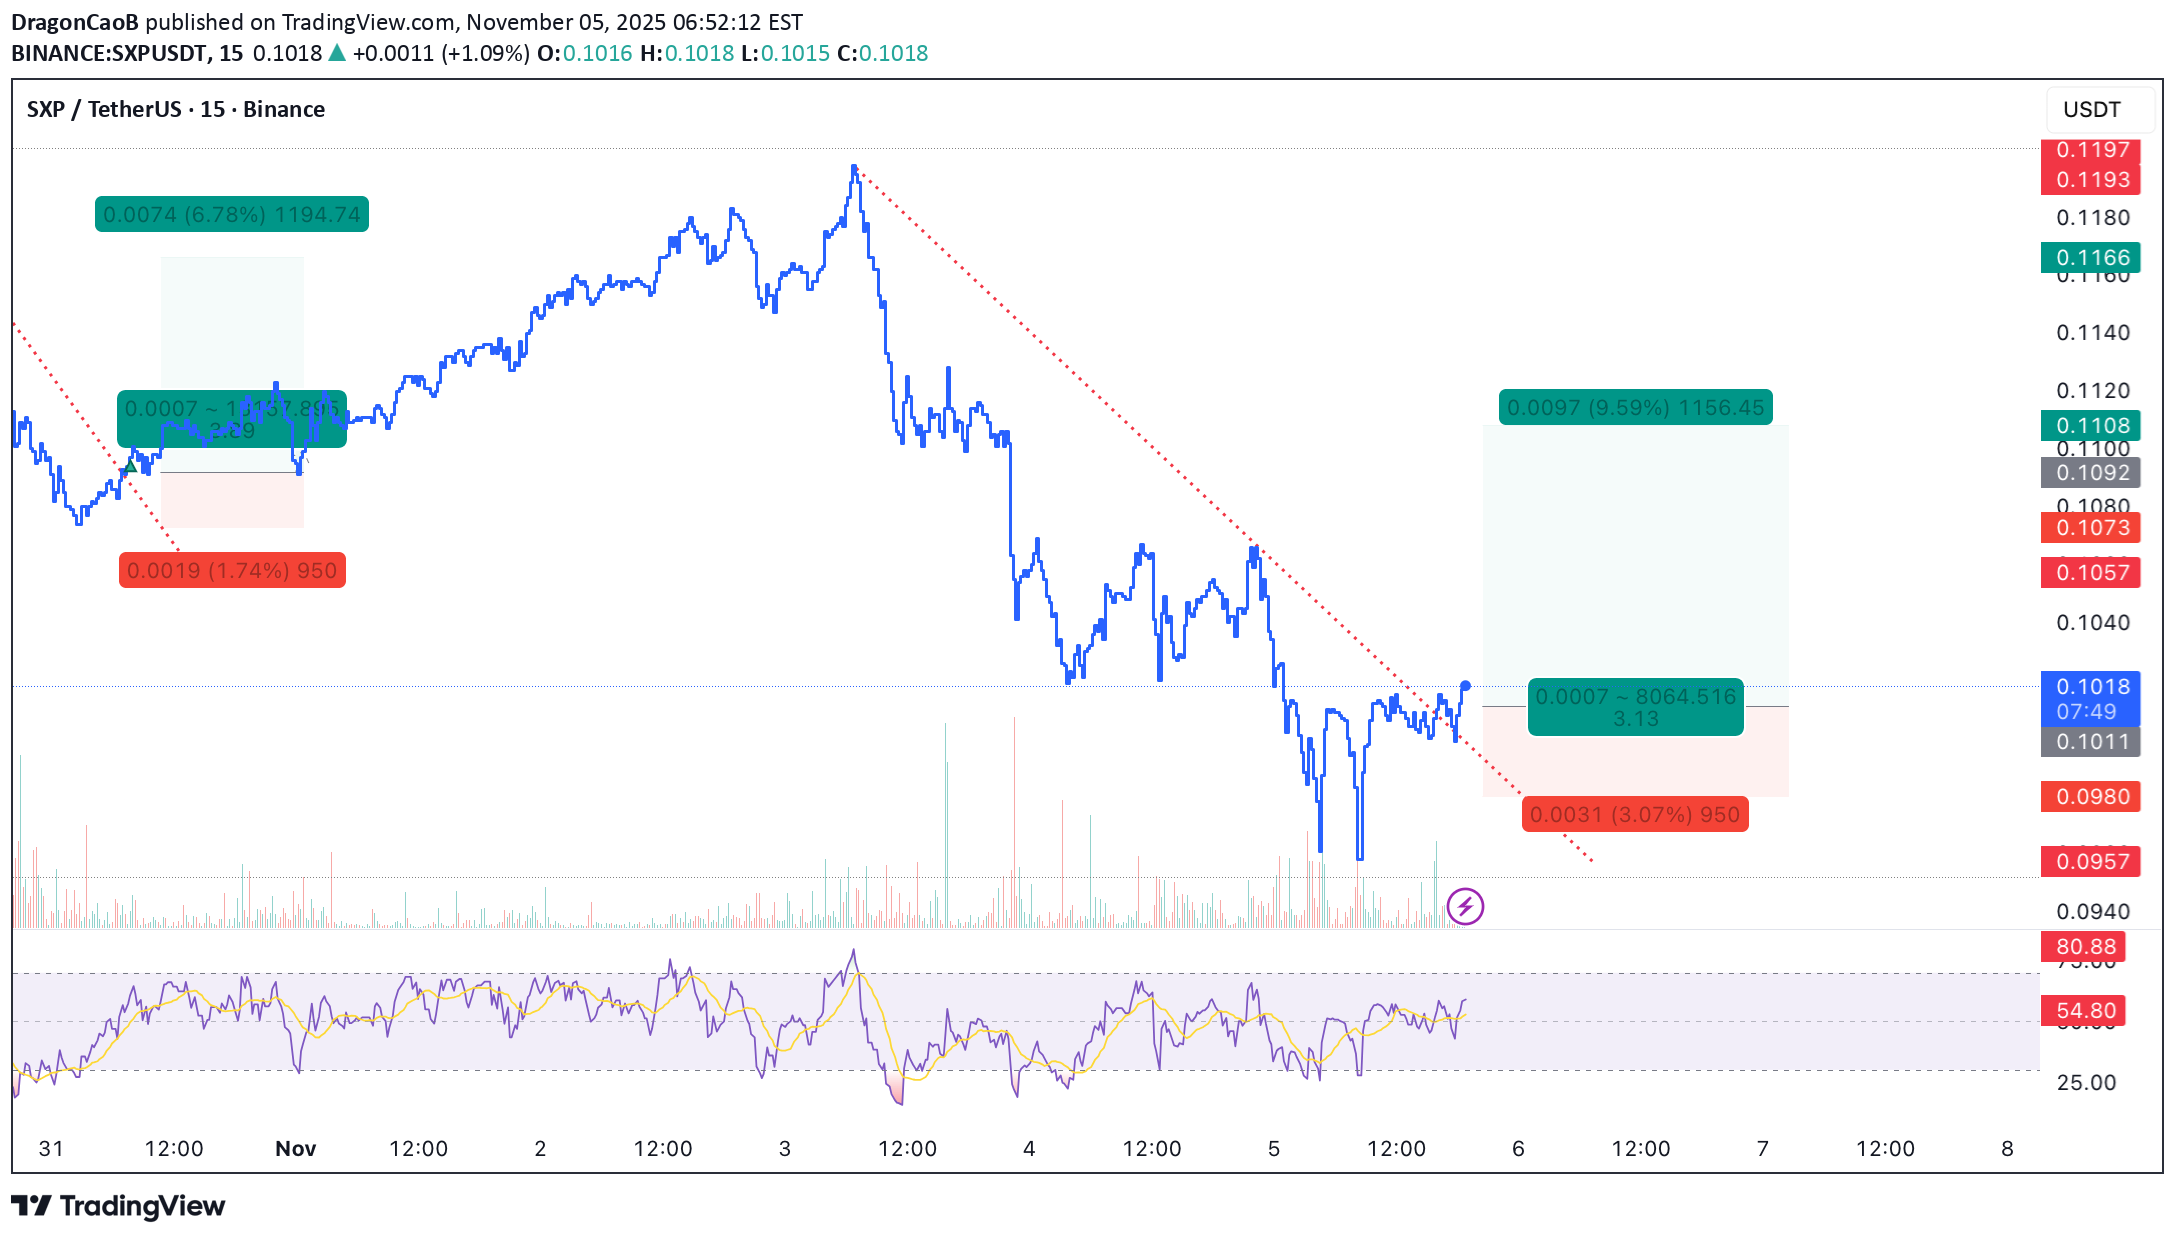
سیگنال خرید SXP: فرصت اسکالپ با سود 1 به 3.89 (RSI آماده پرواز)
💎 Scalp Long – SXP RSI is in the buying zone, and price has broken out of the short-term downtrend, confirming a shift in momentum. Buying volume is increasing across lower timeframes, reinforcing bullish sentiment. 🎯 Plan: → Enter after confirmation of breakout strength. → TP: 0.1168 | SL: 0.1057 | RR: 1 : 3.89 Momentum aligns with the long side. Keep entries clean, trail SL as price rises. Patience and precision — only enter when setup confirms clearly

Kapitalist01
DragonCaoB
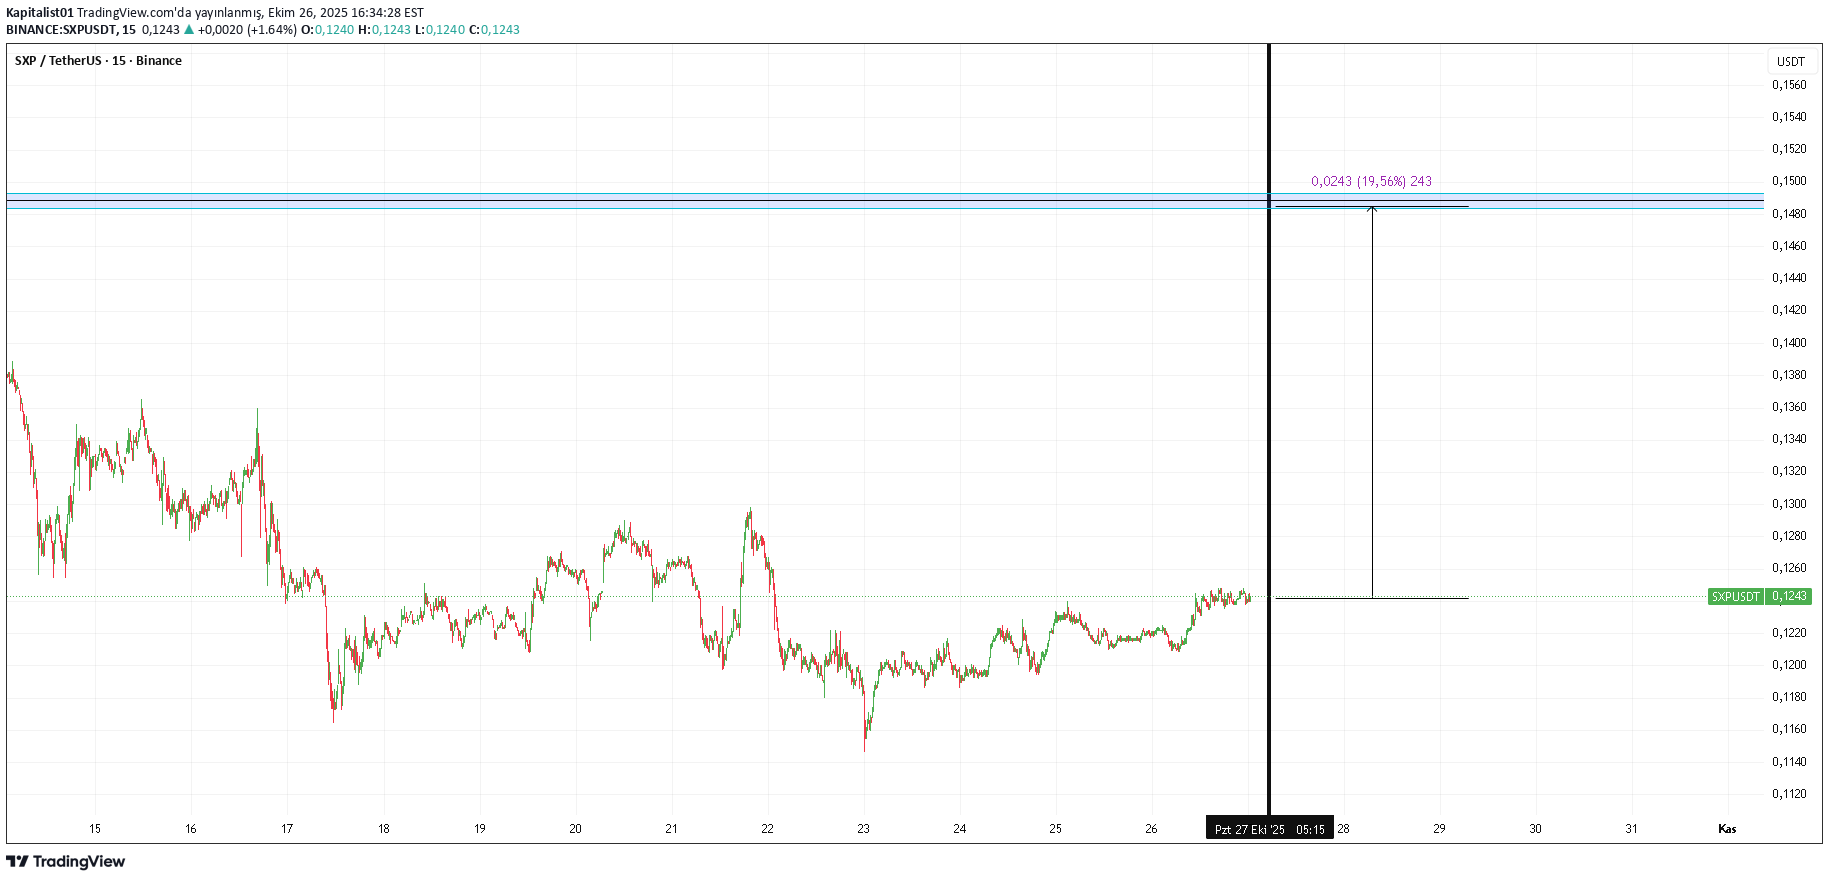
سیگنال خرید قدرتمند SXP: فرصت اسکالپ با سود ۲ برابری!
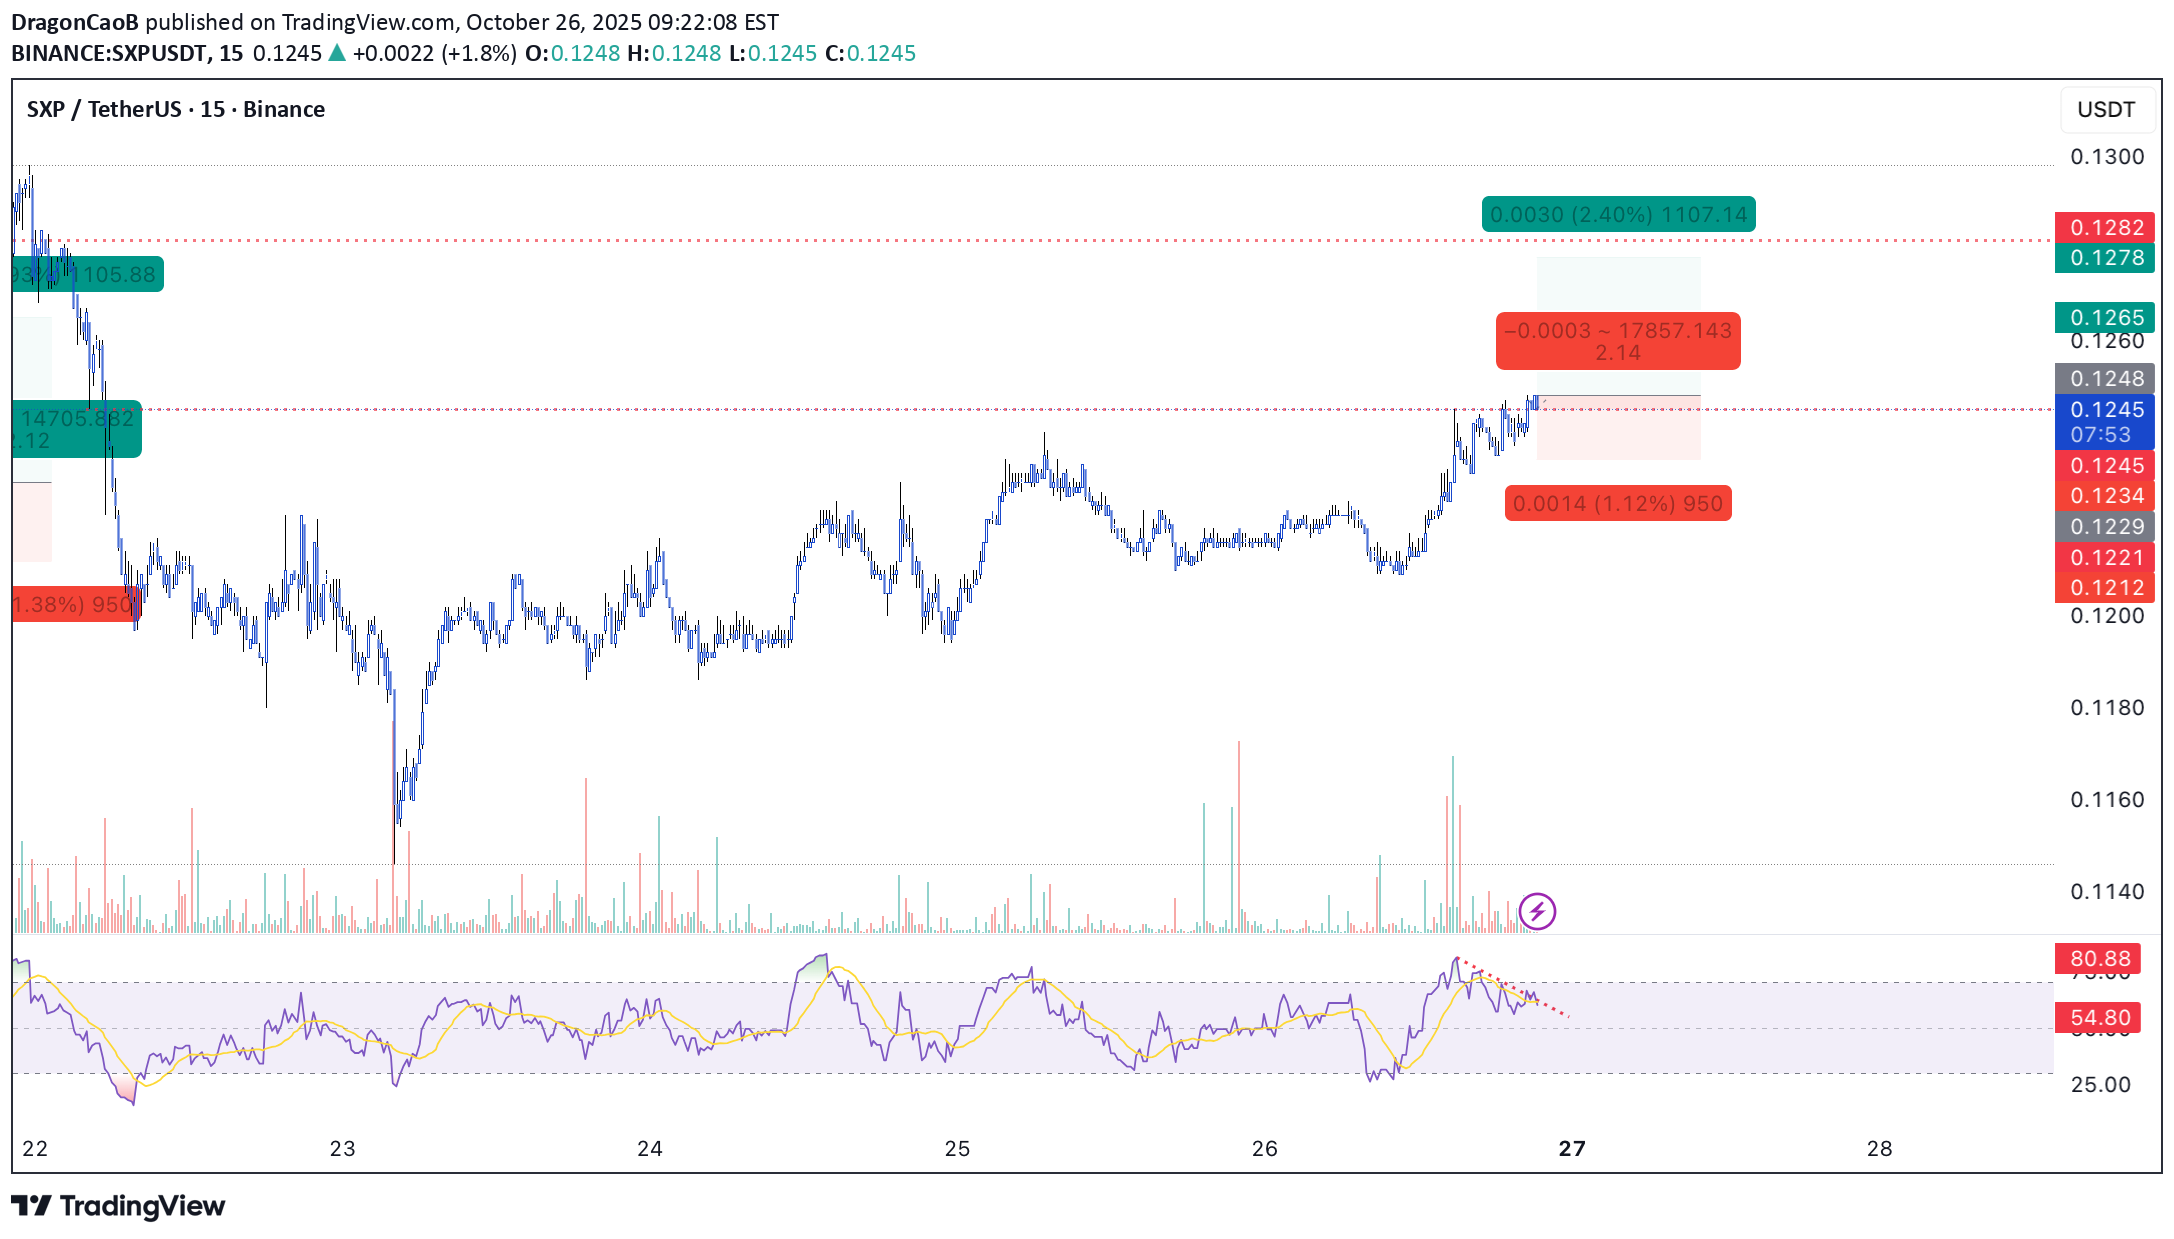
💎 Scalp Long – SXP RSI has broken out from the corrective trend and is now in the strong buy zone. Price shows strong bullish momentum, breaking through major resistance. Buying volume is returning, confirming renewed market strength. The move continues toward testing the local high. 🎯 Plan: → Enter after candle confirmation above resistance. → TP: 0.1278 | SL: 0.1229 | RR: 1 : 2.14 Momentum favors the long side. Keep entries precise, trail SL as price gains. Patience and discipline — wait for the setup to confirm.
CryptoAnalystSignal
تحلیل انفجاری SXP/USDT: زمان ورود به قله جدید فرا رسید!
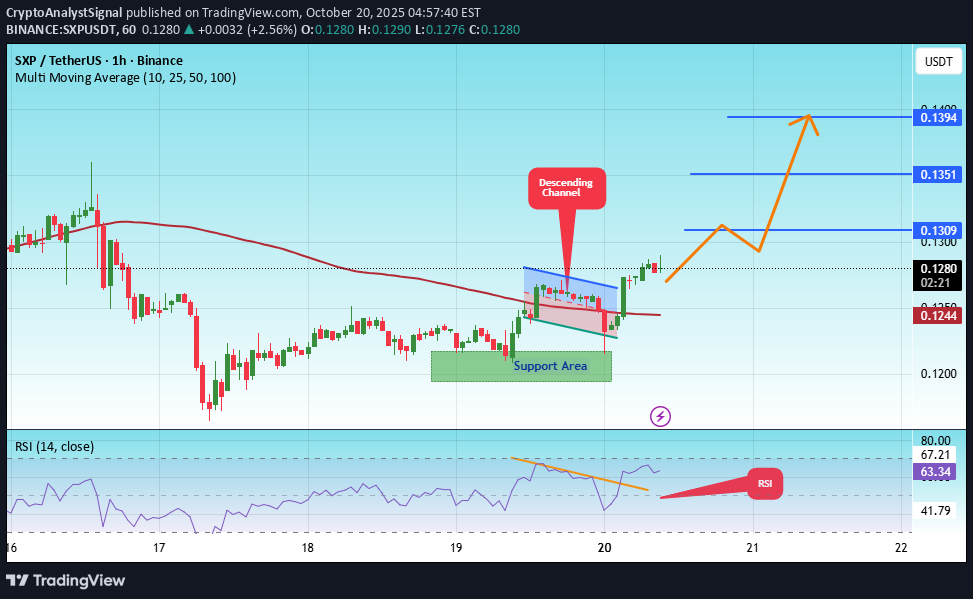
#SXP The price is moving within a descending channel on the 1-hour frame, adhering well to it, and is heading for a strong breakout and retest. We have a bearish trend on the RSI indicator that is about to be broken and retested, which supports the upward breakout. There is a major support area in green at 0.1205, which represents a strong support point. We are heading for consolidation above the 100 moving average. Entry price: 0.1282 First target: 0.1309 Second target: 0.1351 Third target: 0.1394 Don't forget a simple matter: capital management. When you reach the first target, save some money and then change your stop-loss order to an entry order. For inquiries, please leave a comment. Thank you.
Kapitalist01
سرمایهگذاری کوتاهمدت: رازهای نمودار دقیقهای که نباید از دست بدهید!
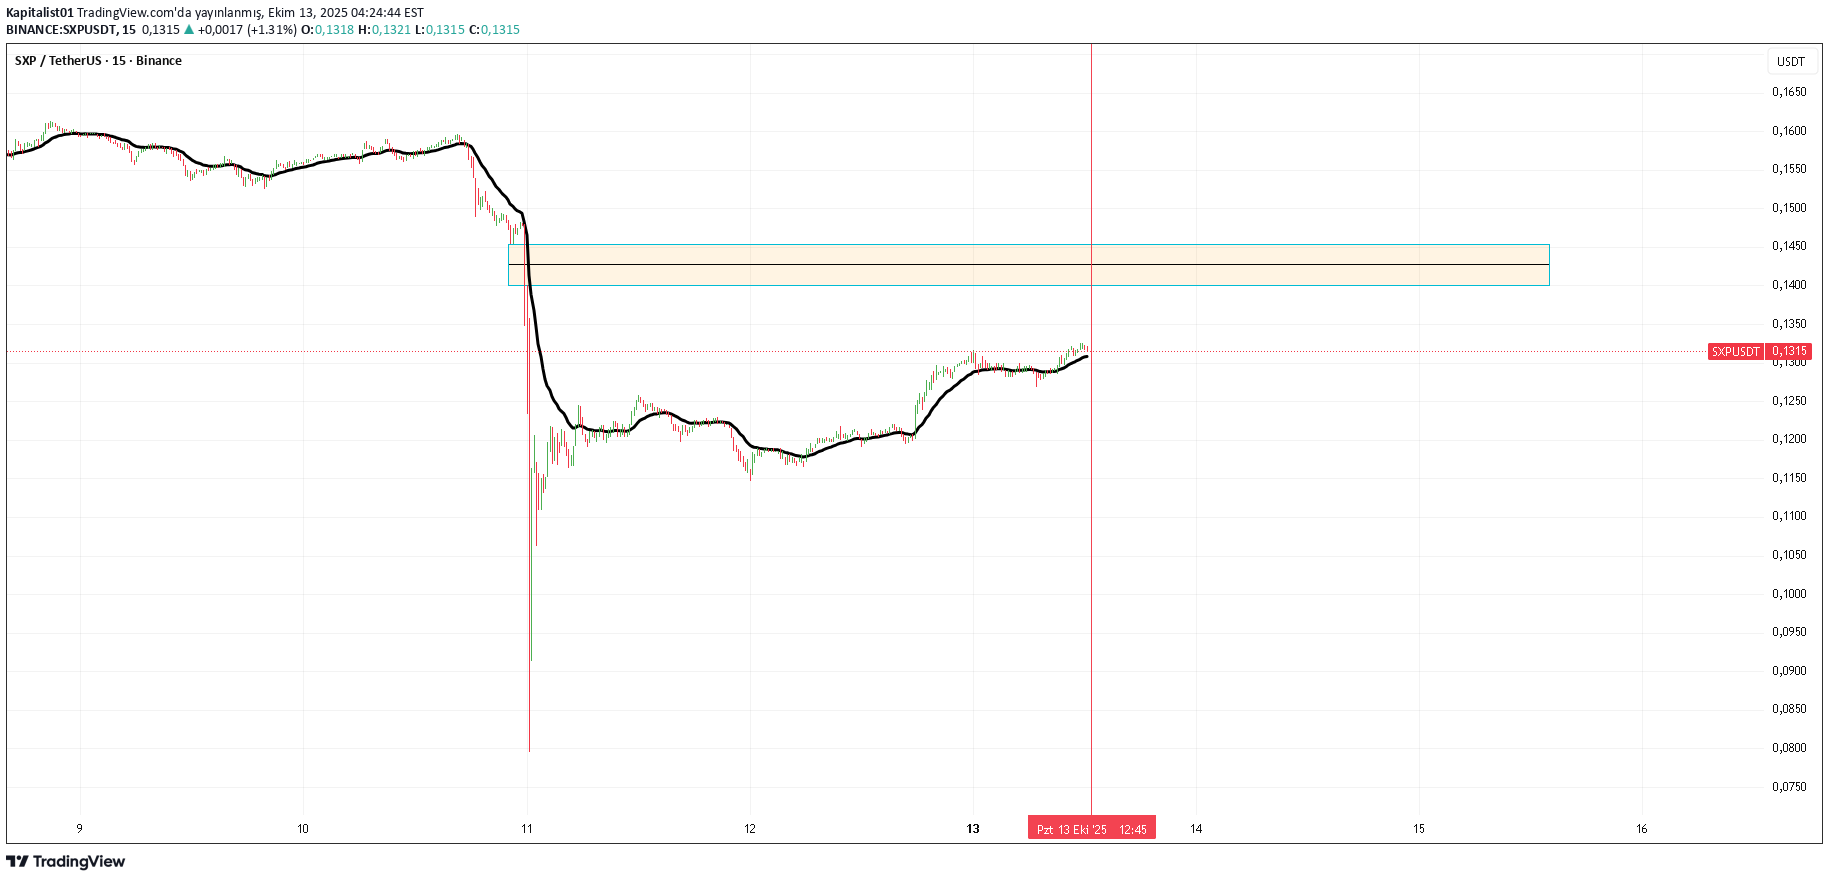
It is not investment advice short term transaction viewed on minute chart
CryptoAnalystSignal
تحلیل تکنیکال SXP/USDT: سیگنال صعودی قوی با اهداف مشخص!

#SXP The price is moving within a descending channel on the 1-hour frame, adhering well to it, and is heading for a strong breakout and retest. We have a bearish trend on the RSI indicator that is about to be broken and retested, which supports the upward breakout. There is a major support area in green at 0.1580, which represents a strong support point. We are heading for consolidation above the 100 moving average. Entry price: 0.1619 First target: 0.1637 Second target: 0.1662 Third target: 0.1691 Don't forget a simple matter: capital management. When you reach the first target, save some money and then change your stop-loss order to an entry order. For inquiries, please leave a comment. Thank you.
Disclaimer
Any content and materials included in Sahmeto's website and official communication channels are a compilation of personal opinions and analyses and are not binding. They do not constitute any recommendation for buying, selling, entering or exiting the stock market and cryptocurrency market. Also, all news and analyses included in the website and channels are merely republished information from official and unofficial domestic and foreign sources, and it is obvious that users of the said content are responsible for following up and ensuring the authenticity and accuracy of the materials. Therefore, while disclaiming responsibility, it is declared that the responsibility for any decision-making, action, and potential profit and loss in the capital market and cryptocurrency market lies with the trader.